INTRODUCTION
Artemia is a branchiopod crustacean commonly known as the brine shrimp. Currently, six well-characterized bisexuals (Artemia salina Leach 1819, Artemia urmiana Günther 1899, Artemia franciscana Kellogg 1906, Artemia persimilis Piccinelli & Prosdocimi 1968, Artemia sinica Cai 1989, and Artemia tibetiana Abatzopoulos, Zhang & Sorgeloos Reference Abatzopoulos, Zhang and Sorgeloos1998) and a large number of obligate parthenogenetic strains are widely recognized (Triantaphyllidis et al., Reference Triantaphyllidis, Criel, Abatzopoulos, Thomas, Peleman, Beardmore and Sorgeloos1997; Abatzopoulos et al., Reference Abatzopoulos, Beardmore, Clegg and Sorgeloos2002a, Reference Abatzopoulos, Kappas, Bossier, Sorgeloos and Beardmoreb; Gajardo et al., Reference Gajardo, Abatzopoulos, Kappas, Beardmore, Abatzopoulos, Beardmore, Clegg and Sorgeloos2002, Reference Gajardo, Crespo, Triantafyllidis, Tzika, Baxevanis, Kappas and Abatzopoulos2004; Baxevanis & Abatzopoulos, Reference Baxevanis and Abatzopoulos2004; Baxevanis et al., Reference Baxevanis, Kappas and Abatzopoulos2006; Kappas et al., Reference Kappas, Baxevanis, Maniatsi and Abatzopoulos2009; Maniatsi et al., Reference Maniatsi, Kappas, Baxevanis, Farmaki and Abatzopoulos2009a, Reference Maniatsi, Baxevanis, Kappas, Deligiannidis, Triantafyllidis, Papakostas, Bougiouklis and Abatzopoulos2011). All bisexual species are diploid, while asexual populations may be diploid, polyploid or a mixture of different ploidies (Abatzopoulos et al., Reference Abatzopoulos, Kastritsis and Triantaphyllidis1986, Reference Abatzopoulos, Beardmore, Clegg and Sorgeloos2002a; Maniatsi et al., Reference Maniatsi, Baxevanis, Kappas, Deligiannidis, Triantafyllidis, Papakostas, Bougiouklis and Abatzopoulos2011).
Artemia is typically found in saline and hypersaline coastal or inland habitats worldwide with the exception of Antarctica. These communities are considerably diverse in terms of their physical, chemical and biotic conditions (Triantaphyllidis et al., Reference Triantaphyllidis, Abatzopoulos and Sorgeloos1998; Van Stappen, Reference Van Stappen, Abatzopoulos, Beardmore, Clegg and Sorgeloos2002). Like other inland water organisms, Artemia shows a patchy distribution in continental ‘islands’, with limited capacity for active dispersal (Bilton et al., Reference Bilton, Freeland and Okamura2001). From a biogeographical perspective, a sharp divide can be outlined demarcating the native distributions of A. persimilis and A. franciscana in the ‘New World’ from those of the other bisexuals and parthenogens in the ‘Old World’. However, since the early 1980s, A. franciscana populations have also been recorded in Europe (Portugal, Spain, France and Italy) (Thiéry & Robert, Reference Thiéry and Robert1992; Amat et al., Reference Amat, Hontoria, Ruiz, Green, Sánchez, Figuerola and Hortas2005; Green et al., Reference Green, Sánchez, Amat, Figuerola, Hontoria, Ruiz and Hortas2005; Mura et al., Reference Mura, Kappas, Baxevanis, Moscatello, D'Amico, Lopez, Hontoria, Amat and Abatzopoulos2006), in Asia (China, Iran, Japan and India) (Mito & Uesugi, Reference Mito and Uesugi2004; Abatzopoulos et al., Reference Abatzopoulos, Agh, Van Stappen, Rouhani and Sorgeloos2006; Van Stappen et al., Reference Van Stappen, Yu, Wang, Hoffman, Cooreman, Bossier and Sorgeloos2007; Hajirostamloo & Pourrabbi, Reference Hajirostamloo and Pourrabbi2011; Vikas et al., Reference Vikas, Sajeshkumar, Thomas, Kajal and Vijayan2012), in Australia and New Zealand (Vanhaecke et al., Reference Vanhaecke, Tackaert, Sorgeloos, Sorgeloos, Bengston, Decleir and Jaspers1987; Ruebhart et al., Reference Ruebhart, Cock and Shaw2008) and in Africa (Morocco, Madagascar, Kenya, Tunisia) (Triantaphyllidis et al., Reference Triantaphyllidis, Abatzopoulos and Sorgeloos1998; Amat et al., Reference Amat, Hontoria, Ruiz, Green, Sánchez, Figuerola and Hortas2005; Kaiser et al., Reference Kaiser, Gordon and Paulet2006; Kappas et al., Reference Kappas, Baxevanis, Maniatsi and Abatzopoulos2009; Ben Naceur et al., Reference Ben Naceur, Ben Rejeb Jenhani and Romdhane2010). The spread and the establishment of A. franciscana populations worldwide are mainly attributed to anthropogenic introductions (i.e. intentional and non-intentional inoculations in saltworks, use in aquaculture as live feed or pet trade activities) and secondarily to passive dispersal of Artemia cysts by waterfowl and/or wind (Figuerola & Green, Reference Figuerola and Green2002; Van Stappen, Reference Van Stappen, Abatzopoulos, Beardmore, Clegg and Sorgeloos2002). During the last decade, a number of studies (e.g. Amat et al., Reference Amat, Hontoria, Ruiz, Green, Sánchez, Figuerola and Hortas2005; Mura et al., Reference Mura, Kappas, Baxevanis, Moscatello, D'Amico, Lopez, Hontoria, Amat and Abatzopoulos2006; Van Stappen et al., Reference Van Stappen, Yu, Wang, Hoffman, Cooreman, Bossier and Sorgeloos2007; Vikas et al., Reference Vikas, Sajeshkumar, Thomas, Kajal and Vijayan2012) have provided conclusive evidence for the capacity of A. franciscana to successfully invade biotopes that were previously occupied by autochthonous Artemia species. The collapse of biogeographical barriers that had kept biotas effectively isolated for millions of years has been dramatic since the Age of Exploration (early 15th Century to the middle of the 16th Century—Mooney & Cleland, Reference Mooney and Gleland2001). In fact, the effects of human-assisted invasions may reasonably be several orders of magnitude greater compared with those of prehistoric invasions (Ricciardi, Reference Ricciardi2007). This is particularly true for biotic interchanges of diapausing invertebrates to the point that such events may alter significantly the native distributions of taxa, at least in a regional scale. In this respect, Artemia constitutes an invaluable model organism for the study of biological invasions and their subsequent effects on the evolutionary trajectory of endemic species.
Studies on biodiversity and distribution of Artemia have led to the suggestion of several historical biogeographical scenarios (Baxevanis et al., Reference Baxevanis, Kappas and Abatzopoulos2006; Maniatsi et al., Reference Maniatsi, Baxevanis, Kappas, Deligiannidis, Triantafyllidis, Papakostas, Bougiouklis and Abatzopoulos2011). The key element for these efforts was the genetic analysis of a great number of Artemia populations with several molecular markers (i.e. 16S mtDNA RFLP analysis, AFLPs, COI and ITS sequencing and microsatellites) (Abatzopoulos et al., Reference Abatzopoulos, Beardmore, Clegg and Sorgeloos2002a and references therein; Bossier et al., Reference Bossier, Xiaomei, Catania, Dooms, Van Stappen, Naessens and Sorgeloos2004; Gajardo et al., Reference Gajardo, Crespo, Triantafyllidis, Tzika, Baxevanis, Kappas and Abatzopoulos2004; Baxevanis et al., Reference Baxevanis, Triantaphyllidis, Kappas, Triantafyllidis, Triantaphyllidis and Abatzopoulos2005, Reference Baxevanis, Kappas and Abatzopoulos2006; Kappas et al., Reference Kappas, Baxevanis, Maniatsi and Abatzopoulos2009; Maniatsi et al., Reference Maniatsi, Kappas, Baxevanis, Farmaki and Abatzopoulos2009a, Reference Maniatsi, Baxevanis and Abatzopoulosb, Reference Maniatsi, Baxevanis, Kappas, Deligiannidis, Triantafyllidis, Papakostas, Bougiouklis and Abatzopoulos2011; Muñoz et al., Reference Muñoz, Gómez, Green, Figuerola, Amat and Rico2010). Species delineation based on genetic data and measurement of genetic diversity is fundamental to assessing biodiversity. However, for several parts of the world there is still a paucity of this kind of data. For example, no genetic data are available for the species status of the numerous Artemia populations in Siberia (Mura & Nagorskaya, Reference Mura and Nagorskaya2005; Van Stappen et al., Reference Van Stappen, Litvinenko, Litvinenko, Boyko, Marden and Sorgeloos2009).
A similar pattern is observed in Africa, especially in its southern part. The most thorough review on Artemia distribution is provided by Kaiser et al. (Reference Kaiser, Gordon and Paulet2006) but it is mainly confined to the southern part of the African continent. Additionally, there are quite a few studies concerning exclusively or in part North African countries (e.g. Hontoria & Amat, Reference Hontoria and Amat1992; Baxevanis et al., Reference Baxevanis, El-Bermawi, Abatzopoulos and Sorgeloos2004; El-Bermawi et al., Reference El-Bermawi, Baxevanis, Abatzopoulos, Van Stappen and Sorgeloos2004; El-Magsodi et al., Reference El-Magsodi, El-Ghebli, Hamza, Van Stappen and Sorgeloss2005; Amarouayache et al., Reference Amarouayache, Derbal and Kara2009; El-Gamal, Reference El-Gamal2010; Ben Naceur et al., Reference Ben Naceur, Ben Rejeb Jenhani and Romdhane2012) while there is only one study focusing on two populations from southern Africa (Triantaphyllidis et al., Reference Triantaphyllidis, Abatzopoulos, Miasa and Sorgeloos1996). All studies referenced above provide information about demographic, reproductive, lifespan and hatching characteristics, survival, maturation and growth rates, morphometry and biometry, but only the study by El-Gamal (Reference El-Gamal2010) includes genetic data. South African sites are included only occasionally as part of broader research efforts (e.g. Baxevanis et al., Reference Baxevanis, Kappas and Abatzopoulos2006; Kappas et al., Reference Kappas, Baxevanis, Maniatsi and Abatzopoulos2009; Maniatsi et al., Reference Maniatsi, Baxevanis, Kappas, Deligiannidis, Triantafyllidis, Papakostas, Bougiouklis and Abatzopoulos2011).
From the above it is evident that the genetic identification of Artemia populations from South Africa using molecular techniques is necessary in order to fill in some of the gaps in our knowledge about the genetic make-up of Artemia in the African continent and to provide useful data for assessing potential biodiversity and phylogeographic patterns within the genus. Over the years 16S rRNA RFLP analysis has proved to be a reliable and cost-effective technique for the genetic screening of Artemia populations (Baxevanis & Abatzopoulos, Reference Baxevanis and Abatzopoulos2004; Gajardo et al., Reference Gajardo, Crespo, Triantafyllidis, Tzika, Baxevanis, Kappas and Abatzopoulos2004; Baxevanis et al., Reference Baxevanis, Triantaphyllidis, Kappas, Triantafyllidis, Triantaphyllidis and Abatzopoulos2005; Mura et al., Reference Mura, Baxevanis, Lopez, Hontoria, Kappas, Moscatello, Fancello, Amat and Abatzopoulos2005; Baxevanis et al., Reference Baxevanis, Kappas and Abatzopoulos2006; Mura et al., Reference Mura, Kappas, Baxevanis, Moscatello, D'Amico, Lopez, Hontoria, Amat and Abatzopoulos2006). As a result, the establishment of a large databank of 16S RFLP patterns from several Artemia populations has made genetic screening a relatively straightforward task. Thus, the present study provides novel molecular data regarding the species status of seven South African Artemia populations, their genetic structuring and phylogeographic pattern.
MATERIALS AND METHODS
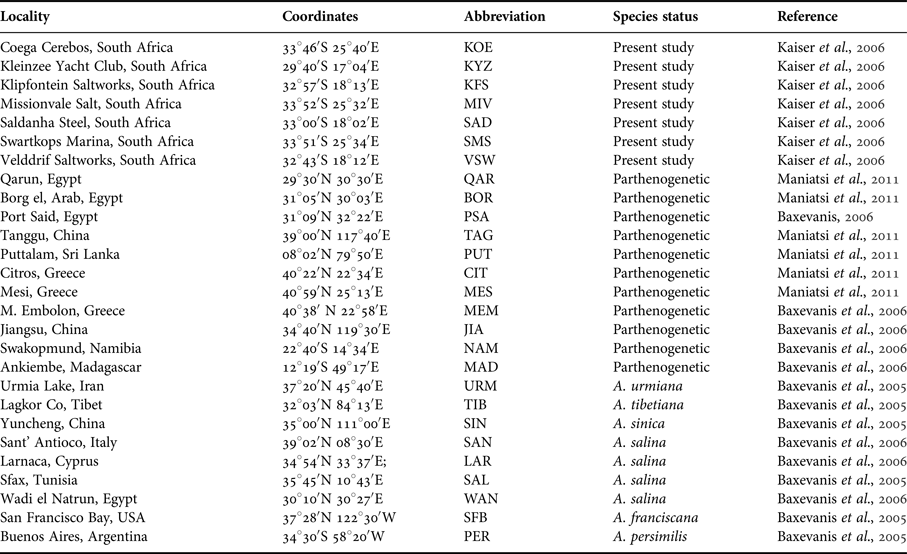
Details of the Artemia populations used in this study as well as their sites are given in Table 1. We compiled a dataset of 27 Artemia populations including seven populations from South Africa (for details, see Kaiser et al., Reference Kaiser, Gordon and Paulet2006) genetically analysed for the first time, six populations from North Africa, South Europe and South Asia that are well-characterized with other markers (see Maniatsi et al., Reference Maniatsi, Baxevanis, Kappas, Deligiannidis, Triantafyllidis, Papakostas, Bougiouklis and Abatzopoulos2011), and 14 reference populations for all bisexuals and parthenogens (previously analysed by Baxevanis et al. (Reference Baxevanis, Triantaphyllidis, Kappas, Triantafyllidis, Triantaphyllidis and Abatzopoulos2005) and Baxevanis (Reference Baxevanis2006)). DNA isolation and subsequent mtDNA RFLP analysis were performed only for the seven Artemia populations from South Africa, since RFLP data were available for the rest of the populations (Baxevanis et al., Reference Baxevanis, Triantaphyllidis, Kappas, Triantafyllidis, Triantaphyllidis and Abatzopoulos2005, Reference Baxevanis, Kappas and Abatzopoulos2006).
Table 1. List of Artemia populations used in this study.

MtDNA RFLP analysis
DNA was extracted from 403 encysted embryos (209 extractions were used finally, 29–30 cysts per population) following the protocol of Maniatsi et al. (Reference Maniatsi, Baxevanis, Kappas, Deligiannidis, Triantafyllidis, Papakostas, Bougiouklis and Abatzopoulos2011). Part of the 16S rRNA gene was amplified using the universal primers L2510 and H3080 (Palumbi, Reference Palumbi, Hillis, Moritz and Mable1996). Polymerase chain reactions (PCRs) were performed in a total volume of 75 μl containing 6 μl of DNA template, 20 mM Tris-HCl (pH 8.4), 50 mM KCl, 4 mM MgCl2, 0.15 mM of each dNTP, 45 pmoles of each primer and 4 U of Taq-DNA polymerase (Invitrogen, Carlsbad, California, USA). Amplifications were performed on a PTC-100® Peltier thermal cycler (MJ Research) with the following temperature profiles and conditions: initial denaturation at 95°C for 5 min, 33 cycles consisting of 94°C for 50 s, 50°C for 50 s, 72°C for 1 min and a final extension step at 72°C for 5 min. PCR products (4–7 μl) were digested with eight restriction endonucleases, separated electrophoretically in 1.5% agarose gels, stained with ethidium bromide, visualized and photographed under UV light. The following restriction enzymes were used: AluI, DdeI, DpnII, HaeIII, MspI, NotI, RsaI and Taq aI (New England BioLabs, Beverly, Massachusetts, USA). For molecular weight size standard a 100 bp ladder (New England BioLabs, Beverly, Massachusetts, USA) was used.
Data analysis
Single endonuclease restriction patterns were denoted by a specific letter. Thus, each individual was characterized by a multi-letter code describing its composite mtDNA genotype. The raw data were fragment profiles, but analysis was carried out based on site differences since these could be accounted for by the gain or loss of particular restriction sites (REs). For site inference, the published sequence of the complete Artemia franciscana mtDNA was used (GI: 5835051, Valverde et al., Reference Valverde, Batuecas, Moratilla, Marco and Garesse1994). Haplotype diversity values (h) within populations were computed using Arlequin 2.0 (Schneider et al., Reference Schneider, Roessli and Excoffier2000). The same software was also used to test for population differentiation in African populations based on haplotype frequencies (using 10,000 randomizations) and to evaluate the degree of population genetic structure (Fst) through analyses of molecular variance (Excoffier et al., Reference Excoffier, Smouse and Quattro1992). AMOVA was performed for African Artemia salina and African parthenogenetic populations, separately. Haplotype divergence values were computed using the statistical package REAP 4.0 (McElroy et al., Reference McElroy, Moran, Birmingham and Kornfield1991) and a UPGMA tree was drawn with the MEGA4 software (Tamura et al., Reference Tamura, Dudley, Nei and Kumar2007). A phylogenetic network was constructed with Network 4.6.0.0 (www.fluxus-engineering.com) using the median-joining (MJ) algorithm (Bandelt et al., Reference Bandelt, Forster and Röhl1999).
RESULTS
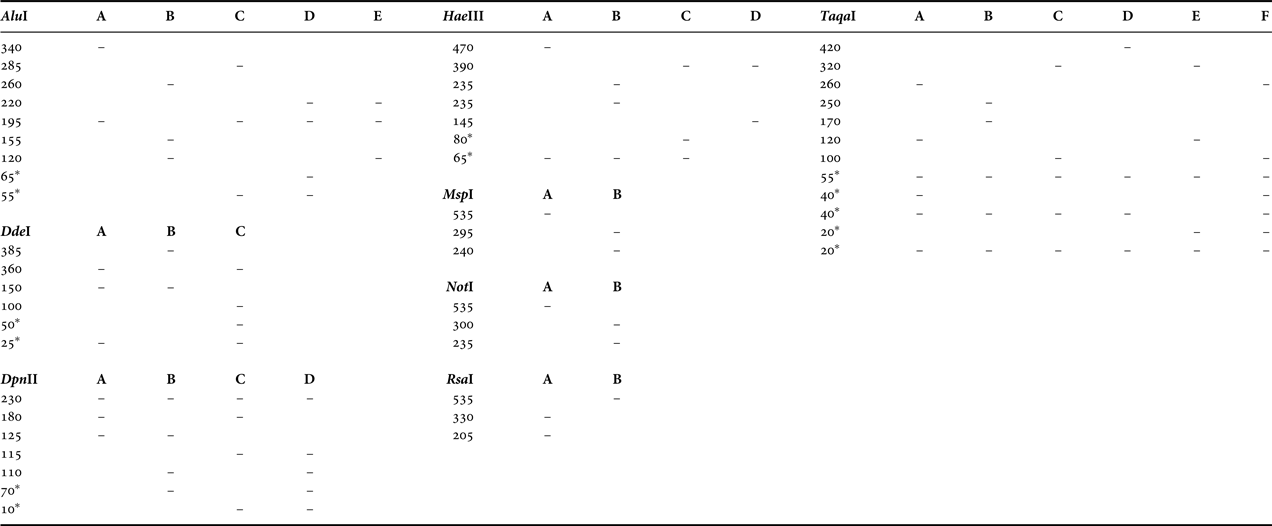
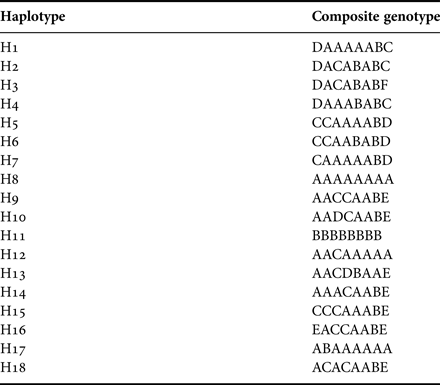
The size of the PCR-amplified mtDNA fragment was ~535 bp. Routine screening of all populations revealed a total of 25 cutting sites corresponding to 107 nucleotides. The fragment patterns generated by each enzyme are shown in Table 2. In total, 18 composite genotypes were identified and assigned to different haplotypes (Table 3). The maximum number of observed haplotypes within population samples was four (SMS population) (Table 4). Ten out of 18 haplotypes were private.
Table 2. Fragment size estimates (base pairs) of restriction patterns observed in the 16S rRNA region among the Artemia populations analysed.

*, these fragments could not be visualized because of their small size.
Table 3. Composite genotypes assigned to haplotypes. The enzymes used were in the following order: AluI, DdeI, DpnII, HaeIII, MspI, NotI, RsaI and Taq aI.

Table 4. Haplotype frequencies, sample size (N) for each population and mean haplotypic diversity (h) (standard error, SE) of the studied Artemia populations. For abbreviations and details, see Tables 1 and 3.
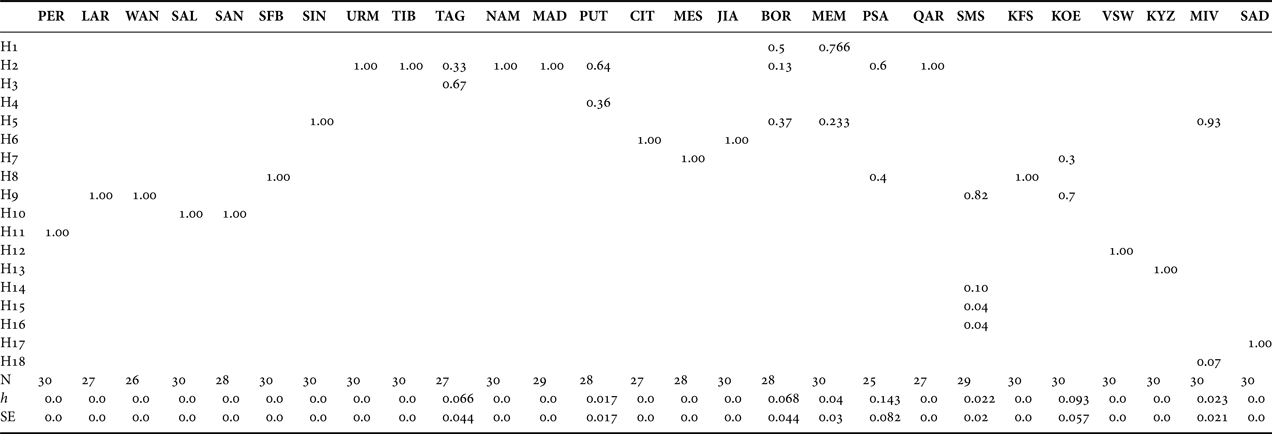
Haplotype frequencies across all populations together with mean haplotypic diversity estimates are given in Table 4. Only one haplotype was present in four out of seven South African Artemia populations (KFS, VSW, KYZ and SAD), while for the rest, haplotypic diversity ranged from 0.022 ±0.02 (SMS) to 0.093 ±0.57 (KOE). Seven out of 18 haplotypes identified in this study were recorded only in Artemia populations from South Africa (H12, H13, H14, H15, H16, H17 and H18). The SMS and KOE populations shared common haplotypes with LAR and WAN (A. salina), while KOE and MIV populations possessed haplotypes (H7 and H5, respectively) which appeared in the parthenogenetic populations. The most frequent haplotype and the one with the greatest geographical distribution was H2 (identified in nine out of 27 populations studied), while H17 was the rarest one, present in only two MIV individuals.
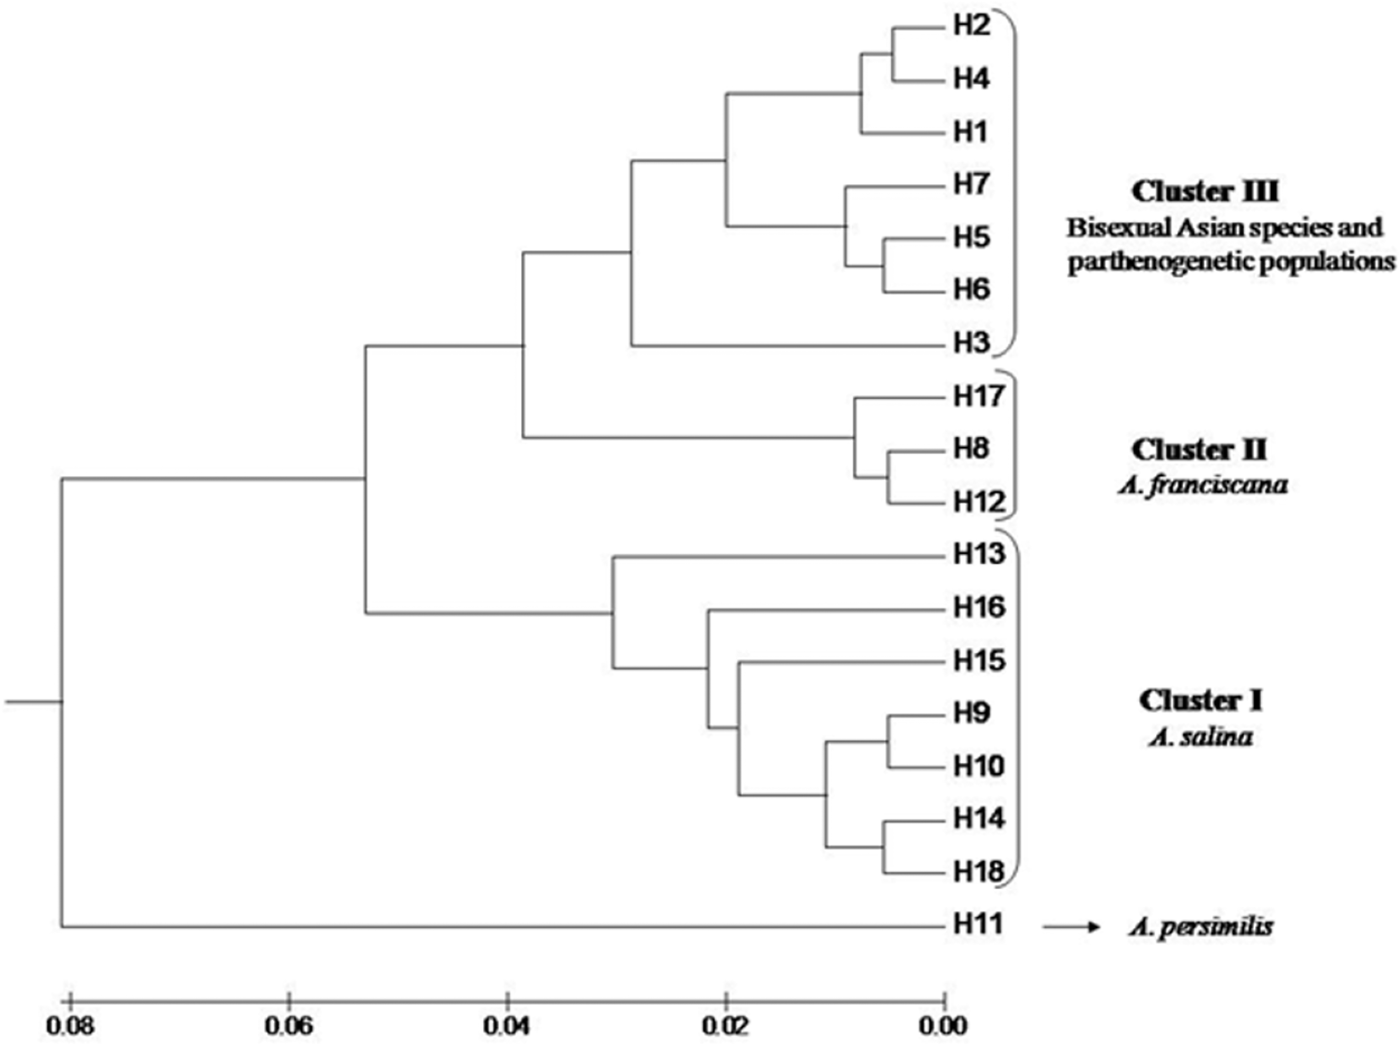
In order to visualize the relationships among haplotypes, a UPGMA dendrogram resulting from the distance matrix between haplotypes was computed (Figure 1). Three clusters were revealed, each one corresponding to the major phylogroups of Artemia: the first cluster contained haplotypes from Artemia salina, the second one included haplotypes identified in Artemia franciscana while the third cluster contained haplotypes present in parthenogenetic populations and Asian bisexuals (Artemia sinica, Artemia urmiana and Artemia tibetiana). Artemia persimilis haplotype (H11) was basal to the rest. According to the UPGMA dendrogram, the presence of A. franciscana, A. salina and parthenogenetic Artemia was verified. More specifically, SMS and KYZ populations contained haplotypes belonging to A. salina, while VSW, KFS and SAD individuals possessed haplotypes grouped with the one present in reference material of A. franciscana. Finally, MIV and KOE populations showed two components: one parthenogenetic (haplotypes H5 and H7) and one bisexual (A. salina). The most common haplotype (H2) was not present in South Africa.
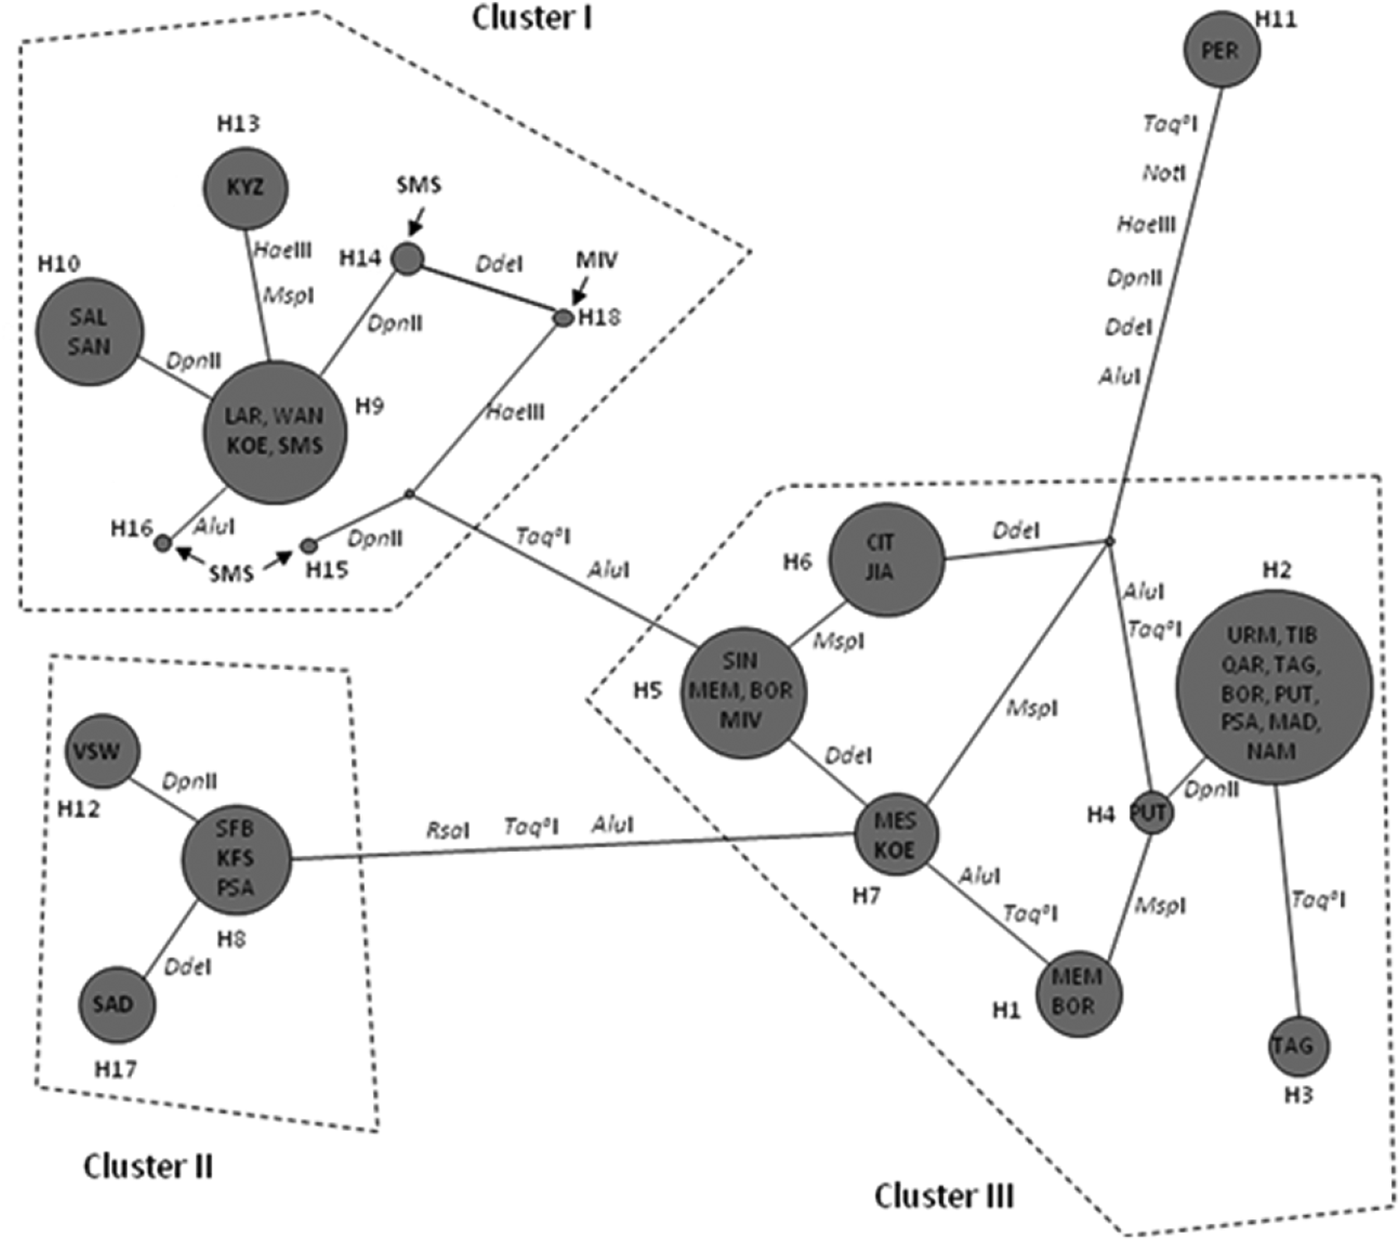
The MJ phylogenetic network (Figure 2) of haplotypes reflected the topology of the UPGMA tree. The first cluster (Cluster I) contained A. franciscana haplotypes, the second (Cluster II) comprised A. salina haplotypes while the third one consisted of Asian bisexual species and parthenogenetic populations (Cluster III). Artemia persimilis haplotype (H11) was placed as outgroup. The constructed network verified that three out of seven Artemia populations from South Africa belong to the invasive A. franciscana (i.e. KFS, VSW and SAD), two of them belong to A. salina (i.e. SMS and KYZ) while the last two (i.e. KOE and MIV) presented both parthenogenetic and bisexual (A. salina) components. Figure 2 shows the REs patterns that were responsible for the grouping. Artemia persimilis presented different patterns in seven out of eight REs while the three clusters differed mainly due to the patterns produced by Taq aI and AluI.
In order to determine whether the observed genetic diversity within A. salina was dictated by geographical separation, populations that possessed haplotypes belonging to A. salina were placed in two groups; the first group included populations from North Africa (i.e. SAL, SAN, LAR and WAN) and the second one comprised populations from South Africa (i.e. SMS, KOE, MIV and KYZ). It should be noted that for mixed populations (i.e. KOE and MIV), only the bisexual component was included in the analysis. According to the AMOVA results the FST value was 94.5%. However, 99.11% of the variation was attributed to differences among populations within groups, while the variance between groups was negligible. These results are indicative of a limited geographical subdivision in A. salina mtDNA (based on 16S RFLP analysis).
DISCUSSION
Updating Artemia biogeography is an arduous and continuous endeavour (the first organized research effort to compile a detailed list of Artemia sites throughout the world was in 1915 by Abonyi (see Van Stappen, Reference Van Stappen, Abatzopoulos, Beardmore, Clegg and Sorgeloos2002)). The current trend in Artemia biogeography is to provide as detailed information as possible, including data on genetic components, instead of a mere exposition of coordinates, local names and an indication regarding mode of reproduction (bisexual or parthenogenetic). In the present study, we have tried to resolve ambiguities regarding the species status of seven Artemia populations from South Africa by employing RFLP analysis and to identify possible biogeographical patterns that have shaped the distribution of Artemia in South Africa.
Ιnvertebrates are widely distributed in South Africa. Αccording to Hamer (Reference Hamer2010), there are ~60,000 invertebrate species in South Africa, 3000 of which are crustaceans (Griffiths, Reference Griffiths1999). However, very limited information exists on Artemia biogeography (e.g. Amat et al., Reference Amat, Barata and Hontoria1995; Kaiser et al., Reference Kaiser, Gordon and Paulet2006) in this region. Our results provide genetic evidence for the presence of two bisexual Artemia species, namely A. salina and A. franciscana, and a number of parthenogenetic strains in South Africa. According to the phylogenetic and network analyses, 11 haplotypes were detected; three of them were grouped with the reference A. franciscana material (namely H8, H12 and H17), six were grouped with A. salina (i.e. H9, H13, H14, H15, H16 and H18) and two haplotypes (i.e. H5 and H7) clustered with the group of bisexual Asian species and parthenogenetic strains. To our knowledge, this is the first confirmed report of A. franciscana in South Africa, although its presence has been implied by Kaiser et al. (Reference Kaiser, Gordon and Paulet2006). Based on a survey of 127 Artemia records in the African continent, it was estimated that from 41 populations with known reproductive mode about 12% could be hypothetically assigned to A. franciscana (Kaiser et al., Reference Kaiser, Gordon and Paulet2006). The authors also stressed the need for species verification using molecular techniques and the current work comes to fill this critical gap on Artemia biogeography.
One striking observation is the complete absence of the most common and widespread haplotype H2 (found in nine out of 27 populations) from South Africa. However, there are cases like the Egyptian sites BOR, PSA, QAR where H2 is present while it is absent from WAN (all these sites are in very close proximity, see Tables 1 and 4). Also, the neighbouring Chinese sites JIA and SIN are fixed for different haplotypes (H6 and H5, respectively). Therefore, signs of narrow endemicity as well as widespread occurrence of clones, as reported previously in Maniatsi et al. (Reference Maniatsi, Baxevanis, Kappas, Deligiannidis, Triantafyllidis, Papakostas, Bougiouklis and Abatzopoulos2011), are also appearing here. Given this pattern, the absence of H2 from South Africa could be the result of repeated bottlenecks in North African sites coupled with unfavourable conditions in South Africa which restrain its distribution.
The spatial and temporal presence of A. franciscana in South Africa coincides with the significant growth of aquaculture activities in the region from the beginning of the 21st century (http://www.fao.org/fishery/countrysector/FI-CP_ZA/3/en; accessed 30 January 2014). It should be noticed that A. franciscana has been recorded in other African countries, such as Kenya (Kaiser et al., Reference Kaiser, Gordon and Paulet2006), Madagascar (Triantaphyllidis et al., Reference Triantaphyllidis, Abatzopoulos and Sorgeloos1998) and Tunisia (Ben Naceur et al., Reference Ben Naceur, Ben Rejeb Jenhani and Romdhane2010). The current findings expand the A. franciscana distribution to the southern part of the African continent.
Of particular interest is the Artemia population from Velddrif Saltworks (VSW); this population had been previously identified as A. salina (Amat et al., Reference Amat, Barata and Hontoria1995). The results of the present study indicate that since then, the native A. salina population has been replaced by the invasive A. franciscana. Similar cases have been recorded in numerous localities, mainly in the western Mediterranean, providing evidence for the great capacity for expansion of A. franciscana (Amat et al., Reference Amat, Hontoria, Ruiz, Green, Sánchez, Figuerola and Hortas2005; Mura et al., Reference Mura, Özkütük, Aygen and Cottarelli2011). Moreover, laboratory experiments have shown that A. franciscana is able to outcompete A. salina and parthenogenetic strains within two or three generations (Abatzopoulos et al., Reference Abatzopoulos, Beardmore, Clegg and Sorgeloos2002a). However, there are documented cases of habitats where populations of A. franciscana and parthenogens co-exist. For example, Mura et al. (Reference Mura, Kappas, Baxevanis, Moscatello, D'Amico, Lopez, Hontoria, Amat and Abatzopoulos2006), based on a multidisciplinary analysis, revealed the presence of A. franciscana among native parthenogens in Margherita di Savoia (Italy) while Amat et al. (Reference Amat, Hontoria, Ruiz, Green, Sánchez, Figuerola and Hortas2005) recorded their co-existence in Mar Chica (Morocco) and Aigues Mortes (France). In South Africa we found no populations harbouring both A. franciscana and parthenogenetic haplotypes. This fact in conjunction with the reported cases above probably indicates that although A. franciscana is an advantaged invader, the particular outcome in each case may be quite specific and dependent on certain conditions.
In contrast, co-existence of A. salina and parthenogenetic strains has been documented in two of the examined populations (KOE and MIV, see Figure 1). This observation reinforces the idea that parthenogenetic strains may share a habitat with bisexual species (apart from A. franciscana). For example, there are confirmed cases of co-existence of parthenogens with A. salina in Spain and in Italy (Amat et al., Reference Amat, Barata and Hontoria1995, Reference Amat, Hontoria, Ruiz, Green, Sánchez, Figuerola and Hortas2005), with Artemia sinica in North and Central China (Van Stappen, Reference Van Stappen, Abatzopoulos, Beardmore, Clegg and Sorgeloos2002), and with Artemia urmiana in Iran (Abatzopoulos et al., Reference Abatzopoulos, Agh, Van Stappen, Rouhani and Sorgeloos2006) and Crimea (Abatzopoulos et al., Reference Abatzopoulos, Amat, Baxevanis, Belmonte, Hontoria, Maniatsi, Moscatello, Mura and Shadrin2009; Shadrin & Anufrijeva, Reference Shadrin and Anufriieva2012).
The finding that co-occurrence and replacement have affected the biogeography of Artemia in South Africa provides the tools to better understand the expansion of a non-indigenous species, such as A. franciscana. Given the frequency of A. franciscana introductions throughout the world, relevant field data should provide valuable comparisons on the competitive potential of A. franciscana with different relatives (i.e. A. salina, parthenogens). For example, it would be of interest to determine whether bisexual competitors suffer more severely compared with cases where one competitor is asexual. In general, the full spatial and temporal range of the events linked to invasion is not well defined, since only a fraction of sites have been investigated during a few restricted time intervals (Gertzen & Leung, Reference Gertzen and Leung2011). To aggravate the problem, current rates of migration and dispersal of organisms are significantly higher compared with historical fluctuations in biota (Mooney & Cleland, Reference Mooney and Gleland2001), thus opening the scene for novel species interactions. Τhe monitoring of Artemia populations (especially in Africa) should be continuous and as extensive as possible in order to assess the rate of change in their composition. In general, this is a specially pressing issue in biodiversity studies, as several populations may go extinct even before they have been surveyed. The rate of change of saline biotopes is particularly rapid due both to the effects of desertification and human activities. A typical example is the wide-scale biodiversity loss that has taken place in the Aral Sea Basin within a very short period of time (Micklin, Reference Micklin2007).
Phylogenetic and network analyses showed that seven out of the 18 haplotypes found were present solely in the South African populations (i.e. H12–H18). The A. salina haplotypes from South Africa exhibit distinct phylogenetic histories when compared to those originating from the eastern and/or western Mediterranean (although they clustered together within the A. salina group). Furthermore, the AMOVA results showed that most of the genetic variation is distributed over a regional scale (among A. salina populations), while the genetic variation between the two geographical groups (A. salina populations originated from North and South Africa) is negligible. The existence of unique (but low in frequency) haplotypes in A. salina populations from South Africa (see Table 4) and the absence of genetic structure between A. salina from North and South Africa (AMOVA results) indicated that local adaptation mechanisms and a constant gene flow between South and North African populations have shaped the genetic structure of A. salina in South Africa. A possible mechanism for the homogenization of geographically distinct gene pools is through passive dispersal of Artemia cysts by wind and/or migratory waterfowl (Green & Figuerola, Reference Green and Figuerola2005; Vanschoenwinkel et al., Reference Vanschoenwinkel, Gielen, Seaman and Brendonck2008a, Reference Vanschoenwinkel, Gielen, Vandewaerde, Seaman and Brendonckb). Artemia cysts may ‘travel’ for more than 1000 km in the digestive tract of water birds (Green & Figuerola, Reference Green and Figuerola2005). Furthermore, two of the major shorebird migratory flyways (East Atlantic and West Asia/West Africa flyways) overlap in the southern Africa region (Hickman et al., Reference Hickman, Roberts and Larson2001); the first one covers the western Mediterranean Basin and the western African coasts while the second crosses areas of western Asia, eastern Mediterranean and eastern African coasts.
The vast majority of cysts used in aquaculture industry originate from a limited number of sources (Dhont & Sorgeloos, Reference Dhont, Sorgeloos, Abatzopoulos, Beardmore, Clegg and Sorgeloos2002). On this basis, A. franciscana haplotypes from different parts of the ‘Old World’ are expected to show complete identity or minimum site changes compared with those of the same species from the USA. However, that was not the case with the A. franciscana haplotypes recorded in South Africa. Moreover, two different haplotypes were identified in South African A. franciscana (Figures 1 and 2). The existence of distinct haplotypes implies either that the invasion happened well in the past or the existence of a relic A. franciscana population. Fast genetic and reproductive differentiation of A. franciscana in a new environment has been previously documented (Kappas et al., Reference Kappas, Abatzopoulos, Van Hoa, Sorgeloos and Beardmore2004; Mura et al., Reference Mura, Kappas, Baxevanis, Moscatello, D'Amico, Lopez, Hontoria, Amat and Abatzopoulos2006). In particular, evidence for significant differentiation of inoculated A. franciscana (San Francisco Bay stock) was apparent as early as within a year after inoculation in Vietnamese saltworks (Kappas et al., Reference Kappas, Abatzopoulos, Van Hoa, Sorgeloos and Beardmore2004). Therefore, a probable scenario for explaining the presence of distinct haplotypes within South African A. franciscana populations is the rapid adaptation and establishment of new populations following the release (accidental or not) of USA cysts. This possibility is reinforced by the presence of both native (SFB) and distinct A. franciscana haplotypes in South Africa, yet its downside concerns the complete absence of published records or even anecdotal reports on A. franciscana inoculations in this region. The other possibility, of a relic A. franciscana lineage, can be safely excluded on the basis of low divergence of the distinct A. franciscana haplotypes (H12 and H17).
The genetic results of the current study provide firm evidence for the existence of a bisexual (A. franciscana and A. salina) and a parthenogenetic component in South African Artemia populations. Comparisons with other published data reveal that populations of the invasive species A. franciscana have been established in South Africa, while the previous occurrence of A. salina has been substantially restricted. Parthenogenetic Artemia strains seem to impede the capacity of A. franciscana to replace native populations, as documented in other cases (Pinto et al., Reference Pinto, Bio, Hontoria, Almeida and Vieira2013). The combination of invasion, co-occurrence and replacement appears to have shaped the Artemia distribution in South Africa. The monitoring of the South African Artemia populations using molecular markers (as well as other Artemia populations from the African continent) is strongly recommended in order to gain a better understanding of the biogeography of the genus both from an ecological and a historical perspective.
FINANCIAL SUPPORT
This research was partly supported by European Union project ICA4-CT-2001-10020 (INCO) on Artemia biodiversity.


