


Introduction
Xanthoria parietina (L.) Th. Fr. is a widespread and abundant foliose lichen that can be collected in many locations. It is easily dissected cleanly from the bark or rock substratum on which it grows, attains a relatively large thallus size and remains visible when stored for long periods in a standard laboratory deep freezer (Honegger Reference Honegger2003). These desirable characteristics have meant that it has been used in many studies and, as a result, there are relatively good data on many aspects of its growth, physiology and biology. In addition, X. parietina is one of the few lichen-forming fungi for which a complete genome sequence is available (http://genome.jgi.doe.gov/Xanpa2/Xanpa2.download.html).
The algal photobionts in Xanthoria parietina are Trebouxia spp. contained within a heteromorphic thallus. This genus is amongst the most commonly lichenized and indeed is predominantly seen in that context rather than as free-living algae. Several studies have explored the taxonomy of this photobiont genus and an initial classification based on chloroplast morphology, particularly of the pyrenoid, has been developed (Ettl & Gärtner Reference Ettl and Gärtner1984). Later studies based on analysis of DNA ITS sequences have refined their taxonomy (Muggia et al. Reference Muggia, Grube and Tretiach2008) and have enabled identification of the photobiont to species level in several lichens. Xanthoria parietina is one such example in which Trebouxia arboricola Puymaly has been reported to be the most common photobiont (Nyati et al. Reference Nyati, Werth and Honegger2013).
There has been much research undertaken on Trebouxia photobionts including morphological, genetic and physiological studies (Casano et al. Reference Casano, Del Campo, Garcia-Breijo, Reig-Arminana, Gasulla, Del Hoyo, Guera and Barreno2011). Such studies have largely used cultured algae although some have been based on freshly isolated material. This is relevant because the morphology of chloroplasts, and potentially other cytoplasmic organelles, changes significantly during culturing (Friedel & Budel, Reference Friedel and Budel2008). Physiological studies have focused mainly on lichen responses to extreme environmental conditions including those of space (De la Torre et al. Reference De la Torre, Sancho, Horneck, Ríos, Wierzchos, Olsson-Francis, Cockell, Rettberg, Berger and De Vera2010) but especially to desiccation (Gasulla et al. Reference Gasulla, De Nova, Esteban-Carrasco, Zapata, Barreno and Guera2009) where photobiont responses to reactive oxygen species are important (Kranner et al. Reference Kranner, Beckett, Hochman and Nash2008). The chloroplast and associated photosynthetic mechanisms have been a notable focus of research in lichens (Nash Reference Nash2008). Despite the wealth of morphological and experimental data, there has been a dearth of studies examining the chondriome within lichens generally and the photobiont specifically. Indeed, most morphological studies do not even mention the chondriome but instead focus on features of the chloroplast, particularly the pyrenoid (e.g. Ascaso et al. 1985).
This lack of research on mitochondrial morphology and function is surprising because these organelles are central to cellular function in all eukaryotes including photobionts. In addition to a central role in respiration, mitochondria have roles in responses to cell stress and calcium signalling, and they interact with the chloroplast to optimize photosynthesis. Furthermore, it seems plausible that modulation of mitochondrial function might be important in several aspects of lichenization such as photobiont control by the fungal partner and energy transfer between them. It is unknown how mitochondrial morphology varies between photobionts from different lichens and this might be important for taxonomic studies. It is also unknown how the lichenized state affects the chondriome compared to free or cultured algae.
There are no data on how the chondriome in photobionts responds to the cell cycle, the extent to which mitochondrial replication is controlled by the cell cycle of the photobiont, or has a separate cycle within the organism as is the case in Chlamydomonas sp. (Brickley Reference Brickley2012). Furthermore, it is not known how the process of lichenization changes, and exerts control over, the process of replication in the photobiont chondriome. Addressing such questions could contribute to an understanding of the lichenized state and its energy balance.
There are several possible reasons for the scarcity of information in this area. Aside from an understandable focus on the chloroplast and photosynthesis within photobionts (Green et al., Reference Green, Nash and Lange2008 and references therein), a reliable method for imaging the chondriome in these organisms has not been described and this has hampered morphological research. The few studies that have mentioned mitochondria in lichen algae have been based on electron microscopy (EM) data. In a review of EM data, Jacobs & Ahmadijan (Reference Jacobs and Ahmadjian1969) highlight technical limitations with specimen fixation and subsequent imaging that resulted in artefacts and poor resolution in the resultant images thus limiting the value of the interpretations reported. All the published research to date has shortcomings regarding the chondriome. First, research has not focused on the chondriome and thus chondriome morphology is only summarily reported. Second, the data are based on 2D EM images or on small numbers of EM serial sections. The former images do not provide any real idea of the 3D structure of the chondriome while the latter studies report only a small data set that does not allow statistical analysis. There has been little research into photobiont ultrastructure since these initial studies and none that describes the chondriome in detail, although several studies utilized EM ultrastructural data to examine specific questions, such as the changes during desiccation (Ascaso et al. Reference Ascaso, Brown and Rapsch1985). 3D live cell imaging has been used recently to examine changes in Asterochloris chloroplast structure (Škaloud & Peksa Reference Škaloud and Peksa2008).
Both fluorescence and confocal microscopy rely upon fluorophores that can be used to preferentially stain specific organelles in the target species and which can be excited by the available light systems at sufficiently low power so as not to destroy the specimen over the time-course of imaging. A wide range of such fluorophores is now available although their utility with plant, and particularly algal, tissue is variable (Fricker Reference Fricker2001). Live cell imaging of the chondriome requires a biocompatible mitochondrial-specific dye and several potential dyes have been reported. The carbylamine dye DIOC7, has been used to stain plant mitochondria (Liu et al. Reference Liu, Bushnell and Brambl1987) and 2-(4-(dimethylamino)styryl)-1-methylpyridinium iodide (DASPMI) has been reported to stain Chlamydomonas rheinhardtii mitochondria (Ehara et al. Reference Ehara, Tesuaki and Eiji1995). This latter dye was also used to label mitochondria in the alga Mougeotia sp. which allowed tracking of mitochondrial movement over time courses of several hours (Brickley et al. Reference Brickley, Weise, Hawes and Cobb2010). Rhodamine 123 (R123) has been reported to have good labelling ability in both animal and plant cells (Vannini et al. Reference Vannini, Pancaldi, Poli and Easulo1988). The commercially available MitoTracker range of dyes (Thermo-Fisher, UK) consists of several variants of an original red fluorescent dye (Poot et al. Reference Poot, Zhang and Kramer1996), including both an orange dye (MTO) and a green dye (Mitotracker). These are lipophilic cationic dyes which contain a mildly thiol-reactive chloromethyl moiety resulting in them being fixable, this allows live cell labelling of mitochondria that persists after killing and fixation with aldehyde-based fixatives. Fixation not only allows long-term preservation of material from morphological studies but also allows the use of this stain with immunofluorescent labelling methods that require fixed material. MitoTracker dyes have been successfully used to label mitochondria in plant cells, such as BY2 protoplasts (Chung et al. Reference Chung, Kim, Park, Nahm and Kim2009). There are no reports of the successful use of these dyes in algae.
It has previously been reported that success in using these various dyes in animal or plant cells does not necessarily translate to algal cells (Brickley Reference Brickley2012) and no reports exist of them being used to study algal photobionts. This paper addresses this lack by developing and optimizing a reliable and simple protocol for imaging the chondriome in live Trebouxia spp. The protocol is suitable for both 2D and 3D imaging using optical sectioning. The project was undertaken in two phases: in the first phase several candidate mitochondrial dyes were assessed for their ability to label mitochondria in Trebouxia and in the second the most promising dye was optimized. Finally, the optimal staining protocol was qualitatively assessed for both 2D and 3D imaging of the chondriome.
Materials and Methods
Lichen collection and storage
Xanthoria parietina was collected from trees forming a long hedgerow adjacent to a little-used rural lane at a site in Dorset, UK. The lichens were consistently harvested in the early evening, dissected off their bark substratum and stored at room temperature for 24 h to allow them to become air dried before being stored in a freezer at −20°C. This storage technique has been shown to maintain both the vitality and physiology of the lichens for several years (Honegger Reference Honegger2003). Harvested material was used within three months of storage.
Preparation of photobiont suspension
A small quantity of lichen was removed from storage and allowed to equilibrate to room temperature. It was then rehydrated by spraying with distilled water and placed in a controlled plant growth cabinet within a vented petri dish under moderate illumination at 19 °C for 1 h. This was undertaken to allow the lichen to resume normal physiological function. Trebouxia cells were then liberated from the lichen thallus using the following procedure. 20–25 mg of the lichen was placed in a hand tissue grinder and 500 μl of sterile photobiont isolation buffer (PIB: 0·3 M sorbitol in 50 mM HEPES, pH=7·0) was added. The mixture was ground in 15s bursts for 4 cycles to fully disrupt the lichen. Pilot studies revealed this released the majority of the photobiont cells but did not lyse them. The resulting mixture was centrifuged at 1000 g for 30 s, the supernatant removed and the cells re-suspended in 1 ml of PIB. This process was repeated twice to wash the released cells and remove chemical contaminants. The resultant pellet, which contained the photobionts together with fragments of the mycobiont, was re-suspended in 300 μl of PIB. It was not necessary to isolate the photobionts from mycobiont fragments; early tests showed that it was possible to both label and image the photobiont cells in the presence of mycobiont fragments. This process yielded sufficient photobiont suspension to undertake three labelling procedures and was repeated as often as needed in both phases of the project. In all experimental runs, freshly prepared photobiont suspensions were used within 1 h of preparation.
Assessment of dyes and optimization
Six potential mitochondrial-specific stains were tested for their ability to label mitochondria in live Trebouxia cells, details of which and the concentrations used are given in Table 1. The dye concentrations selected were those shown to have the greatest utility in the papers cited in the Introduction, except JC-1 where the highest recommended concentration by the manufacturer was used. Stock solutions of the stains were prepared with distilled water to give a final stock molarity such that adding 10 μl of the stock to 90 μl of algal suspension yielded the desired stain concentration. In each case the final stock also contained 1% DMSO by volume because invariably these dyes require suspending in DMSO to produce an initial concentrated stock before dilution to a working stock. Previous work (Brickley et al. Reference Brickley, Cobb and Lawrie2012) has demonstrated that DMSO at this concentration has no discernible effect on algal cells. Following preparation and vortexing, each preparation was incubated at room temperature for 30 min under ambient lighting. The cells were then washed twice by centrifugation and pellet re-suspension in PIB, and finally re-suspension in 40 μl of PIB for imaging.
Table 1 Candidate mitochondrial dyes tested in this study together with shortened version of dye name, full chemical name, concentration used in the initial phase of the study and excitation / emission settings

* Indicates registered compounds where the dye chemical formula is not published and therefore the supplier is listed in methods.
** DASPMI has a very wide stokes shift which shows variability dependent on the cellular environment, hence the wideband emission filter.
*** JC-1 has 2 emission peaks, the one selected is the prevalent one when the dye is concentrated in mitochondria.
6.5 μl of the re-suspended cells was placed on a microscope slide and a coverslip was fixed and sealed with VALAP (Fricker Reference Fricker2001), which stabilized the preparation. The slide was imaged using an Olympus FV300 confocal microscope using excitation and emission values appropriate for the stain being used (Table 1). In phase one of the study, a single image was taken for each cell at the z position which gave a maximum mitochondrial channel signal. This was usually the vertical centre of the cell. The laser intensity was kept constant between imaging runs but the channel gain was altered to give the best obtainable non-saturated mitochondrial signal. The black level setting was maintained at zero to allow meaningful comparisons of background noise between dyes. Thirty cells were imaged for each dye, a replication for which statistical power calculations indicated was a valid sample. Each image was analyzed using FIJI image analysis software (Schindelin et al. Reference Schindelin, Arganda-Carreras, Frise, Kaynig, Longair, Pietzsch, Preibisch, Rueden, Saalfeld and Schmid2012) to yield the average mitochondrial and cellular background intensities. The mitochondrial signal was separated from the cell background using a binary threshold based on intensity using a calculated half width at half maximum (HWHM) method. Several mitochondria were identified on the image and the intensity profile of the transect through these was made using the line profile function of FIJI. A Gaussian curve was fitted to this (using the software’s fit function) and this was used to calculate the intensity level at the half width of the Gaussian curve from the maximum. This value represents the best delineation of signal from background in a wide variety of settings and produced visually accurate thresholding of the mitochondria from the background. The calculated intensity value was used to threshold the image to isolate the mitochondria and the mean intensity of the selected areas was then calculated. An area of adjacent cytoplasm was selected manually and the mean intensity of this was measured. The resultant data were used to calculate the signal to noise ratio for the mitochondrial signal in one cell. This was repeated for all cells and summary statistics were then calculated for the entire dataset for one stain. In the worst performing dyes, the mitochondrial signal was absent and the SNR (signal-to-noise ratio) of these could thus not be calculated and was reported as 1 (i.e. no difference in the mitochondrial signal and the background). The usefulness of the stains which showed mitochondrial labelling were compared with pairwise ANOVA analyses.
Based on the results of this initial work, MTO was selected as the most promising stain and in the second phase of the project this was subjected to an optimization process to yield a final labelling protocol. Final stain concentrations of 100 nM, 500 nM, 1 μM and 2 μM MTO were used for the staining procedure. Each of these concentrations was prepared and imaged as above. These data were analyzed in a similar way to the data in the first phase to yield optimal staining parameters.
The value of the optimal stain protocol for 2D widefield, 2D confocal imaging and for 3D volume reconstruction following confocal optical sectioning were qualitatively assessed. A 2D widefield fluorescence image was produced using a ×100 oil immersion objective (NA=1·3) with the settings of the microscope adjusted to maximize SNR, and a 2D confocal image was produced in a similar manner. Finally, a 3D z stack was produced with a ×60 (NA=1·2) water immersion objective on the confocal microscope using a 200 nm z step size. These data were also deconvolved using an empirically obtained point spread function (PSF). The possibility of each of these datasets to be thresholded to isolate the mitochondrial signal and the shape of the intensity curve across a mitochondrial transect was determined, this latter measure giving a qualitative indication of the mitochondrial image quality.
Results
The relatively simple photobiont extraction method used here yielded photobiont cells that showed normal architecture in both light and confocal imaging although substantial mycobiont and other extraneous material remained in the suspension. The photobionts, however, maintained vitality for several hours and the presence of the unwanted material did not prevent labelling or imaging.
Six candidate dyes were assessed during phase 1. Figures 1A & B show photomicrographs taken from the mitochondrial channel of a typically labelled cell for each candidate dye while Fig. 2A reports the mean and standard deviation of the SNR values for each candidate. Two dyes (DASPMI and MTG) failed to label the mitochondria at all, consequently the SNR is reported as 1, indicating no difference between background and mitochondrial signal. R123 had an unusual labelling pattern in that most cells showed no mitochondrial labelling while a faint signal could be seen in the cell exterior but in c. 5% of cells very strong mitochondrial labelling was seen (Fig. 3). Three dyes (DIOC7, JC-1 and MTO) consistently labelled photobiont mitochondria. MTO labelling had a significantly higher SNR than both DIOC7 (t-test=8·79; P<0·0001) and JC-1 (t-test=8·55; P<0·0001) and thus was the best candidate dye (Fig. 2A). MTO not only gave the best differentiation between the mean mitochondrial signal and the background but the labelling within the mitochondria was also less noisy (Fig. 1). This is important because it makes the signal more useful for morphological studies which require intensity segmentation.
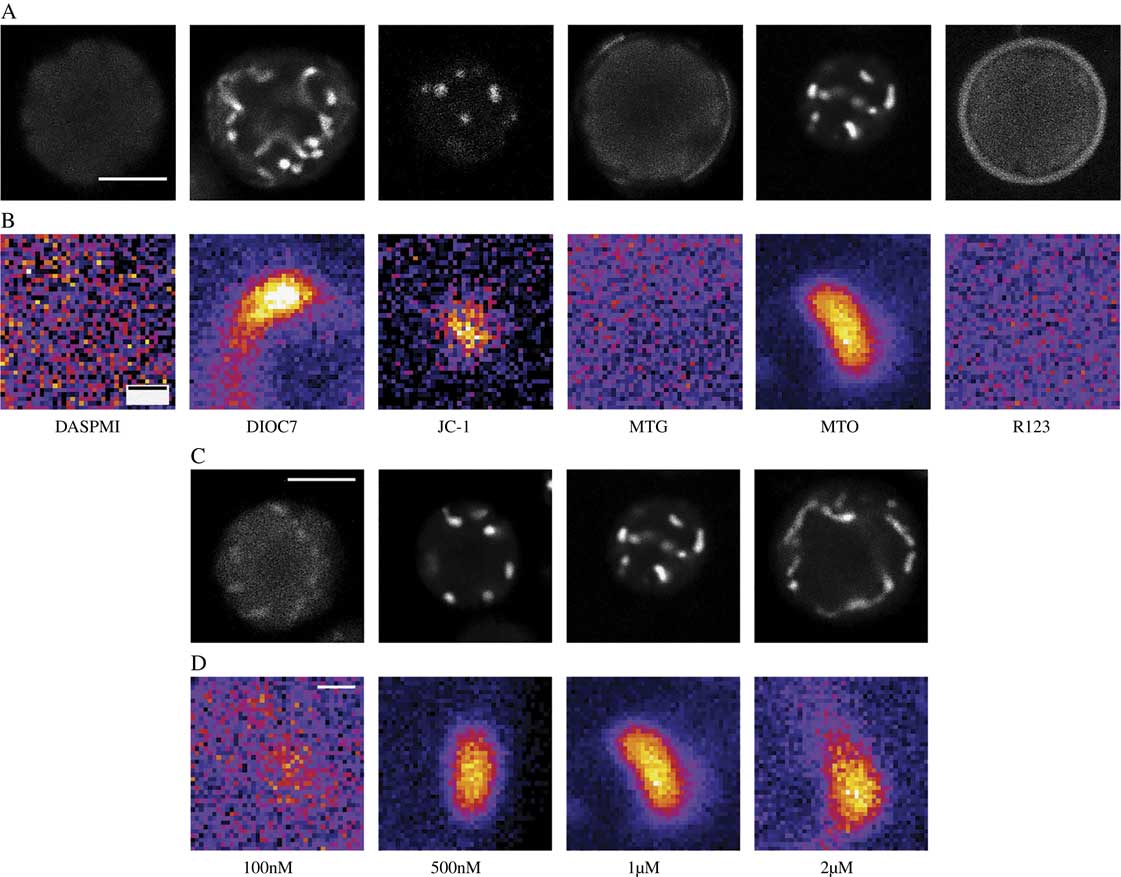
Fig. 1 Single Trebouxia cells imaged by confocal microscopy. A & C, whole cell fluorescent images from mitochondrial dye channel; B & D, magnified views of single mitochondria. A & B, using six candidate mitochondrial dyes. MTO, DIOC7 and JC-1 label mitochondria but the MTO mitochondrial signal is less noisy than other dyes while MTG, DASPMI and R123 do not label mitochondria. C & D, using different concentrations of MTO. 500 nM, 1 μM and 2 μM MTO concentrations all label mitochondria adequately but the 1 μM MTO mitochondrial signal has optimal SNR (mean SNR=16·24). Refer to Table 1 for imaging parameters and full name of dyes. In B & D consistent imaging parameters were used for each image allowing intensity values between images to be compared. Image intensity values were colour coded using the FIJI ‘FIRE’ look up table which translates the black – white scale to a linear 6 bin colour coded scale (black-blue-purple-red-yellow-white) where black represents minimum intensity and white maximum intensity. These coded images highlight the differences between dark and light areas and facilitate visual detection of the amount of noise in an image. Scales: A & C=5 μm; B & D=500 nm.
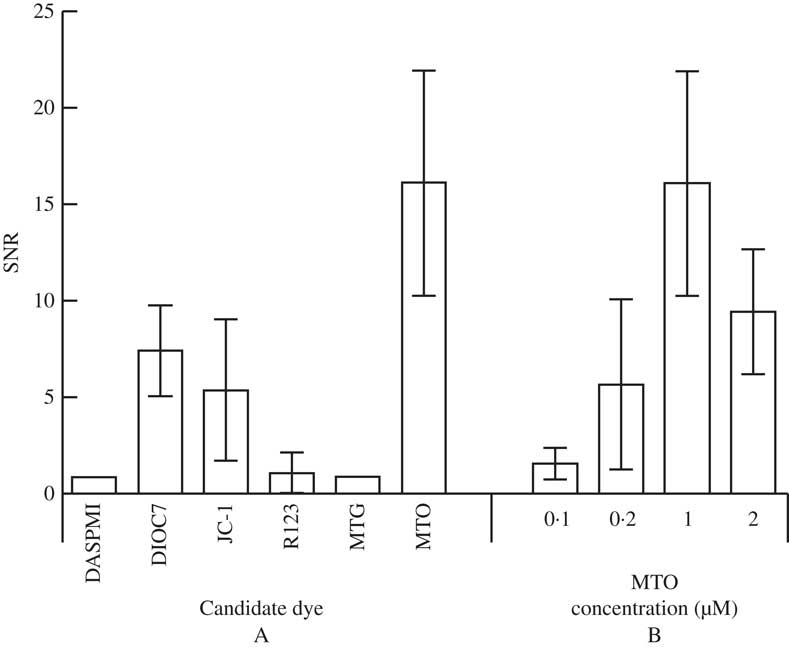
Fig. 2 Signal to noise ratios (SNR) of the mitochondrial signal compared to cellular background for Trebouxia cells. A, values for cells labelled with six candidate mitochondrial dyes; B, values for cells labelled with four concentrations of the optimal dye (MTO). Plotted values are means±1SD.
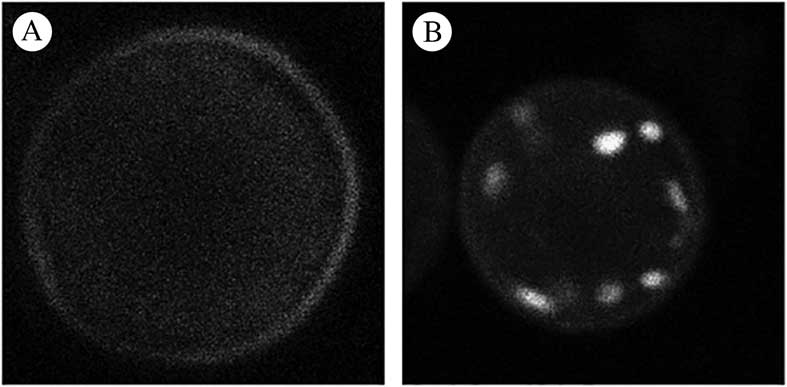
Fig. 3 Whole cell fluorescent images of Trebouxia cells labelled with R123 dye using the mitochondrial dye channel. A, pattern of labelling seen in the majority of cells imaged with no mitochondrial labelling and a faint background signal adjacent to the cell periphery; B, pattern of labelling seen occasionally demonstrating good mitochondrial labelling (2 out of 30 of those cells imaged at random in the study).
In the second phase of the study overall optimal labelling was shown to occur using 1 μM MTO (Figs 1 C & D and 2B). This concentration was significantly more effective than either 100 nM (t=13·59, P<0·0001), 500 nM (t=7·8578, P<0·0001) and 2 μM (t=5·493, P<0·0001) assessed using unpaired t-tests. These data were consistent with the subjective finding that 1 μM labelled samples were easier to image, giving a signal that was less dependent on the exact microscope settings. The 2 μM MTO-labelled samples demonstrated good mitochondrial labelling but the background fluorescence was higher, presumably due to diffuse labelling of cytoplasmic structures which resulted in a lower overall SNR.
The usefulness of the optimal dye system (1 μM MTO) for widefield 2D imaging is evident in Figs. 4 A–D; the mitochondrial image is shown together with an image of the chloroplast (imaged using chlorophyll autofluorescence) and a bright field image. Figures 4 E–H show a confocal image of a 1 μM MTO-labelled cell imaged near the upper border of the cell, where mitochondria were lying horizontally in the xy plane, together with an intensity plot of a transect of a single mitochondrion, the FWHM (full width at half maximum) value of this and the resultant threshold image. The FWHM thresholding separated the mitochondrial signal from the adjacent background accurately and this would enable quantitative measurement and analysis.
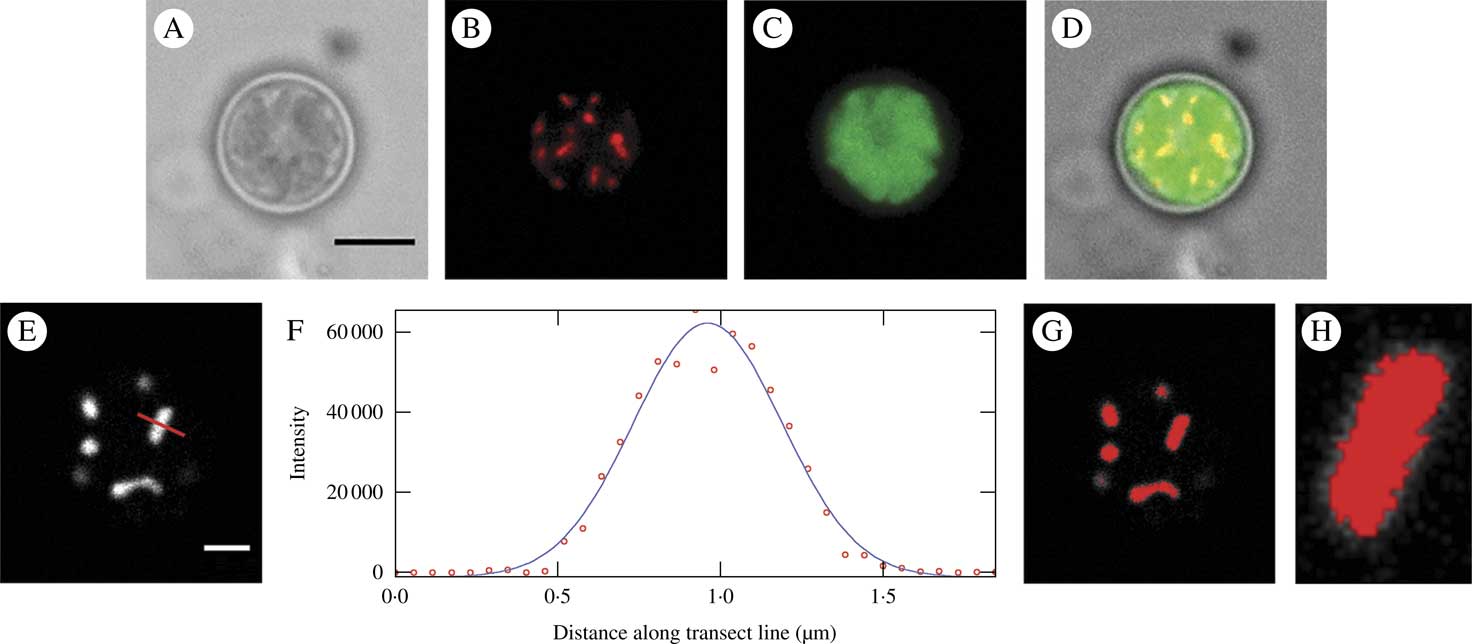
Fig. 4 Mitochondria in Trebouxia cells labelled with 1μM MTO and imaged by standard widefield microscopy (A–D) and confocal microscopy (E–H). A, bright field image; B, raw image of the mitochondrial fluorescence channel (EX: 543 nm, EM: 585 nm) showing mitochondrial labelling; C, chlorophyll autofluorescence labelling chloroplast (EX: 488 nm, EM: 670 nm); D, merged image; E, raw image of the mitochondrial channel from a confocal image showing mitochondrial labelling; F, intensity plot of transect of single mitochondrion in image E (indicated by red line) shown as raw data (circles) and a fitted Gaussian curve used for deriving the FWHM threshold; G, image E thresholded using the FWHM derived from F; H, close-up of single mitochondrion from C showing good matching of threshold and visual area of the mitochondrion. Scales: A=5 μm, E=2 μm.
The utility of the optimal dye system (1 μM MTO) for 3D reconstructions based on sequential optical sections is illustrated in Figs. 5 A–H, which include both the raw signal and that after deconvolution. Deconvolution using the empirically derived PSF (point spread function) showed significantly reduced distortion in the z-axis while causing little change in the xy plane. Finally, reconstructed volume projections showing both the mitochondrial data, the chloroplast from the same cell based on imaging chlorophyll autofluorescence and a composite projection of both channels are shown in Fig. 5 I–L. An iso-surface threshold derived from the mitochondrial data is also shown, illustrating that MTO labelling is also suitable for 3D thresholding and hence measurement.
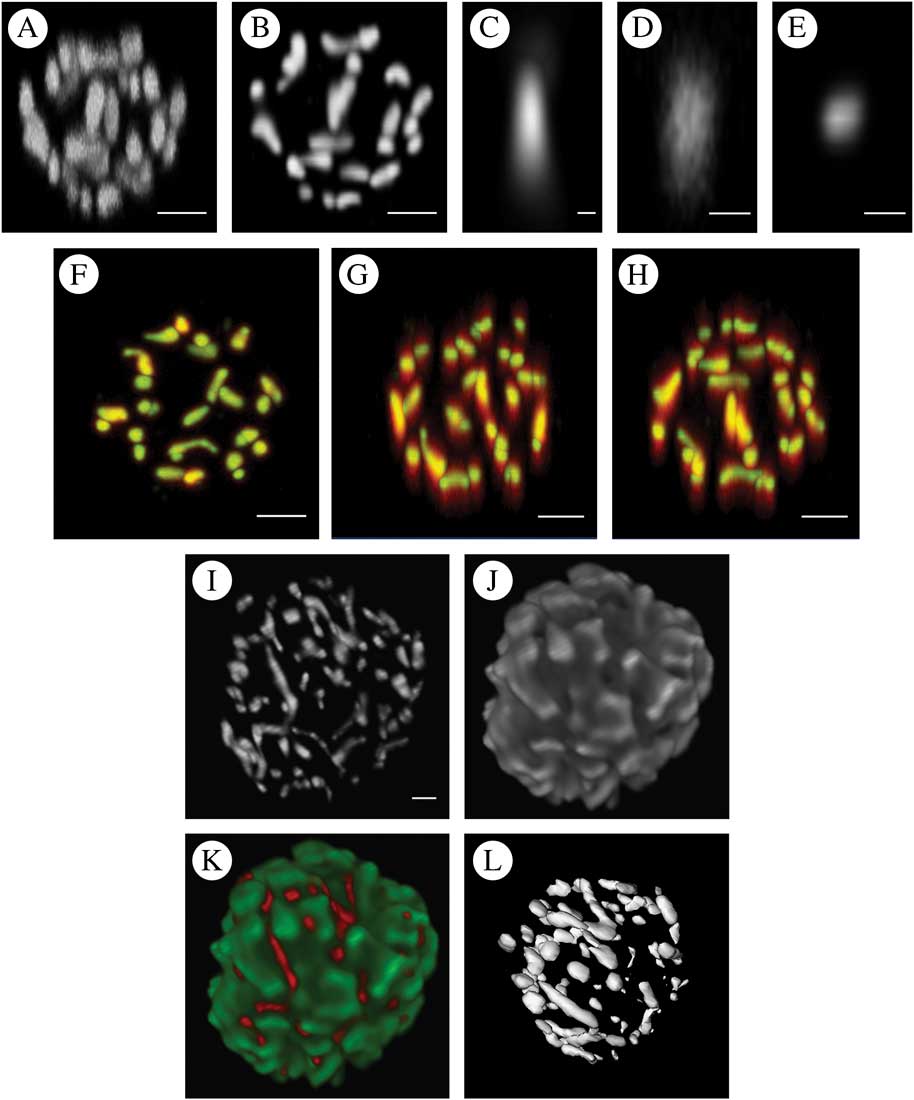
Fig. 5 A–H, the effect of deconvolution on 3D reconstruction of the chondriome of a single Trebouxia cell labelled with 1 μM MTO using confocal images with a 200 nm z increment. A, maximum intensity projection (MIP) of raw data; B, MIP of the same data following deconvolution; C, empirical point spread function derived by imaging subresolution fluorescent beads used for iterative maximum likelihood deconvolution to derive B and E; D, MIP of raw single mitochondrion in xz projection (the image should be approximately circular, note the severe elongation in z); E, MIP of the same data as D in xz projection after deconvolution; F–H, superimpositions of the raw (red) and deconvolved data (green) as MIPs in the xy (F), xz (G) and yz (H) directions. Areas where red alone is visualized are those where the deconvolved image showed significant distortion, whereas the yellow/cyan areas are those where the raw and deconvolved images superimpose. There is much greater distortion in the z direction in the raw images than in the xy directions with consequently greater improvement following deconvolution. I–L, 3D reconstructions of the chondriome of Trebouxia cells labelled with 1 μM MTO using a z stack of confocal images with a 200 nm z increment and post-imaging deconvolution using an empirical point spread function and maximum likelihood deconvolution. I, maximum intensity projection (MIP) of mitochondrial channel; J, MIP of chloroplast data derived using a second emission channel imaging chlorophyll autofluorescence; K, composite MIP of mitochondrial (red) and chloroplast (green) channels; L, iso-surface threshold of I. The orientation approximates that of I but not exactly so due to limitations of the thresholding software plugin. Scales: A & B, F–H=2 μm; C=0·02 μm; D & E=0·5 μm, I=1 μm.
Discussion
Each of the candidate dyes has been shown to be useful in a variety of cell types. However, the results of this investigation indicate that the value of these agents is highly variable for photobiont mitochondrial labelling. Two of the stains (DASPMI and MTG) were ineffective as mitochondrial stains. R123 demonstrated the same lack of labelling in the majority of cells but occasionally produced a well-labelled cell (Fig. 3). The pattern of labelling suggested that the stain was excluded from the cell by an inability to cross the cell wall or the plasma membrane rather than an inability to accumulate in mitochondria in response to mitochondrial potential. In a study using the chlorophyte alga Chlamydomonas rheinhardtii, it was reported that R123 was the most useful in producing consistent mitochondrial labelling (Brickley et al. Reference Brickley, Cobb and Lawrie2012). This previous study used media with a lower pH than the buffer used here (pH 5·5 compared to pH 7) and it has been reported elsewhere (Fricker Reference Fricker2001) that some dyes with similar structure to R123 may be loaded into the cell better in acid media. Further work on loading conditions might result in greater success using this stain. Additionally, R123 is a potentiometric dye capable of reporting mitochondrial potential in algae (Brickley et al. Reference Brickley, Cobb and Lawrie2012) and other cells (Vannini et al. Reference Vannini, Pancaldi, Poli and Easulo1988), which would prove useful in photobiont studies. Work is therefore underway to increase the consistency of this dye in the current cell application.
Three stains demonstrated significant potential for labelling mitochondria in the current study (DIOC7, JC-1 and MTO). MTO produced significantly better labelling than the other candidate dyes both in terms of higher SNR and less noisy labelling of mitochondrial structures. SNR is the best measure of assessing quality of labelling rather than, for example, overall labelling intensity as it measures the extent to which the mitochondrial signal can be picked out against the cellular background. When a stain yields intense mitochondrial staining with little background labelling, the SNR is maximised and indicates the ideal characteristic of an organelle stain. In the present work, MTO approached this ideal. In addition, the mitochondrial labelling demonstrated less noise (that is variation around the mean intensity within labelled structures) than the other stains. This resulted in images that were more aesthetic but it also allowed better thresholding of the image for morphological studies.
The ideal dye concentration is the lowest that allows the desired imaging task to be carried out, since this will minimize cellular toxicity. 1 μM MTO yielded mitochondrial labelling with good SNR and consistent mitochondrial fluorescent signals when imaged with a confocal microscope. Although not formally assessed, this concentration did not appear to modify normal cell anatomy over the length of the imaging experiment (typically 60–90 minutes including labelling time) with no detectable signs of cell stress. However, in principle, the lowest possible concentration should be used to minimize the effects of artefacts and for some studies where SNR is less critical, the lower 500 nM concentration would be adequate. Although the concentrations of MTO reported here should be optimal for many studies, if a particular application required longer-term cell vitality then it would be important to assess the effect of MTO staining on cell physiology and vitality over the proposed duration.
The current study also qualitatively explored the value of deconvolution to improve the resolution of optical sectioning in this application. McNally et al. (Reference McNally, Karpova, Cooper and Conchello1999) reported that deconvolution of both confocal and widefield images increased the resolution of single image slices both in the xy plane and z planes (that is through the image stack perpendicular to the direction of each optical slice). Many studies using animal cells have reported the use of deconvolution to improve the quality of experimental data, for example in imaging brain tissue (Zandt et al. Reference Zandt, Liu, Veruki and Hartveit2017). However, plant and algal cells present very different imaging problems compared to those of animal cells. Firstly, they tend to remain essentially spherical in shape when mounted due to the cell wall, rather than flattened as in the case of many animal cells. This means that optical sectioning must occur through a greater depth to render the whole cell volume. Secondly, algae have a large central chloroplast that both strongly absorbs excitation light and emits strong wide-band far-red autofluorescence. This means that structures which lie between the chloroplast and the excitation source (here the confocal laser scanning the sample from above) will be significantly ‘shadowed’ by the strongly absorbent chloroplast. The emission signal must pass back through the chloroplast to arrive at the detector with significant attenuation and will potentially experience crosstalk with the chloroplast autofluorescent emission. These factors make inferences regarding the utility of deconvolution drawn from studies using animal cells of limited value.
Deconvolution of optical section data of photobionts results in significant qualitative improvements in z resolution (Fig. 5 A–H). The difference can be seen very clearly when the pre- and post-deconvolution mitochondrial image data are colour coded and used to produce a superimposed volume (Fig. 5 A–H); xy data show only modest gains in resolution whereas in the z dimension the increase in fidelity is obvious, with raw data showing elongation of the mitochondrial structures along the z plane. Deconvolution software is now widely available as both public domain plugins for FIJI (Vonesch & Cristofani Reference Vonesch and Cristofani2014) and commercial software as used in the current study (Hyugens, SVI Imaging, Netherlands). Serial optical section data collection, deconvolution and volume reconstruction are all technically demanding and further work is required to optimize a protocol for 3D volume construction and measurement for the photobiont chondriome. Following deconvolution, the reconstructed volume data were amenable to iso-surface thresholding to produce discrete and measurable representations of individual mitochondria within Trebouxia photobiont cells.
The resultant data produced images of extraordinary beauty (Fig. 5 I–L) but what is their significance? Little is known about the morphology, and to some extent function, of the normal chondriome in lichen photobionts and such studies that have been undertaken have used small numbers of cells subjected to EM serial sectioning (Jacobs & Ahmadjian Reference Jacobs and Ahmadjian1969). The technique presented here permits the study of large numbers of photobiont cells and results in quantitative data that are amenable to statistical analysis. Potential applications of this staining technique include studies of how the chondriome changes during the cell cycle, the relationship between the chondriome and other structures such as the nucleus and chloroplast, and exploration of the chondriome response to various cell stresses (for example dehydration). It might also be possible to look for inter-species differences in mitochondrial morphology that could be habitat related and of use to taxonomy. Although not formally assessed in the current study, it was notable that the chondriome had an extraordinarily intimate relationship with the chloroplast, as can be seen in Fig. 5 I–L.
In summary, the current study tested a wide range of potential mitochondrial stains for labelling the chondriome of Trebouxia cells fractionated from Xanthoria parietina. The best performing MTO stain was optimized and the effect of deconvolution on the data was explored. Overall, the optimal protocol for both 2D and 3D imaging of mitochondrial morphology was labelling for 30 minutes with 1 μM MTO. This technique should find wide application in diverse studies of photobiont chondriomes.
I thank Andy Cobb who first sparked my interest in algae and who has been my mentor for several decades, and Chris Hawes for generously sharing his extensive knowledge of microscopy and botanical cell biology. David Hill provided some much needed initial encouragement to study photobionts.


