


1. Introduction
Did trade patterns in services change after the external shock of the Global Financial Crisis (GFC) in 2008 into more digital-intense activities, and was this shift structural? What countries are likely to have experienced this shift, and can one make any predictions which countries are likely to see a further shift away from traditional non-digital services into digital-intense services after the current economic crisis resulting from COVID-19 pandemic? Quotes in business media are clear that the pandemic will significantly ‘accelerate digitalization and is serving as a catalyst for the growth of non-physical goods trade’ (Bloomberg, 2020).
The rapid growth of trade in services, or trade in non-physical goods, is nothing new. Compared to goods, they have been growing fast since the GFC of 2008. However, Figures 1 and 2 show that especially digital-based services, such as computer and R&D services, have seen a fast-growing pace in exports since 2008 if benchmarked to the rest of the services economy. Both computer and R&D services are highly digitalized and were already utilizing a considerable amount of software technologies before the current economic crisis. Yet, it is largely expected that it is COVID-19 that will escalate trade to become more digital and services based. Although this may be true, the figures suggest that this was already happening before the pandemic. Therefore, this paper asks the question: to what extent had this shift into digital-intense services already happened before the current crisis and did the 2008 GFC play any role in this shift? And, if so, which countries were more likely to exhibit this trend before the 2008 GFC on the basis of their economic characteristics?

Figure 1. Trade growth for computer and other services (2005–2017).
Source: WTO-UNCTAD-ICT.

Figure 2. Trade growth for R&D and other services (2005–2017).
Source: WTO-UNCTAD-ICT.
The previous literature on the relationship between trade and the GFC is largely empirical and is divided into two strands. The first strand assesses the impact of the trade collapse of 2008–2009 related to goods and investigates this from various angles, such as from the perspective of global value chains (di Mauro et al., Reference di Mauro, Ottaviano, Vicard, Altomonte and Rungi2012); financial frictions and trade finance that played a contributing role (Ahn et al,, Reference Ahn, Amiti and Weinstein2011; Amiti and Weinstein, Reference Amiti and Weinstein2011); credit conditions (Chor and Manova, Reference Chor and Manova2012 and that the trade shock was in large part been due to a demand shock and can be traced back to product characteristics (Bricongne et al., Reference Bricongne, Fontagné, Gaulier, Taglioni and Vicard2012). Theoretical models were also developed and tested. These works found that the trade collapse was in main part due to a reduction in efficiency of investment in durable manufacturing, pointing out the changes in demand rather than productivity or trade frictions that caused the collapse (Eaton et al., Reference Eaton, Kortum, Neiman and Romalis2016), something that Behrens et al. (Reference Behrens, Corcos and Mion2013) also concluded.
The second strand evaluates the GFC from a services vantage point, although this literature is much smaller. One first important work was provided by Borchert and Mattoo (Reference Borchert and Mattoo2010), which separated services into two groups: services related to goods trade, such as transport services, which all suffered a major blow; and other modern services, such as technical and professional services. The authors show that demand for these latter services was less cyclical, which they test with Indian data. A related paper by Ariu (Reference Ariu2016) delved deeper into the reasons as to why services are more resilient to crises with respect to a short-term shock. The main explanation needs to be found on the demand side. Services have a different elasticity with respect to GDP growth, which in effect means that their demand structure is more or less continuous and stable (especially for modern services), because of their consumable nature (as opposed to durable).
This paper is related to this nexus between services trade and the economic crisis of 2008, but takes a long-term view on a different question: did the period after the GFC of 2008 mark a structural shift away from trading in traditional non-digital services into more digital-intensive services activities, and, if so, what characterizes a country's economy that did so? Borchert and Mattoo (Reference Borchert and Mattoo2010) and Ariu (Reference Ariu2016) find many of the services to be more resilient to the GFC as well as much more receptive to the application of information and communications technology (ICT) and other software technologies. This paper therefore explores whether trade in service sectors, which are classified as digital-intense, is a factor in explaining changing trade patterns after the GFC.
The way the analysis of this research question is performed is to take an historical perspective as employed in Freund (Reference Freund2009) who was one of the first to investigate the role of the trade collapse from a longer time horizon. Due to reasonably good services trade data that are now available, this paper starts in 2005 and therefore investigates the main hypothesis of whether the period before the current pandemic and after the GFC in 2008 witnessed a change in services trade patterns. In doing so, this paper looks at services to isolate any stagnating trends of goods trade before the current crisis, which was particularly manifest in the form of lower trade elasticities (WTO, 2020). Moreover, the recent drop in trade as a result of the pandemic also falls outside the scope of the analysis due to the lack of consistent data.
To explore this paper's research question, it uses a Difference-in-Difference (DID) approach to investigate whether patterns in services trade became markedly more digital post-GFC. We therefore test implicitly whether the GFC formed a ‘break’ in the patterns of services trade. There are some reasons to think that digitalization took off speed for firms which, as a result, for instance, enabled them to continue to outsource digital activities as services are less cyclical (Borchert and Mattoo, Reference Borchert and Mattoo2010). For instance, in the wake of the GFC, the banking sector made substantial adjustments to their business models, forced by new regulations and lower profitability (Caparusso et al., Reference Caparusso, Chen, Dattels, Goel and Hiebert2019). On the other hand, the already ongoing digitalization of the economy may have pushed services trade to become more digital-intense too. In that sense, a significant shift into digital-based services following the DID specification could simply indicate a shift in demand for these types of services.
In any event, such a significant change would make it clear that, although the COVID pandemic may have led to an acceleration of digital technologies being applied to services trade, the period before had already seen a movement into trade in digital-intense services. Moreover, this trend became in large part significant in the period after the GFC and not before. This could suggest the GFC formed an independent move that turned services trade to become more digital – although there are significant signs in our specification that this somewhat already happened before 2008.
This paper also asks the question which countries have experienced a greater increase in digital-intense services trade, and on the basis of which economic characteristics. Not all countries are equally able to profit from the change in patterns of services trade. For instance, some countries are better equipped with a digital infrastructure and therefore have a stronger capacity to absorb new digital technologies. Equally, some countries have a higher level of human capital and given that on the whole digital services are more skill-intensive, these countries are better able to tap into this shift towards more digital-intense services trade (Nayyar et al., Reference Nayyar, Hallward-Driemeier and Davies2021). Therefore, such countries can be expected to profit comparatively more from digital services trade after the current crisis than countries with lower levels of these enabling factors.
Hence, this paper tries to find answers to these questions by extending the DID specification. In particular, this paper examines whether countries at a particular level of economic development experienced a rise in digital trade after 2008 GFC. In similar fashion, we also analyze whether other economic characteristics based on enabling factors such as human capital and digital infrastructure are associated with the move into digital services.
Altogether, the results of this paper show that the period after the GFC became indeed more digital-based as digital-intense services exports appeared to have on average started to outperform other non-digital sectors after 2008 by around 6%. Moreover, this paper also finds that a shift was not significant before the GFC although this result depends on which data source of services trade is being used. Therefore, any interpretation that the GFC truly formed a watershed moment needs to be taken with careful consideration. In any event, the trend of services to become more digital-based, moving away from other non-digital-intense services, is significant and illustrates that most likely the COVID-19 crisis will only intensify already existing patterns of trade in services.
The empirical DID specification shows that the results of this paper are robust when including control variables that try to capture the restrictive levels of regulations that were applied or reformed in various digital and non-digital-intense services during our period of analysis. Finding consistent variables for restrictive regulations in both digital and non-digital-intense services is somewhat challenging because of the lack of consistent coverage and time-varying trade restrictiveness indices for services sectors. Nonetheless, to the extent possible, this paper includes these proxies and finds that any reforms of services trade restrictions in either digital or non-digital-intense sectors does not affect the results.
Further, the extended analysis shows that countries with a comparative advantage in digital services and strong internet usage are the ones that have experienced this shift into digital-intense services trade. However, results that are more interesting are that upper-middle income countries and countries with medium levels of human capital have also seen a sizable shift into digital-intense services compared to that of non-digital intense services since the GFC. The result of this extended DID specification allows for a study of those countries that are most likely to have caused this shift in digital-intense services trade. We map countries based on several of economic characteristics as used in the extended DID regression analysis.
The remainder of the paper is organized as follows. The next section sets out why patterns of trade had started to shift already before the current pandemic and after the GFC. The third section uses DID analysis to present the empirical baseline specification. In this section, we also explain how this paper measures and classifies the group of digital-intense sectors. Then, the third section presents the results of the baseline DID specification as well as the results of the extended DID specification. Finally, the last section concludes by discussing the results in light of the current crisis.
2. Would the GFC Matter?
As a global demand shock, the GFC altered trade in different sectors in different ways (Benguria and Taylor, Reference Benguria and Taylor2020). Borchert and Mattoo (Reference Borchert, Mattoo and Baldwin2009, Reference Borchert and Mattoo2010) describe how the trade collapse during the GFC affected demand for services in a different way than that for goods. Using monthly trade data, their study showed that although both goods and services experienced a drop in trade, the drop for goods was more pronounced than that for services. Goods trade for the US experienced a downfall ranging between 32% and 40% whilst that for services was between 15% and 17%. Principle demand-side reasons the authors put forward to explain this difference focuses on the reduced cyclical nature of services.Footnote 1 Services are to a lesser extent likely to be stored, making them unresponsive to big declines in demand during downturns. Moreover, many services need to continue to be performed even during a crisis, making them less discretionary, too.
Using micro-level data from Belgium, Ariu (Reference Ariu2016) corroborates these claims by looking at within-firm dynamics. In his study, services firms were much less affected by the demand shock than were goods. As the author shows, the elasticity of exports with respect to GDP growth in the importing countries was significantly different in services from that of goods. In fact, the decline in income caused by the GFC affected mainly demand for goods from the exporting country, and not so much for services. Moreover, Ariu also finds that business services, telecommunications, and financial services exhibited continued growth equal to pre-crisis trends – a finding that was also found for the US in Borchert and Mattoo (Reference Borchert, Mattoo and Baldwin2009, Reference Borchert and Mattoo2010). Goods-related services trade such as transport in addition to tourism suffered most, whereas services such as insurance, business, finance, and telecommunications continued to expand.
In fact, for many of the services both Borchert and Mattoo (Reference Borchert and Mattoo2010) and Ariu (Reference Ariu2016) find them more resilient to the GFC in addition to being much more receptive to ICT and other software technologies. However, even though these works find that many of these services are intrinsically different, which makes them insulated to a global demand shock, they do not yet make any suggestions as to why specifically digital-based services trade would have shown continued expansion post-GFC.
The global downturn could have caused firms to hasten their adoption of digital technologies, such as cloud computing and online platforms, for their business sales to save costs. A supply side factor may also help explain why after the GFC services trade was more resilient and became more digital. Recent research documents that trade costs that had been high for several services had started to decline markedly as of 2008 (WTO, 2020). Notably, distribution, maintenance and repair, and other business services – albeit to a lower extent – saw a strong decline in trade costs or witnessed a gradual decrease that became stronger after the GFC. Factors causing this decline are not assessed, but the authors state that for instance the fall in trade costs for retail must be seen with respect to the explosion in online sales. Indirectly, this points to the rise of digital platforms as a driving force behind the fall in trade costs, pushing trade upwards in the sector during and after the crisis.
Caparusso et al. (Reference Caparusso, Chen, Dattels, Goel and Hiebert2019) show that large international banks made substantial changes to their business models in the wake of the GFC. In large part, this was driven by stricter regulations, but along with these changes, the competitive landscape has been reshaped in a manner that allowed new technology-specific financial services providers to enter the market, such as fintech (Edelmann and Hunt, Reference Edelmann and Hunt2017). And although the GFC prompted many banks to curtail on their international relationships with associated local partnerships in developing countries, other major banks have continued to expand in developed market countries (MGI, 2018). In sum, insofar that the adoption of digital technologies is associated with changing business models, the increase in trade in digital-based services is likely to be a natural result for firms who reformed after the global downturn.
But the manufacturing sector may have also played a role. A recent study by Konings and Yergabulova (Reference Konings and Yergabulova2021) show that larger firms suffered a lot more during the GFC compared to the current pandemic crisis for which the opposite holds given that the non-tradable sector has experienced a massive disruption. More important, however, is that the authors further show that industry-specific characteristics go a long way in helping to explain how crisis shocks affect firms generally, and did so between the two crises. The authors show that especially the manufacturing sector was hit harder during the GFC. As the manufacturing sector typically includes firms that are large when compared to services, the GFC probably caused a demand shockwave for tradable goods produced in the manufacturing sector during and after the GFC, as the authors argue.
In turn, it is also likely that the GFC caused reduced demand for manufacturing-related services. Insofar that many non-digital services, such as transport and wholesale, are closely connected to goods-related trade, the period after the GFC may have by default amplified the rise in digital-related services trade. The WTO (2020) finds that around half of global trade in transport services is driven by trade in manufactured goods, whether or not these goods reach consumers directly or are used as inputs by firms. Also, wholesale has a strong role to play for connecting international production networks and the transhipments of goods. Therefore, at the very least, the decline of goods trade following the GFC, and its subsequent sluggish growth after, caused trade in non-digital-intense services to go relatively more downwards compared to digital-intense services – even if the latter did not experience a special push due to the GFC.
In sum, even though the GFC may have caused an increase in the adoption of digital technologies, various other reasons may also have contributed to the shift into digital-intense services after the crisis. One is the specific nature of services – the fact that some services are more receptive to digital technologies makes them less reactive to crises. Digital technologies significantly reduce trade costs and the ongoing implementation of digital technologies could explain the growth of trade in these activities irrespective of a global crisis. In that case, the adoption of digital technologies then naturally shifts demand towards digital services. Whether this was really caused by the GFC is thus not straightforward. The empirical analysis of this paper however does find some support for this, but also finds that a shift towards trade in digital-intense services had, to some extent, already happened before 2008. Moreover, a separate channel of reduced growth in trade of manufacturing goods and therefore goods-related services trade may have also caused a relative trade increase in digital-related services.
The DID specification as set out in the next section picks up on both factors, the DID analysis cannot make a distinction between these types of explanations. All what the specification considers is whether the expansion of services, measured as digital-intense, diverged significantly from other services during the period after the 2008 GFC. Both demand and supply side factors may have played a role in the differing patterns of trade between digital and other non-digital services.
3. Empirical Analysis
As said, the empirical strategy employs a Difference-in-Difference (DID) approach in which the outcome variable is regressed against a set of dummies that separate two groups for two time periods, before and after the GFC in 2008. The two groups are the treatment group, the other one the control group. As with a standard DID analysis, the treatment group is exposed to a ‘treatment’ in the second period, which in this case is after the GFC, whereas the control group is not subjected to the treatment during either time period.
In this paper, the outcome variable is services trade, which is regressed on the treatment group, which is composed of sectors that are considered as digital-intense on the basis of their software-intensity and whether they are classified as digital deliverable (see below) for the period after the GFC. More specifically, a dummy variable is assigned to a digital sector on the basis of these two conditions, starting from the year 2009. The control group, the non-digital-intense sectors, is not exposed to this treatment and therefore receives a zero during the entire time period in our regressions. The DID approach is therefore made up of two levels of ‘differences’, namely the one that distinguishes between digital-intense and non-digital-intense services sectors; and the other one that differentiates between pre- and post-GFC, i.e. before and after 2009. In more formal terms, we regress the following baseline specification:
 $$ln( {{\rm SX}} ) _{cst} = \Phi + \theta {\rm D}_{st}{\rm \;}\cdot {\rm Digital\;intense} \ge 2009 + \delta _{cs} + \gamma _{ct} + \varepsilon _{cst}$$
In equation (1), the response variable is the logarithm of cross-border exports of services (SX) in country c, for service sector s in time t. To check for consistency, data are taken from two sources: the WTO-UNCTAD-ITC dataset, which covers exports and imports of total commercial services, and the OECD TiVA database which also reports exports and imports of trade in services. The term D st denotes the dummy variable that captures any difference in services exports between digital-intense and non-digital-intense services before and after 2009.
The fixed effects capture all other aggregate factors that would cause changes in services trade over time, even in the presence of a policy change. They are specified by country-sector, δ cs, and country-year, γ ct. The former controls for country-sector specific conditions, such as endowment and technology structures of a country that affect specific sectors or even services policy; the latter controls for country-specific trends over time that affect the entire economy, such as macro-economic circumstances. Sector fixed effects are applied at the 2-digit aggregate level as reported in both data sources. Finally, ɛ cst is the residual term. Regressions are estimated with robust standard error clustered by country–sector–year and are performed for the period 2005−2015/2018 in a panel setting throughout. Hence, four years identify the pre-GFC period whereas up to nine years determine the post-GFC years.
The WTO-UNCTAD-ITC dataset covers 222 entities, which include countries and economic groupings for 2005–2018 at the 2-digit level. The data are in line with the sixth edition of the IMF Balance of Payments and International Investment Position Manual (BPM6) as well as the 2010 edition of the Manual on Statistics of International Trade in Services (MSITS, 2010). This entails that, compared to the BPM5 classification, major changes for the Balance of Payments (BOP) classification for services have been introduced with regard to financial intermediation services, insurance services, intellectual property, and manufacturing and maintenance services.
The second dataset is from the OECD TiVA which also reports gross trade in services. This dataset goes beyond commercial sectors as it covers several personal services such as health and education. The data cover 162-digit service sectors for 66 countries, including OECD and non-OECD emerging countries for the period 2005–2015. The dataset has a self-constructed industry code, which closely follows the ISIC Rev 4 classification scheme. Compared to the WTO-UNCTAD-ITC dataset, these data have fewer combinations within commercial services. For instance, the former also reports separate entries for R&D services, computer services, and professional and management services, whereas the OECD dataset aggregates these sectors up into ‘Other business services sector’. Similarly, Finance and Insurance are separated in the WTO-based dataset, whereas with the OECD data the two sectors are combined.
3.1 Digital-Intense Services
Digital intensities are assessed based on two information points: computing software-intensities and whether the services are digital deliverable.
Software-intensities are measured using information on US sectoral software usage. Specifically, this paper takes the 2011 Census ICT Survey from the US, which reports data at the 4-digit NAICS sector level. This data are survey-based and record how much each industry and service sector spend in mm USD on ICT technology in terms of hardware equipment and computer software.
The survey reports two types of software expenditures, namely capitalized and non-capitalized. Both types are selected because the two indicators together inform us about the degree to which sectors are digital-intense. Capitalized expenditure is closer to the concept of intensities with respect to labor and capital as a factor of production (e.g. Romalis, Reference Romalis2004; Chor, Reference Chor2011). Non-capitalized expenditure instead relates more to the input of firms that enter the production function with intermediate inputs. Capitalized expenditure is comprised of longer-term investments in computer software. It excludes purchases and payroll for software development as well as software licensing and services, and maintenance agreements for software, which are all components that are measured as non-capitalized expenditures.
The year 2010 is selected to compute these software-intensities. As it lies in the middle of the time period, choosing this year avoids the risk of being endogenous to the trade data. Software expenditure is divided over labor, for which we also use data for the year 2010. Data for labor is sourced from the US Bureau of Labour Statistics (BLS). These software-intensities are therefore similar to the ones computed in Ferracane and van der Marel (Reference Ferracane and van der Marel2021).
The intensities are computed at the 4-digit NAICS level and then concorded into 2-digit BPM6 and ISIC Rev. 4, depending on the trade data used in the regressions. Because no concordance table exists between NAICS and BPM6, a self-constructed matrix is used. Numbers are aggregated at the 2-digit BPM6 level by taking the simple average. Note that one sector forms a mismatch between the two classification tables, which is Intellectual property/Royalties and license fees. This category is reported neither in the US Census nor in the BLS database. Even though this sector is included in the WTO-UNCTAD-ITC trade in services dataset, and although it reports high trade values, the inclusion of this sector is a BOP decision, and some debate exists whether this is truly a service. In addition, for some countries, this may also reflect tax and transfer pricing as drivers of observable trade in this sector. Because of these sensitivities, we drop this sector from our regressions.Footnote 2
The second information point to qualify a service as digital-intense is based on the OECD-WTO-IMF (2020) classification of digital trade. The handbook makes a distinction between digital ordered and digital delivered services. It prescribes that digital ordered trade is the international sale or purchase of a good or service, conducted over computer networks by methods specifically designed for the purpose of receiving or placing orders. This does not mean, however, that a service can therefore be digitally delivered. The handbook refers to digitally delivered services as those services that are delivered through computer networks. Note that the handbook states that only services can be digitally delivered.
There is of course an overlap between the two concepts, but the handbook provides an explicit list of digitally delivered services. This list is used to help further select our tabulation of digital-intense services. The sectors that the OECD-WTO-IMF handbook classified as digital delivered services can be found in the second column of Table 1. If one compares this classification with the software intensities, which are provided in the third column of the table, some clear overlaps become visible. This is particularly true regarding the sectors Insurance, Finance, IPR, Telecommunications, Computer, Information, and R&D. Some transport services are also high in software usage but are not classified as digitally deliverable. Most likely, therefore, their high ratio is serving other purposes than their tradability, such as in the case of Sea transport.
Table 1. Digital-intense sectors using the WTO-UNCTAD-ITC classification

Note: Sector classification is based on the WTO-UNCTAD-ITC database. Digital delivered services are based on OECD-WTO-IMF (2020) and Software intensities are based on Ferracane and van der Marel (Reference Ferracane and van der Marel2021).
For the DID analysis all that is needed is an indicator that assigns unity to a services sector that is assessed as digital-intense. In doing so, we determine a service sector as digital-intense every time the sector shows a higher software-over-labor ratio than the sample median and is classified as a digital delivered service. Otherwise, sectors are assigned a zero, which indicates that they are non-digital-intense. Note however that there are several business services that have a low software-intensity whilst nevertheless being selected in our list of digital-intense services. This is because these services are consistently assessed as digital-enabled by statistical institutions, whereas other services with high software-intensities are not. These services are Professional & management, Technical and trade-related services, Audio-visuals, and Personal, cultural and recreation services.
In Table 1, the sectors Telecommunications, Computer services, and Information services are first selected as digital-intense given that these sectors are highly digital. Information services cover activities such as data processing activities and web search, which are all highly intensive in the usage of software. Both financial and insurance services are also assessed as having a high ratio of software over labor and are part of the first expanded list of digital intensities in the ‘Digital+ Fin’ column in the table. The two sectors are more broadly considered as very digital-intense given that over the years internet technologies have massively changed these industries.Footnote 3 This selection of sectors is further extended with additional services following the discussion above. Of note, the four digital delivered sectors with low software ratios are only selected in the last two columns.
The assessment of sectors as digital-intense is repeated also for the OECD TiVA classification, which is based on ISIC Rev 4. Table 2 shows which sectors, following the OECD-WTO-IMF handbook, are assessed as digital deliverable, and also provides the re-computed software intensities after re-concording. There are some differences in the classification of services sectors across the BPM and ISIC schemes and therefore some sectors are left without a software-intensity ratio. By similar token, on the basis of the two information points, the table classifies the services sectors as digital, and gradually expands the coverage. Again, telecommunications and IT and other information services are classified as the initial digital intensive sectors. Then this narrow definition of digital-intense services is gradually expanded with additional sectors, such as Financial and Insurance, Distribution, and Other business services.Footnote 4 Note that Education and Health as well as Arts, entertainment and recreation are saved again for the last definition of ‘Digtial+’ sectors.
Table 2. Digital-intense sectors using the TiVA classification

Note: sector classification is based on the OECD TiVA database. Digital delivered services are based on OECD-WTO-IMF (2020) and Software intensities based on Ferracane and van der Marel (Reference Ferracane and van der Marel2021).
4. Regressions Results
The results of the baseline regression equation are reported in Tables 3 and 4 for the WTO-UNCTAD-ITC and OECD TiVA data, respectively. The columns in both tables are presented in correspondence with the columns in Tables 1 and 2 in which the different digital-intense sectors are categorized. In Table 3, the coefficient result in column 1 shows a positive and strongly significant outcome. This indicates that the period after 2008 saw a significant increase in exports in sectors classified as digital. Subsequent columns in the table report the coefficient results when gradually adding the other digital-intense sectors. In all but the second column, the coefficient results are positive and significant.
Table 3. Baseline regression results using WTO-UNCTAD-ITC dataset

Note: *p < 0.10; **p < 0.05; ***p < 0.01. P-values are given in parenthesis. The dependent variable the log of services exports ln(SX) using data from the WTO-UNCTAD-ITC BPM6 database. Fixed effects are applied at the country-sector and country-year level. Period of regressions is 2005–2018. Regressions are estimated with robust standard error clustered by country–sector–year. Column titles correspond to the sector specification as presented in Table 1.
Table 4. Baseline regression results using TiVA dataset
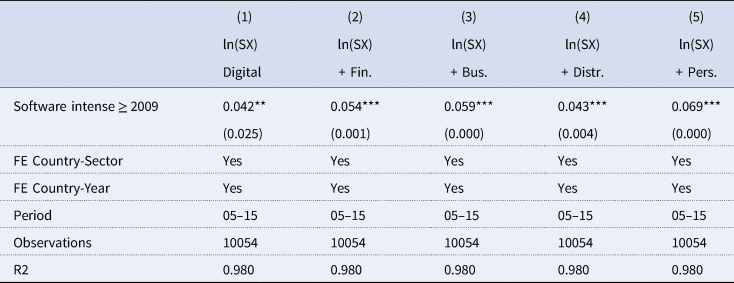
Note: *p < 0.10; **p < 0.05; ***p < 0.01. P-values are given in parenthesis. The dependent variable the log of services exports ln(SX) using data from the OECD TiVA database. Fixed effects are applied at the country-sector and country-year level. Period of regressions is 2005–2015. Regressions are estimated with robust standard error clustered by country–sector–year. Column titles correspond to the sector specification as presented in Table 2.
The results in Table 4 show in a similar manner a positive and strongly significant coefficient outcome. As noted in the table, the time coverage is slightly shorter because of the limited number of years available in the OECD TiVA dataset. Note that even though the classification list of sectors does not entirely overlap from column to column between Tables 3 and 4, a striking comparison appears across the coefficient sizes reported in both tables, particularly when adding the other digital-intense services. Specifically, the closest list of digital sectors that is comparable between the two data sources is in column 4 of Table 3 and column 3 of Table 4, when the sector of distribution is not yet added to the expanded list of digital sectors.Footnote 5 Comparing both results in the two columns reveals an almost identical coefficient size, namely 0.053 and 0.059.
In economic terms, by taking these two coefficient results and computing the expected values implies a trade impact that ranges between 5 and 6%. It suggests that digital services sectors have experienced an increase in exports of about 5–6% compared to non-digital sectors in the years following the GFC, i.e. after 2008.
4.1 Controlling for Services Trade Barriers
Given the DID nature of the empirical model, and the applied fixed effects, there is little room for adding control variables. Yet, there may be factors varying over time at the country-sector level that could influence the performance of digital trade. For instance, some countries may have developed a strong digital infrastructure with sophisticated internet connections that help develop trade in digital services. But proxies for the quality of the digital infrastructure are often defined at the country–year level and would be subsumed in our fixed effects. Similar with any other ‘endowment’ factor relevant for digital services trade, factors, such as digital skills, vary by country over time and are therefore captured in our set of fixed effects.
However, the flipside of good digital infrastructure is a competitive telecommunications market, which helps to establish thriving digital connection networks and internet penetration. Trade policies can play a part in expanding the availability of broadband access (WTO/OECD, 2017) and therefore could stimulate digital services trade over time, provided they are less restrictive. The convenient factor using trade policy restrictions as a control is that they are developed at the sector-level, so too for telecommunications which is therefore used as a proxy for restrictive regulatory policy developments in digital services. Regulatory trade restrictiveness in telecommunications is measured by two sources, namely the OECD and the World Bank, both labeled as the Services Trade Restrictiveness Index (STRI). Both have advantages and disadvantages. The OECD's measure also covers domestic regulatory policies but has a short time frame (only starting in 2014), plus a small coverage of countries. The World Bank includes many developing countries, which is helpful for this paper, and goes further back in time. However, the World Bank's indicator only measures trade restrictiveness at two points in time: 2008/2011 and 2016.Footnote 6
To make the World Bank indicator useful as a control variable, one needs to manipulate the regulatory policy data somewhat. First, China, Mexico, and Brazil report numbers for the year 2011, instead of 2008. The 2011 index value for these countries is set in line with the other countries. Second, given a complete time span between 2005 and 2018 is lacking, which is the period of the trade data, numbers for intermediate years need to be interpolated. Admittedly, this comes with some assumptions, in that (a) regulatory changes may have happened before 2008/2011 which are unobserved and it is assumed they have not occurred; and (b) regulatory changes that took place between 2008 and 2011 are kept constant till 2016 when the next data point was constructed; and finally (c) regulatory changes post-2016 may have happened, but are also kept constant.
Given the requirement for a dummy variable in a DID approach, one needs to assign unity above a certain threshold that indicates a level of restrictiveness at which reforms are thought to impact. The World Bank STRI ranges from 0 to 100, where 0 indicates that none of the restrictions underlying the index is applied, and 100 means that the sector is completely closed to foreign service suppliers. Note that levels of restrictiveness cover all four modes of delivery given the existence of complementarities in services across the four channels of trade (Shepherd and van der Marel, Reference Shepherd and van der Marel2013).Footnote 7 The World Bank database provides an aggregate number for the level of restrictiveness across all modes. The choice of threshold is set at 50, which is a value that the database describes as ‘intermediate’, a category reflecting measures that are neither minor nor major restrictions (Borchert et al., Reference Borchert, Gootiiz, Magdeleine, Marchetti, Mattoo, Rubio and Shannon2019). It seems reasonable to assume that if a country flips from one side to another important regulatory changes have occurred.
For the regressions, the dummy measure of regulatory levels in telecommunications is interacted with a digital services intensity for the digital sectors listed in column 3, Table 1 (Digital) not the full range of digital services as defined in other columns. This is because reforms in telecommunications may also be felt in other ‘core’ digital sectors, and, in addition, they are first and foremost relevant for these sectors rather than any other digital-enabled sector.Footnote 8 Moreover, by narrowing down to digital services sectors only, one also avoids any potential collinearity issues between the regressors. The control variable is denoted by the interaction term between telecommunication regulation (TEL STRI) and digital services (Digital).Footnote 9
Results are reported in Table 5. The control variable comes out as negative and significant in all columns. This is reassuring in the sense that throughout the entire time period, greater levels of telecommunication restrictions do have an impact on trade in digital services, as one would expect. Telecommunication services form the backbone infrastructure for digital services, and restricting this market has a negative impact on the extent to which countries are able to export closely related digital services. More importantly, including the control variable does not alter the significance of our variable of interest. Note that because the STRI data are only limited for a sub-set of countries, the number of observations drops by more than half. Hence, the sub-sample may bias the results in favor of the significant findings in column 2 and column 4, which in Table 4 remain (almost) insignificant.
Table 5. Baseline regression results using WTO-UNCTAD-ITC dataset and digital STRI control

Note: *p < 0.10; **p < 0.05; ***p < 0.01. P-values are given in parenthesis. The dependent variable the log of services exports ln(SX) uses data from the WTO-UNCTAD-ITC BPM6 database. Fixed effects are applied at the country-sector and country-year level. Period of regressions is 2005–2018. Regressions are estimated with robust standard error clustered by country–sector–year. Column titles correspond to the sector specification as presented in Table 1.
The same controlled regressions are performed but now for non-digital services restrictions. It may be that restrictive regulations in various non-digital services have prevented the latter from catching up with their digital counterparts. If that were that case, the expansion of digital services post-GFC could form an induced phenomenon. This is because the lack of reform in non-digital markets may have prevented trade in non-digital services to flourish, thereby allowing digital services trade to expand relatively faster.
To account for this, a similar threshold of restrictiveness is applied as that for the telecommunications sector, but now for two transport sectors for which restrictive measures can be found in the World Bank STRI. Other sectors included in the STRI database are covered by digital services intensities and so the transport sector is the only one left to proxy for regulatory developments in the non-digital sector. We average the restrictiveness in air and land transport covering for all modes and interact this variable with the two transport services sectors as tabulated in our sector classification, which are Air transport and Other transport, respectively, as defined in Table 1.Footnote 10 The control variable is denoted by the interaction term between transport regulation (TRANS STRI) and air and other transport services (Air & Other).
Results from the regressions are reported in Table 6. The results of the control variable are, in most cases negative, which is reassuring, but they are insignificant. Part of the reason may lie in the fact that only a few countries have reformed their air and land transport services markets over time. Another explanation may be because the definition of transport services is too broad as the two sub-sectors are taken together. However, taking air transport separately does not provide any significance either (results can be obtained upon request). That being said, neither specification of the control variable affects the significance of our variable of interest. The fact that this control variable remains insignificant gives weight to thinking that restrictions in these non-digital services sectors are not suppressing their potential to be on par with the expansion of digital services, although both air and other transport represent about 20% of the total non-digital services export globally.
Table 6. Baseline regression results using WTO-UNCTAD-ITC dataset and non-digital STRI control

Note: *p < 0.10; **p < 0.05; ***p < 0.01. P-values are given in parenthesis. The dependent variable the log of services exports ln(SX) using data from the WTO-UNCTAD-ITC BPM6 database. Fixed effects are applied at the country-sector and country-year level. Period of regressions is 2005–2018. Regressions are estimated with robust standard error clustered by country–sector–year. Column titles correspond to the sector specification as presented in Table 1.
The regressions are replicated using the OECD STRI as a robustness check. In particular, the OECD Digital STRI is taken instead of the World Bank's Telecom STRI. In addition, the OECD STRI for Transport and Logistic services is taken to proxy for non-digital services sectors. The Digital STRI from the OECD is a new indicator that assesses economy-wide digital trade policies relevant for digital services. This STRI does not vary by sector but takes digital services sectors together and therefore reports information by country-year, not by country-sector-year The OECD's STRI for transport is available for all transport types (i.e. air, maritime, and rail and road) as well as all logistic services (i.e. cargo-handling, storage and warehouse, freight forwarding, and customs brokerage). Including logistics is convenient as the trade data also include this sector for transportation services.
For both STRIs, one needs to first interpolate as well. That is, given that both indicators only start in 2014 (till 2020), one needs to assume that policy changes before 2014 are constant, which is implemented when extending the two STRIs down to the year 2005 when the panel data start. After that an average across all the transport and logistic services by each country-year is taken. Then, because the STRI ranges between 0 and 1, with increased values indicating higher levels of restrictiveness, the threshold that indicates a high level of restrictiveness is being applied at a value higher than 0.49 – in line with the 49 using the World Bank STRI. In the next step, the digital and non-digital STRIs are multiplied with the first digital-intensity (similar to column 3 in Table 1) and the corresponding non-digital intensity specification for transport services, respectively, to obtain the interaction term.
The results of the regressions using these OECD STRI-based interaction terms remain unchanged, except for the second digital-intensity specification when trade in financial services is included. The coefficient results on both control variables come out as insignificant this time (results can be obtained upon request).
4.2 Results by Year
A legitimate question is however whether the GFC truly caused a take-off in trade for digital services compared to other non-digital sectors. On the one hand, as discussed above, there is literature that indicates that the crisis-resilience of services during 2008–2009 was in large part due to their digital nature, which enabled firms to continue outsourcing these services with the use of software. The crisis could therefore have intensified the development of digital technologies and increased trade in services that were able to become digitalized and deliver across borders. On the other hand, digital technologies are often not unique to a specific crisis or any other period, as their development is a continuous process, and the process of digital innovations typically takes time. In that scenario, one would expect the growth of digital and other digitalized services trade to set off before 2009.
In order to assess exactly around which year trade in digital services started to grow faster than that of other sectors, we regress the baseline specification with an extension to take stock of the yearly effect.
 $$ln( {{\rm SX}} ) _{cst} = {\it \Phi} + \sum\limits_{Q = 2005}^{2018} {\theta _{ct}{\rm D}_{st}\cdot {\rm \;Digital}\,{\rm intense} \ge 2009{\rm \ast }T + \delta _{cs} + \gamma _{ct} + \varepsilon _{cst}} $$
In equation (2), we regress the dummies for software-intense sectors with a dummy that signify every year T in our dataset. We do this except for the first year 2005 so as to have a starting point and to avoid multicollinearity in the data due to the inclusion of the fixed effects. The coefficient of interest is the θ t term that measures the yearly trade effect between 2006 and 2015/18. The term captures the year-by-year basis as to whether trade in digital services was positively different in regard to other non-digital sectors compared to 2005. If the coefficient results are positively significant as of the year 2009 and/or after, it implies that digital services trade expanded more post-GFC compared to non-digital services. In the event, we find positive and significant coefficients before 2009, it would suggest that the increase of digital trade compared to other sectors is indistinguishable between the two periods.
The results of the yearly effects using data from the WTO-UNCTAD-ITC can be found in Table 7.Footnote 11 The results in columns 1–5 follow the same order as in the previous tables. The results in column 1 suggest that the narrow definition of digital-intense services have a significant result as of 2009, not before. Moreover, its coefficient sizes grow in importance across years indicating that the gap between trade in digital and non-digital services increased over time. When expanding the list of digital sectors in columns 3–5, similarly positive and significant results are found after 2008. Again, in both columns the increase in digital services increases over time. No significant results are found in column 2, however, when only adding financial services to the list of digital-intense sectors. The insignificant findings when adding these services is consistent with the weak results reported in Table 3. Figure 3 presents the trade difference in percentage terms for all years and the assessed categories of digital services.

Figure 3. Trade difference using WTO-UNCTAD-ITC dataset by year
Note: Results correspond to the coefficient estimates shown in Table 7.
Table 7. Baseline regression results using WTO-UNCTAD-ITC dataset by year

Note: *p < 0.10; **p < 0.05; ***p < 0.01. P-values are given in parenthesis. The dependent variable the log of services exports ln(SX) using data from the WTO-UNCTAD-ITC BPM6 database. Fixed effects are applied at the country-sector and year level. Period of regressions is 2005–2018. Regressions are estimated with robust standard error clustered by country–sector–year. Column titles correspond to the sector specification as presented in Table 1.
The results using the OECD TiVA data are reported in Table 8. Overall, most significant coefficients results are also found after the GFC, but some differences appear compared to Table 7. First, for the narrow definition of digital trade in column 1, significant results are only found as of 2014. Second, in all digital sector categories significant coefficients are reported. Moreover, the shift of digital services growth seems to have taken place already somewhat before 2009 as significant results are also found before this year, in particular in columns 3 and 4. When adding the full list of digital-intense sectors in column 5, this result becomes significant again as of 2009. In short, the year-on-year result from the regressions suggest that digital services trade had started to grow faster compared to other services already somewhat before the GFC of 2008, namely in the year 2007 and 2008.
Figure 4 graphically illustrates the trade difference in percentage terms. The graph shows that out of the five definitions of software-intense services, two definitions show a higher trade impact that lies within a range of 5–10%. Besides, as we move further away from the year 2009 in time, this trade difference tends to become more substantial, albeit with a time lag. The figure shows that especially from 2012 onwards, the level of trade in digital services grew more pronounced compared to other services.Footnote 12 Given that our preferred list of digital-intense services is captured in column 3, the results therefore need to be compared with the results in column 4 of Table 7. This time too, the two coefficient sizes are remarkably similar, ranging between 0.14 and 0.15 between 2015 and 2017 across the two tables, which comes down to a trade difference in favor of digital services of around 15–16%.

Figure 4. Trade difference using TiVA dataset by year
Note: Results correspond to the coefficient estimates reported in Table 8.
Table 8. Baseline regression results using TiVA dataset by year

Note: *p < 0.10; **p < 0.05; ***p < 0.01. P-values are given in parenthesis. The dependent variable the log of services exports ln(SX) using data from the OECD TiVA database. Fixed effects are applied at the country-sector and year level. Period of regressions is 2005–2015. Regressions are estimated with robust standard error clustered by country–sector–year. Column titles correspond to the sector specification as presented in Table 2.
4.3 Extended Baseline Results
We also extend the analysis following Freund et al. (Reference Freund, Mulabdic and Ruta2019) to include country characteristics in the baseline DID specification with the aim of finding out what type of countries have benefited from the growth of digital services trade post the GFC.
The way in which this is done is to interact a vector called C that consists of variables measuring the economic country characteristics. This vector is then interacted with the difference-in-difference dummy that signifies the group of digital sectors from 2009 onwards. In more formal terms, we augment the baseline specification as follows:
 $$ln( {{\rm SX}} ) _{cst} = {\it \Phi} + \sum\limits_{Q = 1}^4 {\theta _{ct}{\rm D}_{st}\cdot {\rm \;Digital}\,{\rm intense} \ge 2009{\rm \ast }C + \delta _{cs} + \gamma _{ct} + \mu _q + \varepsilon _{cst}} $$
As indicated in equation (3), we split up our country variables into quartile groups in which the Q1 and Q2 are the two groups that performs above the group median, whereas Q3 and Q4 are the two groups below the median. We apply this quartile groups in most cases, except when groups are already predefined by a database. Note that these country groups are denoted with θ ct and in large part vary by country-time, except when specifically indicated. In all country clusters, whether they are measured in quartiles or pre-determined for several occasions, we apply group fixed effects respectively as represented by μ q in equation (3). All other terms in the equation remain unchanged and follow the baseline specification. In similar manner as before, we report results in sequential order by progressively adding digital services corresponding to Table 2.
The country-specific economic variables which are measured in vector C in equation (3) should be guided by the existing theoretical and empirical literature. For starters, the vector first uses the World Bank income group classification. The main reason is that early literature stated that services specialization could be linked as a factor for economic growth (Clark, Reference Clark1941; Hill, Reference Hill1977; Kravis et al., Reference Kravis, Heston, Summers, Gerard Adams and Hickman1983; Hoekman and Matoo, Reference Hoekman and Mattoo2008). Moreover, dozens of empirical examples illustrate that even though some parts of services trade may be catered towards more developed economies, such as knowledge-intensive services, it does not preclude less developed countries from also specializing in services. Even less developed countries such as India and Malaysia are great exporters of digital services nowadays. The inclusion of income groups for the expanded regressions is therefore straightforward. For similar reasons, if a country has a comparative advantage in services, it is also included in the vector as a second country-specific economic variable.
The recent empirical literature has clearly made a link between the expansion of services trade and internet infrastructure. For instance, the work by Freund and Weinhold (Reference Freund and Weinhold2002) showed that for the US the growth of trade in services is clearly associated with levels of internet penetration, which is measured as the number of internet hosts. The relationship is particularly strong for their definition of business, professional, and technical services (which exclude telecommunications, education, and financial services). Many of the sub-sectors in this category of services are consistent with our selection of digital-intense services. Moreover, recent work has also shown that internet connectivity is an important driver for services trade such as information, finance, and business services (Haltenhof, Reference Haltenhof2019).
Further, two other country-wide variables are also included. One is skills. Given that on average services are estimated to be skill-intense following their greater extent of customization, higher levels of human capital are a critical factor in exporting services (Hoekman and Matoo, Reference Hoekman and Mattoo2008). Moreover, developed countries that have a high level of human capital exhibit high levels of export sophistication in services (Saez et al., Reference Sáez, Taglioni, van der Marel, Hollweg and Zavacka2014). For these reasons, the extended regressions also include a variable that measures a country's human capital into vector C.
Finally, the extent to which countries have high levels of employment in services is also relevant. The literature on structural change finds that many less developed economies have shifted employment more into services with productivity enhancing effects (McMillan, Rodrik, and Sepúlveda, Reference McMillan, Rodrik and Sepúlveda2017). Moreover, many of our selected digital-intense services have been found to have high levels of productivity across all high- and low-income countries (Nayyar et al., Reference Nayyar, Hallward-Driemeier and Davies2021). Therefore, countries with high services employment are more likely to have seen a high level of services trade expansion after the GFC as measured in the baseline regression.
All variables used and their summary statistics can be seen in Table A1 in Annex A. All output results for this section can be found online, but a summary table with the results for the preferred specification of digital-intense sectors (‘Digital+ Bus’) are reported in Table 9. These results are discussed in more detail below and can be obtained upon request
Table 9. Summary table reporting significant results from extended baseline regressions

4.3.1 Income Groups
We use the World Bank's classification of income groups in which the institution categorizes all countries’ economies around the globe into four income clusters, namely high (H), upper-middle (UM), lower-middle (LM), and low-income (L) countries. Assigning countries to each group is performed on a yearly basis and is done with the help of Gross National Income (GNI) per capita (in current USD) using the Atlas method. The list of countries belonging to an income group therefore differs per year. The four categories are used for our extended regressions. The results show that upper-middle income countries obtain a positive and highly significant coefficient result throughout all digital sector specifications. The list of countries falling in the middle-income group are for instance Argentina, Costa Rica, and Malaysia. The results for the preferred list of digital sectors, the coefficient result for the high-income group is only weakly significant. High-income groups include countries such as Hong-Kong, the UK, the USA, and Japan. In the two other country groups, no statistical significance is found. Note that the trade difference is economically more important for the middle-income group than for the high-income group. Upper middle-income countries experienced an increase in digital services trade that was 15% higher than non-digital sectors following the GFC, a more than threefold increase compared to high-income countries where this growth was only 3.25%.
4.3.2 Revealed Comparative Advantage
A country enjoys comparative advantage when it is relatively productive in exporting a particular good or service compared to all other industries and sectors. The trade literature has established a measure, called revealed comparative advantage (RCA) to measure this relative export productivity, originally developed by Balassa (Reference Balsassa1965). An RCA index with a value of 1 typically indicates that a country has a comparative advantage. We use this measure and divide the index across four groups: one group of countries called super RCA, have a value that is higher than 1 and above the median value that is created for all countries with an RCA higher than 1; a second group with an RCA higher than 1 but below this group median (called strong RCA); a third group with an RCA lower than 1 (indicating comparative disadvantage), but still having a value higher than the second group median that is created for all countries having a value lower than 1 (called median RCA); and finally a group of countries with a value lower than 1 and lower than this second group median (called weak RCA). Note that the RCA variables are defined by sector.
Results show that the group of countries with a strong RCA have a positive and significant coefficient result, whereas the group with a super RCA have only a weakly significant outcome. Moreover, in the preferred specification, the strong RCA group also shows a slightly greater economic impact. These are countries having a strong comparative advantage in IT-services such as Romania, Bulgaria, Luxembourg, Estonia, Argentina, and Morocco; or countries having a strong RCA in publishing and broadcasting such as Malaysia, Hong Kong, and Singapore. However, surprisingly the group of countries with an even greater trade impact are the ones with a weak comparative advantage in digital sectors. Depending on the specific digital sector, these are countries such as Vietnam, Colombia, and Brazil. They have a very low comparative advantage in digital sectors and yet appear to have seen one of the highest growth rates in digital-based services trade compared to non-digital sectors post-GFC.
4.3.3 Internet Usage
The availability and usage of a physical digital infrastructure is likely to be strongly associated with the extent to which countries have seen a high growth rate in digital services trade. This is something that is accounted for in the extended regressions by using the World Bank/ITU indicator of internet usage as a percentage of the population.Footnote 13
The results show that it is not necessarily countries with the highest levels of internet usage have seen a significant increase in digital services trade as they show a weak significance. Instead, the second category of strong internet users as well as the medium users show a significant coefficient result that is much stronger. This pattern is also reflected in the economic impact across the four groups. The highest users have only seen a modest growth in digital-intense services trade of around 4%, whereas the medium users almost saw double this rate. The group of medium users are for instance Saudi Arabia, Kazakhstan, Italy, Hungary, Russia, Malaysia, and Costa Rica. The fourth group with the weakest internet usage has seen a decline in digital services exports although this result is not precisely estimated. This group consist of, for example, China, Cambodia, and Turkey.
4.3.4 Employment
A structural indicator of economic characteristics is services employment. Moreover, advanced countries have an employment pattern in which the majority is found in services. The share of services employment tends to decline for countries further down the development ladder, where a larger share of the working population is still employed in manufacturing and agriculture. On average, in high-income countries 75% of the working population are employed in services, 46% in middle income countries, and 26% in low-income countries.
The results using services employment are significant for all but the third group of countries with medium levels of services employment. The results imply that the digital trade benefits as of 2009 have been spread across countries with different levels of services employment. In economic terms, the countries with the weak shares in services employment exhibit the highest digital trade increase compared to other sectors. Their trade effect is around 10%. This finding is consistent with the results from the RCA regressions. The other two groups of countries with high and super high services employment have an economic effect of around 6–7%.
4.3.5 Skills
We also include the extent to which countries have high levels of human capital. Even though this variable may be linked with levels of development, as measured by the income group classifications, it could point to a separate channel through which countries can high levels of services trade expansion. As said, in particular regarding digital-intense services as we classify them, some less developed countries such as Malaysia and India, but also Costa Rica and Romania, have been able over the years to trade digital-intense services to a great extent.
The results show that countries with the highest human capital do show positive and significant coefficient results, but stronger effects were found for the countries with a medium level of human capital. The countries classified with high levels of human capital have also experienced positive trade expansion, but not as strong as the medium group. The coefficient results for the medium group of countries has a positive trade effect of around 15%, whereas that of the two other country groups with high levels of human capital it is only of around 5%.
4.3.6 Imports
Finally, we also check whether countries have experienced a higher increase in digital trade with respect to imports compared to that of exports. We use similar baseline regression as for exports using the TiVA and WTO-UNCTAD-ICT data but now for imports as well, as both data sources report this type of flow. The results from the TiVA show that for all digital sector specifications the results are highly significant. The preferred specification implies a positive import effect post-GFC of around 11%. This percentage is much higher than the 6% found for exports in Table 4. When using trade data from WTO-UNCTAD-ITC, a similarly large coefficient result is found. The preferred sector specification using this data source generates a difference in services trade impact of 11.74%.
We also develop an extended baseline specification for imports for the four income groups. The results show that all levels of development have seen a significant change in digital services imports post-GFC compared to non-digital sectors. However, a sharp difference occurs between the first groups of high-income countries and upper-middle and lower-middle groups, all of which have seen a strong increase in digital services imports, compared to the group of low-income countries, which have experienced markedly lower growth in digital services imports compared with other non-digital services. This latter group of countries therefore saw a strong increase in imports in other types of services falling outside the realm of digital-intense sectors.
4.4 Mapping Countries
It would be instructive to understand which countries experienced significant trade increases in digital services after the 2008 GFC. In doing so, one could acquire improved insights into which countries are likely to experience a successful shift into digital services trade after the current crisis. One can perform this exercise by mapping and visualizing these countries’ relative position vis-à-vis another on the basis of the economic characteristics which have been used in the above analysis. This mapping is shown in Figures 5 and 6 for all countries.

Figure 5. Comparative advantage and Internet
We start by analyzing countries position with respect to their internet usage (as a share of the total population), which in Figure 5 is plotted on the horizontal axis. In the figure, each dot marks a country's position with the bubble size indicating the level of exports for the IT and information services sector. The reason for choosing this sector is because it forms the most straightforward example of digital services and the sector's activities are the basis of our selection of digital sectors as outlined in Table 2. Further, on the vertical axis the RCA indicator is plotted for the IT sector. The RCA variable is normalized following Laursen (Reference Laursen2015) to facilitate visualization. Then, the colors of each bubble specify the income group to which a country belongs. We take the year 2015 for which no low-income is found for our country sample.Footnote 14 Blue indicates high-income countries, red upper-middle income countries, and finally green lower-middle income countries.
The figure suggests there was an upward trend between a country's revealed comparative advantage in IT and information services and internet usage with India as a major exception. High-income countries are almost all placed on the right of the graph, whereas the middle-income countries on the left.
More interesting however is to zoom into the relative position of countries. Upper-middle income countries, countries with strong and weak RCAs, and with a medium to high internet usage showed a positive significant result. Countries that broadly fall into this overlapping categorization would be for instance Costa Rica, Romania, and Bulgaria being upper-middle income countries, and Israel, Ireland, and Spain being high-income countries. These countries have developed a relatively high comparative advantage with medium to strong internet usage.
Similarly, in Figure 6 all country variables are plotted in identical order, but internet usage is being replaced with skills – another economic characteristic used in the extended regressions. This indicator represents the extent to which countries can provide human capital. This time too, a notable upward trend between comparative advantage and human capital can be seen. Figure 6 shows the countries that fall into this group but also have a high comparative advantage in IT and information services, for instance, Switzerland, Spain, and Israel. Not far behind are Finland and Sweden. The results from the extended regressions showed that that the category of countries with medium human capital levels profited most from digital services exports after 2008 (i.e. the medium group).

Figure 6. Comparative advantage and human capital
More interesting, however, is that some countries that are classified as having medium human capital also show a strong comparative advantage. These are the countries that, according to the extended baseline regression have in particular seen high exports of digital services post-GFC. These are, for instance Morocco, the Philippines, and Costa Rica, but also Bulgaria and Argentina. Malaysia being an upper-middle income country also appeared to have benefitted from the move into digital services post-2008, although it has comparative advantage in telecommunications rather than IT-services.
5 Conclusion
This paper has put forward evidence that countries showed a distinctive shift in their trade patterns after the GFC of 2008 into digital-intense services. It is not clear however that it was the GFC itself that caused this shift. Using trade in services data from the WTO-UNCTAD-ITC, the results of this paper show that most countries started to ‘de-link’ their services trade patterns as of the year 2009 from the more traditional services sectors, which are classified as non-digital-intense, into digital-intense activities, such as computer, information, R&D. and financial services. However, using trade data from the OECD TiVA, our results also show signs that this shift into digital-intense services had already started somewhat before the GFC. At a minimum, this shift into digital-intense services therefore may have coincided with the GFC or may have amplified what was already going on.
What is important to understand however from these results is that a trend into digital-intense services had been going on much before the current Covid-19 financial crisis. Popular media report that this global crisis will markedly alter trade so that becomes even more digitally based. Although this might be true, the results of this paper suggest that the current crisis will just amplify what was already happening. Although this crisis differs from that of the GFC, it is a global demand and supply shock, which is likely to lead to an increase in the application of digital technologies for many services. However, it would be wrong to assume that the Covid shock is unique with regards to demand for an increase in digital-intense services trade. This paper shows that this trend was already more structural.
This paper also investigated the countries where this growing gap between digital and non-digital services became most pronounced. Interestingly the results show that the growth of digital-intense services compared to other sectors was strongest post-GFC for upper-middle income countries. This seems contradictory to the notion that digital trade successes are typically found in advanced countries. High-income countries show high growth in digital services post-GFC, but the global shift toward more digital-intense services trade is strongest for the less developed countries. One potential explanation is that digital trade is ushered by digital entrepreneurship that attracts many young people. Upper-middle income countries have an employment population that is relatively young whilst showing a high urbanization rate where external scale economies are usually high. Another explanation could be that this shift merely reflects greater outsourced services activities from rich to less developed countries over the years.
The analysis further reveals that in particular countries with high internet usage and with already a high comparative advantage in services have also seen a significant shift into digital services. Overall, these outcomes do not come as a surprise as internet usage and export productivity are strong predictors for trade in digital services. What is more surprising however is that countries with a medium level of human capital have also seen greatest growth in digital-intense services trade. This shows that any potential profit from future developments in digital services trade is again not restricted to developed economies. In fact, the continued digitalization of services and industries in developed countries would require an increased demand of digital-intense services for which medium skills activities are required that can be outsourced to countries with medium level of human capital.
This paper therefore gives interesting insights with respect to the aftermath of the current economic crisis due to Covid-19. With the collapse of many supply chains, the pandemic has ramped up the impetus for greater automation of not only manufacturing but also of services. The results suggest that after this crisis, a further shift away from traditional services into digital-based services is likely to continue, and that could provide opportunities for poorer countries too – they seem to have profited most from the digital services shift in the last 10 years. However, one worrying trend is the prospect for the poorest countries as they appear to have lost from this digital services trade increase.
Supplementary Materials
To view supplementary material for this article, please visit https://doi.org/10.1017/S1474745622000052.
Appendix
Table A1. Variables used and sources


