Introduction
Helminth communities of rodents have been studied mostly through short-term surveys usually limited to 1–3 years in duration, corresponding to typical PhD studentships and conventionally awarded research grants and are mostly based on destructive, cross-sectional sampling of host populations over these periods of time (Elton et al., Reference Elton, Ford, Baker and Gardiner1931; Lewis, Reference Lewis1968; Montgomery and Montgomery, Reference Montgomery and Montgomery1988; Behnke et al., Reference Behnke2001; Bajer et al., Reference Bajer2005; Jackson et al., Reference Jackson2014). Data from such studies are then used to test hypotheses, for example about the role of particular parasite species or even communities in host evolution, in modifying host life history parameters and affecting their immunological profiles (Barnard et al., Reference Barnard2002, Reference Barnard2003; Jackson et al., Reference Jackson2014; Babayan et al., Reference Babayan2018). Quantitative studies of rodent helminth communities spanning longer periods of time are rare in the literature but examples include the work of Kisielewska (Reference Kisielewska1970) in Poland, Haukisalmi et al. (Reference Haukisalmi, Henttonen and Tenora1988) in Finland, Tenora and Stanĕk (Reference Tenora and Stanĕk1995) in the Czech Republic and more recently Grzybek et al. (Reference Grzybek2015a) in Poland. Of these, only Haukisalmi et al. (Reference Haukisalmi, Henttonen and Tenora1988) and Grzybek et al. (Reference Grzybek2015a) subjected their data to rigorous statistical scrutiny; both studies concentrating on bank voles (Myodes glareolus). As far as we are aware, there are no long-term studies of other rodent helminth communities from other parts of the world, including Africa and the Middle East, that specifically address the issue of temporal changes in helminth communities over timespans of a decade or longer (but see Spickett et al., Reference Spickett2017).
In European rodents, relatively stable patterns of infection with dominant helminths have been reported through short-term monitoring (~3 years) of host populations (Montgomery and Montgomery, Reference Montgomery and Montgomery1990; Bajer et al., Reference Bajer2005) and gastro-intestinal parasite communities seem to remain relatively stable even in experiments in wild populations that have been manipulated by intervention with anthelmintics (Knowles et al., Reference Knowles2013). In contrast, rarer species, with a lower prevalence in the population, appear to fluctuate more unpredictably (Kisielewska, Reference Kisielewska1970; Montgomery and Montgomery, Reference Montgomery and Montgomery1990; Bajer et al., Reference Bajer2005). Nevertheless, derived measures of community structure such as diversity indices and species richness appear to be more influenced by minor fluctuations in the common species and these are primarily responsible for among-year variation in these parameters (Behnke et al., Reference Behnke2008). More marked dynamic changes in some measures of component and infracommunity structure, including cyclic changes over seasons and years, have also been recorded in particular helminth species (Tenora et al., Reference Tenora, Wiger and Barus1979; Haukisalmi et al., Reference Haukisalmi, Henttonen and Tenora1988; Montgomery and Montgomery, Reference Montgomery and Montgomery1990; Tenora and Stanĕk, Reference Tenora and Stanĕk1995; Behnke et al., Reference Behnke1999; Behnke et al., Reference Behnke2008).
Longer-term studies, lasting over ecologically and evolutionarily relevant periods of time, are important, in order to establish the robustness of some of the epidemiological trends that have been detected in particular host–parasite systems (e.g. relative temporal stability of prevalence and abundance of dominant helminth species, and dynamic changes in other species). Long-term studies allow documentation of system aspects that cannot be recorded over shorter periods of time, including the repeatability of trends and the extent to which they constitute typical features of these host–parasite systems (or perhaps represent unpredictable ephemeral events). By testing the robustness and repeatability of spatial trends in measures of helminth communities over time, their broader relevance and role in shaping parasite communities become apparent. Studies that last over a decade or longer might also allow cycles/fluctuations in helminth communities to be observed fully, and linked to host demographic changes over time (Tenora et al., Reference Tenora, Wiger and Barus1979), marked cycles in population density being one of the characteristic features of rodent populations (Elton, Reference Elton1924; Lambin et al., Reference Lambin, Petty and Mackinnon2000; Gouveia et al., Reference Gouveia2015). Unidirectional temporal trends in measures of parasite communities can also be related to gradual climatic and environmental changes, both of which are of current public concern (Hudson et al., Reference Hudson2006; Brooks and Hoberg, Reference Brooks and Hoberg2007; Houghton, Reference Houghton2009; Marohasy, Reference Marohasy2017). Duly processed empirical data derived from long-term monitoring, can inform computer models used to make predictions within scrutinized systems (e.g. the growing interest in spatial epidemiology; Eisen and Wright, Reference Eisen and Wright2001; Ostfeld et al., Reference Ostfeld, Glass and Keesing2005), but also in the wider frame for human health and livestock agriculture arising from, for example, the consequences of climate change, alterations in landscape structure and environmental fragmentation from increasing urbanization (Zell, Reference Zell2004; Ostfeld et al., Reference Ostfeld, Glass and Keesing2005; Bradley and Altizer, Reference Bradley and Altizer2006; Morgan and Wall, Reference Morgan and Wall2009; Huntley et al., Reference Huntley2014). Monitoring longer-term temporal trends is therefore important.
Building on our previously published long-term series of surveys of helminths of bank voles in Poland (Behnke et al., Reference Behnke2008; Grzybek et al., Reference Grzybek2015a), we report here a parallel study on four successive cross-sectional surveys of the helminth parasites of spiny mice conducted over a 12-year period (2000, 2004, 2008 and 2012) in the arid wadis that transect the mountains located in the South Sinai Peninsula of Egypt. The helminth communities of spiny mice in this geographical location are relatively depauperate in terms of component community species richness (Greenberg, Reference Greenberg1969; Wertheim and Greenberg, Reference Wertheim and Greenberg1970; Behnke et al., Reference Behnke2000, Reference Behnke2004; Barnard et al., Reference Barnard2003) compared with hosts living in some other regions of the world (Brouat et al., Reference Brouat2007; Spickett et al., Reference Spickett2017). In this respect, they bear much similarity to those of bank voles in Europe and therefore constitute an ideal system through which to examine the generality of some of the conclusions from work on European rodents, this time in an ecologically contrasting environmental system typified primarily by aridity and intense summer temperatures. The work was conducted in the same four sites at the same time of year on each occasion in order to assess the relative importance of temporal vs spatial factors, and their interaction, in affecting the structure of helminth infracommunities in spiny mice in this region of the Middle East.
Materials and methods
Study sites
The local environment in this part of Egypt has been described by Hobbs (Reference Hobbs1995) and Zalat and Gilbert (Reference Zalat and Gilbert1998). The study sites utilized in the current work have been described comprehensively in our earlier papers (Behnke et al., Reference Behnke2000, Reference Behnke2004) and subtle differences in aspects of their ecology have been documented (Gilbert et al., Reference Gilbert1996; Zalat et al., Reference Zalat2001). They are located in the mountains of the South Sinai, two within the vicinity of the town of St. Katherine, bordering on the town periphery (Wadis El Arbaein and Tlah), and two somewhat further afield (Wadis Gebal and Gharaba), but all within 15 km of the town centre (see Behnke et al., Reference Behnke2004, for GPS data, full descriptions of each site and a map showing their precise locations in relation to each other and the town of St. Katherine). These sites are separated from one another by the town of St. Katherine and also by high ridges and therefore we consider them to be isolated from one another in ecological time, although the host species is panmictic and genetic studies have revealed some gene flow among the four populations (Alfudhala, Reference Alfudhala2015). The sites were sampled at the same time of year in each year of the study (last 2 weeks of August and the first 2 weeks of September).
Terminology and collection of spiny mice
In this paper, we refer to Acomys dimidiatus (Cretzschmar, 1826) for eastern spiny mice from this region of Egypt following Cassola (Reference Cassola2016a) and not A. cahirinus (Geoffroy, 1803) (Cairo spiny mouse; Cassola, Reference Cassola2016b) as in some earlier studies from the region (Myers, Reference Myers1961; Ward and Nelson, Reference Ward and Nelson1967; Greenberg, Reference Greenberg1969), since the latter species is now known to occur across North Africa, rather than on the northeastern side of the Suez Canal. The methods used for trapping rodents, and for sampling and processing trapped animals have all been fully described previously (Behnke et al., Reference Behnke2004). Age categories were established as described earlier using principal components analysis of a range of morphological measures including body weight and dried eye lens weight (Behnke et al., Reference Behnke2004) and two age classes were established. Age class 1 mice were immature juveniles, while age class 2 mice were all young and breeding adults.
Identification and quantification of endoparasites
The entire alimentary tracts were brought back to the University of Nottingham in either 70% ethanol (2012) or in 10% formalin (2000, 2004 and 2008) for dissection. The fixed intestines were opened carefully in water or Hanks’ saline and examined under a dissecting microscope. All parasite specimens were identified with the help of relevant literature on rodent helminths from the region (Myers, Reference Myers1954, Reference Myers1961; Quentin, Reference Quentin1966; Ward and Nelson, Reference Ward and Nelson1967; Greenberg, Reference Greenberg1969; Chabaud, Reference Chabaud, Anderson, Chabaud and Willmott1975; Quentin and Wertheim, Reference Quentin and Wertheim1975; Ashour and Lewis, Reference Ashour and Lewis1982; Lewis and Ashour, Reference Lewis and Ashour1983; Wertheim, Reference Wertheim1993), sexed and stored in tubes containing 70% ethanol. Tapeworms were stained using borax carmine, dehydrated in ethanol and mounted in Canada Balsam for microscopical examination.
Statistical analysis
Prevalence values (percentage of animals infected, based on presence/absence of parasites and hence binomially distributed data) are given with 95% confidence limits [CL95, in square brackets in the text], calculated by bespoke software based on the tables of Rohlf and Sokal (Reference Rohlf and Sokal1995). The abundance of infection (including both infected and non-infected animals) is summarized by arithmetic means and standard errors of the mean (s.e.m.).
The degree of aggregation in the data was calculated by the index of discrepancy (D) as described by Poulin (Reference Poulin1993) and the index of dispersion (I, variance to mean ratio). Frequency distributions of raw values from individual taxa were tested for goodness of fit to Gaussian, negative binomial, positive binomial and Poisson models by χ 2 as described by Elliott (Reference Elliott1977) and the negative binomial exponent k is given as appropriate (for brevity we do not report the values here but see supplementary materials, Table 1). The acceptability of parametric models was evaluated through the goodness of fit of residuals from minimum sufficient general or generalized linear models (GLMs) to the distributions listed above, through Q–Q plots and through estimation of the total deviance accounted for.
The statistical approach adopted has been documented comprehensively in our earlier publications (Behnke et al., Reference Behnke2004, Reference Behnke2008; Bajer et al., Reference Bajer2005). For analysis of prevalence, we used maximum-likelihood techniques based on log-linear analysis of contingency tables in the software package IBM SPSS Statistics Version 22 (IBM Corporation). This approach is based on categorical values of the factors of interest, which are used to fit hierarchical log-linear models to multidimensional cross-tabulations using an iterative proportional-fitting algorithm that detects associations among the factors, one of which may be the presence/absence of infection. Initially, full factorial models were fitted, incorporating as factors SEX (two levels, males and females), AGE (two levels, immature and mature animals), YEAR of study (four levels, 2000, 2004, 2008, 2012) and SITE (four levels, Wadis El Arbaein, Gebal, Gharaba and Tlah). The presence or absence of parasites (INFECTION) was considered as a binary factor. All these five factors were fitted initially to all models that were evaluated. For each level of analysis, beginning with the most complex model involving all possible main effects and interactions, those combinations that did not contribute significantly to explaining variation (α = 0.05) were eliminated stepwise beginning with the highest level interaction (backward selection procedure). A minimum sufficient model (MSM) was then obtained, for which the likelihood ratio (LR) of χ 2 was not significant, indicating that the removal of all remaining parameters would significantly reduce the fit of the model. The importance of each term in interactions involving INFECTION in the final model was assessed by the probability that its exclusion would alter the model significantly and these values are given in the text, assessed by LR test between nested models with and without each factor of interest. The remaining terms in the final model that did not include INFECTION [for example, variation among sites in the number of animals of each sex sampled (SITE × SEX)] are not given but can be made available from the authors on request. For each taxon, in turn, we also fit models with each factor alone plus INFECTION.
For analyses of quantitative data conforming to Gaussian distributions, we used GLMs with normal errors implemented in R version 2.2.1 (R Core Development Team) and the residuals were checked for the approximate goodness of fit to the Gaussian distribution. When the residuals failed to meet the requirements of Gaussian models we used generalized linear models with negative binomial or Poisson error structures. Full factorial models that converged satisfactorily were simplified using the STEP procedure and tested for significance using deletion of terms beginning with the highest order interaction by comparing models with or without that interaction, then models based on main effects plus two- and three-way interaction by deletion of three-way interactions in turn, and so on until each main effect was evaluated in a model that only comprised all main effects. Changes in deviance (DEV) are given for models based on Poisson errors (interpreted by χ 2), for models based on Gaussian errors we give F and for those based on negative binomial errors the LR. MSMs were then fitted (all significant interactions and main effects, plus any main effects that featured in interactions) and the process was repeated to obtain values for changes in deviance, test statistics and probabilities. The percentage of deviance accounted for by each significant main effect or interaction was calculated as recommended by Xu (Reference Xu2003) and reported earlier by Behnke et al. (Reference Behnke2008) and more recently by Grzybek et al. (Reference Grzybek2015a).
Throughout the analyses, our primary focus was on the temporal and spatial effects on parasites communities as reflected in YEAR (reflecting overall change with time), location in which the animals were sampled (SITE) and the interaction between these (YEAR × SITE on INFECTION or on abundance of worms), the latter in particular indicating whether the prevalence or abundance of specific taxa showed a consistent hierarchical relationship across sites over time (rank order remained the same), or fluctuated with/without direction. For this reason, we also present values for some non-significant outcomes of model parameters as these underscore the robustness of stability among sites.
If the data did not meet the assumptions of parametric tests, we employed non-parametric tests in IBM-SPSS 22 (Kruskal–Wallis test for k levels in a specified factor (SITE and YEAR) and the Mann–Whitney U-test where factors only had two levels, e.g. SEX and AGE) and in these cases interactions could not be tested.
We used canonical discriminant function analysis (CDFA) in IBM-SPSS as an additional approach to evaluating the relative importance of the influence of site of capture and year of survey on parasite burdens. Quantitative parasite data for each of 15 species of helminths were first standardized by loge(x + 1) transformation of individual worm burdens for each species, then subtraction of mean loge value for each species and division by the standard deviation before analysis. After fitting in CDFA, of the 15 resulting canonical discriminant functions, functions 1 and 2, which accounted for most of the variation in data (see the ‘Results’ below), were plotted against one another.
Results
Numbers of mice caught, trapping effort and numbers autopsied
Table 1 summarizes the trapping effort and resulting success rates by site and year of study. The total number of individual mice was 857 and although there was some variation in trapping effort among surveys and sites depending on local and year-specific constraints, the only significant effect (Kruskal–Wallis test with either YEAR or SITE as the explanatory factor on each of the variables in Table 1) was that of YEAR, reflecting increasing numbers of trap hours over successive surveys (χ 23 = 11.5, P = 0.009).
Table 1. Number of spiny mice caught, trapping effort and success by site and year of survey

Summary values for data-subsets are given in bold.
a Trap success is the percentage of traps that were occupied by rodents after overnight deployment in the field.
Of the total number of A. dimidiatus caught, we autopsied 431 animals (50.3% of caught spiny mice). This total represented 37.3% of all captures [857 spiny mice plus 300 other rodents (78 A. russatus, 117 Dipodillus dasyurus, 11 Meriones spp., 67 Sekeetamys calurus, three Gerbillus spp., 19 Mus musculus and five Eliomys melanurus)], in accordance with our licence from the St. Katherine Protectorate to cull fewer than 40% of captures. The distribution of A. dimidiatus by year, site, sex and age is shown in Table 2. Inevitably, there was significant variation in the numbers taken for autopsy among years of survey (χ 23 = 28.4, P < 0.001), among the four sites (χ 23 = 13.4, P = 0.004) and between the two age classes (χ 21 = 32.2, P < 0.001) but not between the sexes and there were no significant interactions between these factors. These differences are taken into account in the analyses that follow.
Table 2. Number of spiny mice autopsied in successive surveys, by site, host age and sex
Summary values for data-subsets are given in bold.
Prevalence and abundance of combined helminths
The overall prevalence of helminths (all species combined) across the whole period was 91.2% [86.77–94.21]. Prevalence values were generally high throughout (Table 3 and Fig. 1A), but nevertheless varied significantly among the wadis (SITE × INFECTION χ 23 = 17.9, P < 0.001; Table 3), with the highest values recorded among spiny mice from Wadis Gharaba and Tlah. The YEAR × SITE × INFECTION interaction term was not significant (χ 29 = 12.6, P = 0.18) suggesting that site differences in prevalence were stable through time and overall there was no significant change in prevalence of helminths over time (YEAR × INFECTION χ 23 = 3.0, P = 0.4). Figure 1A shows that the relatively high prevalence among mice from Wadi Tlah was evident in all four surveys and those from Wadi Gharaba likewise, but with only one exception in 2008, when prevalence values for mice from this wadi and those from Wadis El Arbaein and Gebal were all identical (90.0%). Prevalence did not vary significantly between the two sexes (Table 3), but there was a significant difference in prevalence between the two age classes (AGE × INFECTION χ 21 = 7.94, P = 0.005; Table 3) values being higher among the older mice (8.2% higher). There were no significant interactions between any of the explanatory factors.
Fig. 1. Spatiotemporal dynamics in prevalence at the four study sites (A, C and E) and abundance (B, D and F) of all helminths (A and B), all nematodes (C and D) and of all cestodes (E and F). Key to symbols used in (B)–(F), as in (A).
Table 3. Prevalence (±95% confidence limits) of higher taxa – all helminths combined, all nematodes combined and all cestodes combined by year, site, host sex and age class

See the text for detailed statistical analysis. Here all significant main effects are in bold.
The overall abundance of helminths (all species combined) was 37.5 ± 7.17 worms per mouse. All four main effects were highly significant (Table 4; for YEAR LR 3,422 = 15.7, P = 0.0013, highest in 2004; for SITE LR 3,422 = 48.7, P < 0.00001, highest in Wadi Tlah; for SEX LR 1,422 = 23.9, P < 0.00001, higher in female mice; for AGE LR 1,422 = 34.5, P < 0.00001, higher in older mice) but of these, SITE was the most important in explaining deviance in the MSM (Table 5). However, there was also a highly significant two-way interaction (SITE × YEAR, LR 9,410 = 41.8, P < 0.00001) which is illustrated in Fig. 1B and which was of secondary importance in explaining deviance, and YEAR even less so (Table 5). As can be seen, abundance of helminths was relatively steady across the period in three wadis, with highest mean abundance in Wadi Gharaba, then El Arbaein and lowest in Wadi Gebal, and there was no overlap during the period for mean abundance values from spiny mice from these three wadis, their relative rank order remaining the same at each survey. The interaction was attributable to the variable worm burdens among mice from Wadi Tlah, which in 3 years ranked among the typical values derived from mice from the other three wadis, but showed a huge peak in 2004, more than three times higher than the highest mean worm burden recorded from mice elsewhere. Figure 2A also shows that that while in Wadis El Arbaein, Gharaba and Tlah, the abundance of helminths was higher in female mice, this was not the case for mice from Wadi Gebal, where male and female mice essentially harboured comparable but low worm burdens (SITE × SEX, LR 3,410 = 7.62, P = 0.054).
Fig. 2. Host sex, age, year and site-related changes in abundance of helminth taxa. Combined helminths by site of study and sex (A); combined spiruroid nematodes by host age and sex (B); combined spiruroid nematodes by site, year and age class (C); Protospirura muricola by site, year and age class (D).
Table 4. Helminth species richness, diversity and abundance of higher taxa (mean ± standard error) – all helminths combined, all nematodes combined and all cestodes combined by year, site, host sex and age class
See the text for detailed statistical analysis. Here all significant main effects are in bold.
Table 5. Percentage of variation in data (deviance) explained by extrinsic and intrinsic factors affecting measures of infracommunity structure and diversity, and abundance of helminths
(In each case the output from the most parsimonious and appropriate minimum sufficient model is given. Thus, the significant main effects and interactions have been highlighted in bold. Non-significant main effects if components of one of the interactions or interactions showing borderline significance have also been included but are not in bold. Models for total helminth burden and individual species are models with negative binomial error structures unless stated otherwise below. For further details of the statistical models, see the text. Note that some main effects, two-way and three-way interactions and the four-way interaction are not given because these were not significant.)
a Mean species richness (model based on Poisson errors).
b Brillouin's index of diversity (model based on Gaussian errors).
Species richness
The overall mean species richness (MSR) was 2.09 ± 0.063. Analysis by a model with Poisson errors showed that none of the possible interactions and only three of the main effects were significant (Table 4; for YEAR, DEV 3 = −12.01, P = 0.0074, highest value in 2004 and lowest in 2008; for SITE, DEV 3 = −12.84, P = 0.005, highest value for Wadi Tlah and lowest for Wadi El Arbaein). The temporal changes across surveys were mostly consistent and in the same direction in all four sites (Fig. 3A; for SITE × YEAR DEV 9 = 5.24, P = 0.8), except in Wadi Gebal between 2008 and 2012 when species richness fell across the period while showing stability or an increase in the other three sites. Of the three main effects, AGE accounted for the highest percentage of deviance in the MSM [Table 5; for AGE, DEV 1 = −29.97, P < 0.00001, higher among older mice (Table 4)].

Fig. 3. Spatiotemporal dynamics at the four study sites in helminth species richness (A), Brillouin's Index of Diversity (B) and abundance of combined spiruroid nematodes (C), Protospirura muricola (D), Mastophorus muris (E) and Streptopharagus spp. (F). Key to symbols used, as shown in (A).
Species diversity
The overall value of Brillouin's index of diversity (BID) was 0.31 ± 0.015. The two strongest effects on BID were the significant increase in its value with host age (Table 4; main effect of AGE, F 1,422 = 17.49, P < 0.0001) and the difference in value among surveys conducted in different years (Table 4; main effect of YEAR, F 3,422 = 7.35, P < 0.0001), this temporal change accounting for most of the deviance in the MSM as shown in Table 5 and thereby, indicating overall fluctuation with time. However, the rank order of the values of BID for sites was mostly consistent from year to year (no significant two-way interaction of SITE × YEAR), with the exception of mice from Wadi Gebal (Fig. 3B) which showed the greatest change in value and rank order. There were also significant but weaker effects of the study site (Tables 4 and 5; main effect of SITE, F 3,422 = 2.92, P = 0.034) and host sex (main effect of SEX, F 1,422 = 4.06, P = 0.044), but there were no significant interactions.
Frequency distributions and measures of aggregation
All parasite burdens were overdispersed (based on values of I and D) and conformed best to the negative binomial distribution. Indeed, some were so aggregated that even GLMs with negative binomial error structures failed to converge.
Prevalence and abundance of nematodes
Overall, 89.3% [84.70–92.79] of the spiny mice were infected with nematodes, and these were mostly from the two Orders Spirurida (Superfamily Spiruroidea) and Oxyurida (Superfamily Oxyuroidae). As with the prevalence of combined helminths, values for the prevalence of nematodes were consistently high throughout (exceeding 85% in all surveys, Table 3 and Fig. 1C). Analysis of this data subset generated much the same results as that of combined helminths because the helminth community was so dominated by nematodes (93.1% of all the recovered helminths were nematodes). Thus, prevalence values also varied significantly among mice from the different wadis (Table 3; SITE × INFECTION χ 23 = 25.2, P < 0.001), and the difference among the wadis was maintained over time (no significant YEAR × SITE × INFECTION interaction, χ 29 = 14.3, P = 0.11). There was no significant change in prevalence with time (YEAR × INFECTION χ 23 = 5.3, P = 0.15). Prevalence was almost identical in the two sexes (Table 3), but there was a significant difference in prevalence between the two age classes (AGE × INFECTION χ 21 = 8.6, P = 0.003; Table 3), with a higher prevalence among the older mice (an increase of 9.3%).
Abundance of nematodes (for all species combined the mean worm burden was 34.9 ± 7.12) was analysed as above for all helminths, with much the same outcome. In addition to the significant main effects of SITE (Table 4; LR 3,422 = 46.15, P < 0.00001) and YEAR (LR 3,422 = 15.78, P = 0.0013), which accounted for most deviance in the MSM (Table 5) and the interaction between these (Fig. 1D; LR 9,410 = 42.42, P < 0.00001), the main effects of AGE (Table 4; LR 1,422 = 28.7, P < 0.00001) and SEX (Table 4; LR 1,422 = 21.6, P < 0.00001) were also significant. There was also a borderline significant interaction between SEX and SITE (not illustrated; LR 3,410 = 7.67, P = 0.053), much as described above and illustrated in Fig. 2A for the abundance of helminths.
Spiruroid nematodes
Spiruroid nematodes accounted collectively for 33.7% of all nematodes that were recovered and had an overall prevalence of 69.6% [63.46–75.16]. Five species were identified and all five were stomach dwelling worms. Pterogodermatites witenbergi Quentin & Wertheim, Reference Quentin and Wertheim1975 was only found on one occasion in one mouse, a mature male mouse, captured in Wadi El Arbaein in 2004. Analysis of all five species combined showed that prevalence did not vary across years (Table 6; YEAR × INFECTION, χ 23 = 1.38, P = 0.7), but there was a highly significant effect of wadi (SITE × INFECTION, χ 23 = 34.4, P < 0.001), with a higher prevalence in the mice from Wadis Gharaba and Tlah, compared with El Arbaein and Gebal (Table 6). The overall temporal consistency of this difference among the wadis is evident through the lack of a significant SITE × YEAR × INFECTION interaction (χ 29 = 14.2, P = 0.12). Figure 4A shows that prevalence among mice from Wadi Gebal exceeded that of mice from Wadi Tlah on only one occasion (2008) but never that of mice from Wadi Gharaba. Prevalence did not vary between the sexes (SEX × INFECTION, χ 21 = 0.2, P = 0.65) but was significantly higher among the older age class (Table 6; AGE × INFECTION, χ 21 = 101.0, P < 0.001). Nevertheless, while always higher among the older mice, the difference in prevalence between the age classes varied in extent among sites and across years (YEAR × SITE × AGE × INFECTION, χ 29 = 24.2, P = 0.004, not illustrated).

Fig. 4. Variation in prevalence of spiruroid nematodes by year and study site. Combined spiruroid nematodes (A), Protospirura muricola and Mastophorus muris combined (B), P. muricola (C), M. muris (D), Streptopharagus spp. (E); Gongylonema aegypti (F). Key to symbols used in panel (A).
Table 6. Prevalence (±95% confidence limits) of spiruroid nematodes, individually and in specific combinations by year, site, host sex and age class
See the text for detailed statistical analysis. Here all significant main effects are in bold.
The mean abundance of combined spiruroid nematodes was 11.8 ± 1.15 and abundance was also stable across the years (Table 7; main effect of YEAR, LR 3,422 = 4.01, P = 0.26). However, there was a highly significant difference in mean worm burdens among sites (Table 7, main effect of SITE, LR 3,422 = 91.5, P < 0.00001, highest worm burdens in Wadi Gharaba). SITE accounted for most of the explained deviance in the MSM (Table 5) and overall the rank order of sites across surveys remained stable (Fig. 3C, for SITE × YEAR LR 9,400 = 9.70, P = 0.38). Worm burdens were greater in female (main effect of SEX, LR 1,422 = 13.3, P = 0.00026) and older mice (Table 7, the main effect of age, LR 1,422 = 69.9, P < 0.00001). There was also a significant three-way interaction (SITE × YEAR × AGE, LR 24,397 = 55.0, P = 0.0003) arising from the AGE effect varying in extent but not the direction in particular years in some sites as illustrated in Fig. 2C. A weaker two-way interaction (SEX × AGE, LR 1,421 = 4.71, P = 0.03) similarly reflected variation in the extent of the age effect, but in this case between male and female mice (Fig. 2B).
Table 7. Abundance (mean ± standard error) of spiruroid nematodes, individually and in specific combinations by year, site, sex and age class
See the text for detailed statistical analysis. Here all significant main effects are in bold.
Two of the lumen dwellers, Protospirura muricola and Mastophorus muris, accounted for 94.95% of all the spiruroids and since these two species are overtly very similar to one another in external morphology but quite different to the other three species, distinguishing between immature specimens was not possible in all cases. Therefore, we also analysed a taxon that included a combination of these two species, and as the data in Table 6 and Fig. 4B show, prevalence values for data subsets were much the same as when all spiruroids were pooled in one taxon, with only minor changes to their values. Log-linear analysis of prevalence also revealed the same outputs as those for all spiruroids collectively, again with only very minor changes to model parameters (not shown). Much the same turned out to be the case for analysis of abundance as Table 7 shows, with the outcome of the statistical analysis very similar to that for all spiruroid nematodes.
Protospirura muricola
The majority of spiruroids were identified as P. muricola (n = 4520 and 89.1% of all spiruroids). The overall prevalence of this species was 52.9% [46.50–59.31] and was very similar in each year of the study varying only between 47.8 and 55.7% (Table 6), and not surprisingly there was no significant difference across years and no SITE × YEAR × INFECTION interaction (Fig. 4C, χ 29 = 7.1, P = 0.6), indicating consistent and stable differences among the mice from different wadis over the four surveys. Prevalence was highest in Wadi Gharaba, and the species was virtually absent from Wadi Gebal, where only one mouse was found to carry this species in 2012, so there was a huge site effect (Table 6; SITE × INFECTION, χ 23 = 164.0, P < 0.001). Older mice were more likely to be infected (Table 6, AGE × INFECTION, χ 21 = 68.3, P < 0.001), and although prevalence was 7.6% higher among female mice, the difference between sexes was not significant (χ 21 = 2.4, P = 0.12).
The mean abundance of P. muricola was 10.5 ± 1.14 worms. Quantitative analysis also revealed a highly significant main effect of SITE (Table 7; LR 3,422 = 166.8, P < 0.00001), which accounted for most of the explained deviance in MSM (Table 5), but not of YEAR (LR 3,422 = 3.78, P = 0.29) and no SITE × YEAR interaction (Fig. 3D), indicating stability in the rank order of sites across years of survey. Worm burdens were highest in mice from Wadi Gharaba, substantially lower in Wadis El Arbaein and Tlah, and the species was rare in Wadi Gebal, where, as indicated above, only one mouse was found to be infected with P. muricola. As with prevalence, abundance of P. muricola was higher among female mice but in this case the difference between sexes was significant (Table 7; LR 1,422 = 12.6, P = 0.0004) and as expected abundance was much higher among the older mice (Table 7, main effect of AGE, LR 1,422 = 44.4, P < 0.00001). There was also a significant three-way interaction, illustrated in Fig. 2D, (SITE × YEAR × AGE, LR 24,395 = 47.9, P = 0.0026), showing that in wadis where P. muricola was abundant, older mice always had higher worm burdens than younger mice, but the relative difference in abundance between the age classes varied from year to year and from site to site.
Mastophorus muris
Mastophorus muris accounted for only 5.7% of the spiruroids, with an overall prevalence of 17.4% [12.97–22.82], and as Table 6 shows prevalence was highest among mice from Wadi Gebal, with much lower values for the other three wadis (SITE × INFECTION, χ 23 = 66.0, P < 0.001). Although overall prevalence of this species was stable across the four surveys, varying only between 14.1 and 20.7% (Table 6; YEAR × INFECTION, χ 23 = 2.18, P = 0.5), with consistent rank order of prevalence values across the four surveys (YEAR × SITE × INFECTION, χ 29 = 11.0, P = 0.3), Fig. 4D shows nevertheless that 2008 was a peak year in Wadi Gebal with 75.0% [52.55–89.59%] of mice from this wadi infected. Age also affected prevalence (Table 6; AGE × INFECTION, χ 21 = 34.1, P < 0.001), with a more than five times higher value among the older compared with younger mice, but the difference in prevalence between the sexes was not significant. The MSM also included two significant interactions, the first of which reflected that while prevalence was always higher among older mice, there was variation in the relative difference between younger and older mice in the four surveys (not illustrated; AGE × YEAR × INFECTION, χ 23 = 9.0, P = 0.029) and the second reflected the same effect but for SITE rather than year of survey (AGE × SITE × INFECTION, χ 23 = 8.99, P = 0.029).
The mean abundance of M. muris was relatively low at 0.68 ± 0.104, but as expected from the above analysis of prevalence, abundance also varied hugely among mice from different sites (Table 7; LR 3,422 = 60.6, P < 0.00001) and SITE accounted for most of the explained deviance (Table 5). This species was mostly encountered in mice from Wadi Gebal (67.4% of all worms of this species) where P. muricola was extremely rare. As with prevalence there was relative stability in abundance across years (Table 7; main effect of YEAR, LR 3,422 = 1.36, P = 0.72) and no significant YEAR × SITE interaction (Fig. 3E) and no difference in abundance between the sexes (Table 7, LR 1,422 = 0.12, P = 0.73). Most worms were recovered from the older age class of mice (Table 7, main effect of AGE LR 1,422 = 18.3, P < 0.0001), but the relative difference in abundance between the age classes, whilst always in the same direction, showed some variation across years (YEAR × AGE, LR 3,416 = 12.9, P = 0.0048), and among sites (SITE × AGE, LR 3,416 = 8.65, P = 0.034).
Streptopharagus spp.
The predominant species was S. greenbergi (Myers, Reference Myers1954) Wertheim, Reference Wertheim1993, although in our survey in 2000 we also recorded S. numidicus, so here we combine both species and refer to Streptopharagus spp. The overall prevalence was 20.4% [16.09–25.45], and nematodes of this genus accounted for 4.4% of all the spiruroids recovered. In contrast to P. muricola and M. muris, these spiruroids showed significant variation in prevalence across the surveys (Table 6; YEAR × INFECTION, χ 23 = 17.4, P = 0.001) but overall no significant difference in prevalence among the wadis (Table 6; SITE × INFECTION, χ 23 = 4.58, P = 0.2). Prevalence was higher in 2004 and 2012 than in the intervening years (Table 6). However, the data in Fig. 4E show that prevalence increased steadily across the whole period only among mice from Wadi Gharaba (0% in 2000, but up to 40.5% in 2012). Prevalence also rose sharply in 2012 among mice from Wadi Gebal, and varied more modestly among those from Wadis El Arbaein and Tlah, but overall there was no significant YEAR × SITE × INFECTION interaction, (χ 29 = 16.0, P = 0.067). There was no difference in prevalence between the sexes, but there was a significant age effect in the expected direction (Table 6; AGE × INFECTION, χ 21 = 22.2, P < 0.001).
The mean worm burden of Streptopharagus spp. was just 0.52 ± 0.105. Analysis of quantitative data by models with negative binomial errors and other models failed to converge satisfactorily or failed to give acceptable distributions of residuals, so we used non-parametric tests to assess the main effects. As with prevalence, there was a highly significant difference in abundance across the surveys (Table 7; Kruskal–Wallis test, effect of YEAR, χ 23 = 18.6, P < 0.001) with peak abundance in 2012. Despite the variation in mean abundance among mice from different wadis, the differences were not significant (effect of SITE, χ 23 = 5.5, P = 0.14). Abundance did not differ significantly between the sexes (Table 7), but the older mice carried heavier worm burdens compared with the younger individuals (Table 7; Mann–Whitney U test, z = 4.35, P < 0.001). Temporal changes in mean worm recovery for each site in turn are illustrated in Fig. 3F, where it can be seen that mean worm burdens rose steadily over successive surveys in mice from Wadi Gharaba, but showed lower and overlapping values for recovery from mice from the other three wadis.
Gongylonema aegypti
Gongylonema aegypti was a much rarer parasite to the above four species accounting for only 0.61% of the spiruroids recovered and with an overall prevalence of just 4.2% [2.18–7.53]. No worms of this species were recovered in 2000 and most (89%) in 2012, when the overall prevalence rose to 11.3% (Table 6; YEAR × INFECTION, χ 23 = 26.8, P < 0.001). Gongylonema aegypti was predominantly recovered from mice from Wadi Gharaba (67% of all worms recovered) and this site effect was significant (Table 6; SITE × INFECTION, χ 23 = 15.5, P = 0.001) but there was no SITE × YEAR × INFECTION interaction (χ 29 = 3.31, P = 0.95). As with the other spiruroids there was also an age effect (Table 6; AGE × INFECTION, χ 21 = 6.2, P = 0.013), but no difference between the sexes.
Too few animals were infected to permit analysis of abundance by GLM, but non-parametric tests showed that worm burdens differed across the years of survey (Table 7; Kruskal–Wallis test, χ 23 = 26.5, P < 0.001), with peak abundance in 2012, and heaviest mean worm burdens in mice from Wadi Gharaba (Table 7, for SITE χ 23 = 16.9, P = 0.001). Worm burdens did not differ significantly between the sexes (Table 7; Mann–Whitney U test, z = 0.61, P = 0.5) but were significantly higher among older mice (Table 7; Mann–Whitney U test, z = 2.27, P = 0.023).
Oxyuroid nematodes
The three species of oxyuroid nematodes collectively accounted for 63% of all the nematodes recovered, with an overall prevalence of 61.0% [54.63–67.01]. Prevalence varied across years of survey (Table 8; χ 23 = 14.7, P = 0.002), peaking in 2004, and among sites (χ 23 = 11.9, P = 0.008) with the highest prevalence among mice from Wadi Tlah, but there was no SITE × YEAR × INFECTION interaction (Fig. 5A; χ 29 = 11.0, P = 0.28). There was a significant difference between the age classes (χ 21 = 14.3, P < 0.001) but in contrast to the spiruroid nematodes, for the oxyuroid species prevalence was higher among the young mice (age class 1 in Table 8). Prevalence did not differ between the sexes.

Fig. 5. Variation in prevalence of oxyuroid nematode, cestode and acanthocephalan helminths by year and study site. Combined oxyuroid nematodes (A), Syphacia minuta (B), Aspiculuris africana (C), Dentostomella kuntzi (D), Rodentolepis negevi (E), Moniliformis acomysi (F). Key to symbols used in (A).
Table 8. Prevalence (± 95% confidence limits) of oxyuroid nematodes, cestodes and acanthocephala.

See the text for detailed statistical analysis. Here all significant main effects are in bold.
Mean abundance was 22.1 ± 6.98, and all the main effects significantly influenced abundance (Table 9). Abundance was highest in 2004 and lowest in 2000 (main effect of YEAR, LR 3,422 = 14.18, P = 0.0027), highest in mice from Wadi Tlah (main effect of SITE, LR 3,422 = 35.9, P = 0.00001), higher in female mice (main effect of SEX, LR 1,422 = 9.82, P = 0.0017) and in contrast to prevalence, higher in the older animals (main effect of AGE, LR 1,422 = 4.23, P = 0.04). Moreover, the difference in abundance among sites varied significantly across the four surveys (two-way interaction, YEAR × SITE, LR 9, 413 = 39.01, P < 0.0001) and this is illustrated in Fig. 6A. Abundance was generally low with overlapping values for mice from Wadis El Arbaein, Gebal and Gharaba across the period, varying from a mean abundance of 2.3 in mice from Wadi El Arbaein in 2000 to 14.8 in the same wadi in 2008, but as illustrated in Fig. 6A, there were two prominent peaks among mice from Wadi Tlah, one in 2004 and another in 2012.

Fig. 6. Variation in abundance of oxyuroid nematode, cestode and acanthocephalan helminths by year and study site. Combined oxyuroid nematodes (A), Syphacia minuta (B), Aspiculuris africana (C), Dentostomella kuntzi (D), Rodentolepis negevi (E), Moniliformis acomysi (F). Key to symbols used in (A).
Table 9. Abundance (mean ± standard error) of oxyuroid nematodes, cestodes and acanthocephalans by year, site, sex and age class

See the text for detailed statistical analysis. Here all significant main effects are in bold.
Syphacia minuta
The overall prevalence of S. minuta was 27.1% [21.81–33.26] and this varied significantly among mice from different wadis (SITE × INFECTION, χ 23 = 14.4, P = 0.002), with the highest prevalence recorded in mice from Wadi Gebal (Table 8). There was also a significant temporal variation (YEAR × INFECTION, χ 23 = 13.5, P = 0.004) with the highest value in 2004 (Table 8). However, the rank order of prevalence among mice from some wadis, but not all, changed across the years of the survey (YEAR × SITE × INFECTION, χ 29 = 21.6, P = 0.010) as illustrated in Fig. 5B. Prevalence among mice from Wadi Gebal was always higher than that among mice from Wadi El Arbaein, but more variable among mice from Wadis Gharaba and Tlah. The difference in prevalence values between the two sexes was not significant (Table 8) but prevalence was higher overall among older mice (χ 21 = 4.8, P = 0.028) although the extent of this age effect differed between the two sexes (Fig. 7A; SEX × AGE × INFECTION, χ 21 = 4.0, P = 0.046).
Fig. 7. Host age-related variation in prevalence and abundance of oxyuroid nematodes. Prevalence of S. minuta by host sex and age (A), prevalence of D. kuntzi by host sex and age (B), prevalence of D. kuntzi by study site and host age (C), abundance of D. kuntzi by study site and host age (D). Key to columns used in (A).
As Fig. 6B shows, the peaks of abundance of oxyuroid nematodes in 2004 and 2012 among mice from Wadi Tlah were largely attributable to unusually high mean worms burdens with S. minuta in those years. One mouse from Wadi Tlah harboured 2786 S. minuta in 2004 and in 2012 another mouse from the same wadi had 675 worms. Of the 11 heaviest worm burdens among the 117 mice from which we recovered S. minuta, nine were from mice from Wadi Tlah. With such extreme variation in worm burdens, values were clearly overdispersed (I = 1075, D = 0.93) and models with negative binomial and other error structures all failed to provide acceptable residuals, so further analysis was by non-parametric tests. These showed that there was significant overall variation across surveys (Kruskal–Wallis test, for effect of YEAR, χ 23 = 13.0, P = 0.005, Table 9), among the four sites (for effect of SITE, χ 23 = 14.9, P = 0.002, highest in Wadi Tlah) and between the age classes (Mann–Whitney U test, z = 2.04, P = 0.041, higher in older mice), but not between the two sexes.
Aspiculuris africana
Aspiculuris africana was recovered from 21.6% [16.70–27.24] of the mice and as with the other two oxyuroid nematodes, 2004 was a year of peak prevalence for this species also (Table 8). Prevalence varied significantly across the surveys (YEAR × INFECTION, χ 23 = 12.6, P = 0.006) and also among sites, with the highest value recorded among mice from Wadi Tlah and lowest among those from Wadi Gebal (Table 8; SITE × INFECTION, χ 23 = 18.1, P < 0.001). Despite variation across years, this difference in prevalence between mice from these two wadis was maintained across all four surveys (Fig. 5C). There was less temporal variation in prevalence among mice for the other two wadis, but their rank order varied more, nevertheless the YEAR × SITE × INFECTION interaction was just on the wrong side of the cut off for significance (χ 29 = 16.4, P = 0.059), suggesting some element of stability over the years. Prevalence was very similar in both sexes and only just higher among the younger mice (Table 8; χ 21 = 3.83, P = 0.05).
The mean worm burden for this species was 0.80 ± 0.124, and variation in worm burdens was far less extreme than that for S. minuta (I = 8.3, D = 0.89), but nevertheless still best described by the negative binomial model (goodness of fit, χ 26 = 4.8, P = 0.56). As with prevalence there was a significant effect of YEAR (LR 3 = 9.89, P = 0.020), a stronger effect of SITE (LR 3 = 19.27, P = 0.0002), and a weak interaction between these two main effects (Table 5; YEAR × SITE, LR 9 = 17.79, P = 0.038). Although this model reflected well the summary data in Table 9 and Fig. 6C, the residuals were not ideally distributed. However, a posteriori analysis using non-parametric tests confirmed the significance of these main effects (YEAR by Kruskal–Wallis test, χ 23 = 13.4, P = 0.004; SITE, χ 23 = 20.1, P < 0.001). Both approaches confirmed the significance of the age effect (LR 1 = 7.25, P = 0.007 and Mann–Whitney U test, z = 2.29, P = 0.022). There was no significant difference in abundance between the sexes.
Dentostomella kuntzi
Prevalence of D. kuntzi showed a contrasting distinct pattern. Overall prevalence was 40.1% [33.94–46.53] and did not differ significantly among mice from the four wadis (Table 8; SITE × INFECTION, χ 23 = 6.7, P = 0.082). Moreover, this similarity of prevalence among sites was maintained over time (Fig. 5D; YEAR × SITE × INFECTION, χ 29 = 4.83, P = 0.85). However, there was a significant overall change in prevalence with time (YEAR × INFECTION, χ 23 = 16.85, P = 0.001), and the data in Table 8 and Fig. 5D show that there was a consistent fall in prevalence among mice in all four wadis from peak values in 2004, through 2008 to 2012. As with A. africana, the prevalence of this species was significantly higher among younger mice (Table 8; AGE × INFECTION, χ 21 = 37.4, P < 0.001), but did not differ between the sexes (SEX × INFECTION, χ 21 = 0.19, P = 0.89). Moreover, whilst in the same direction, the extent of the age effect varied significantly between the two sexes (Fig. 7B; SEX × AGE × INFECTION, χ 21 = 7.94, P = 0.005) being more extensive among male mice. It also varied among mice from different sites, and whilst clearly apparent among those from Wadis El Arbaein, Gharaba and Tlah, there was no difference in prevalence between the two age classes among mice from Wadi Gebal (Fig. 7C; SITE × AGE × INFECTION, χ 23 = 13.4, P = 0.004).
The mean worm burden for D. kuntzi was 1.8 ± 0.18 and as with prevalence, abundance did not differ significantly among mice from different sites (Table 9), but there was a significant temporal change in abundance (main effect of YEAR, LR 3 = 10.15, P = 0.017) and the significant SITE × YEAR interaction (LR 9 = 18.91, P = 0.026) indicates that the rank order of abundance changed across years. Therefore, for this species there was a lack of temporal stability in abundance and the rank order of abundance among sites with time, and this is clearly shown in Fig. 6D. Abundance was higher among the younger mice overall (Table 9; for the main effect of AGE, LR 1 = 12.63, P = 0.0004) and in mice from three wadis, but as Fig. 7D shows not for those from Wadi Gebal (SITE × AGE, LR 3 = 8.76, P = 0.033). There was no difference in abundance between the sexes.
Other species of nematodes
In total, 451 nematode larvae were recovered, which could not be identified with any degree of certainty. These were included in analyses of higher taxa (combined helminths and combined nematodes) but not in other combinations. Of these 401 were recovered from 18 mice and found encysted in the lower intestinal walls, mostly in the colon (range = 1–171). These were most likely to be the same as recorded by Greenberg (Reference Greenberg1969) from A. dimidiatus (=cahirinus) from Israel and ascribed by him/her to the Spiruridae, but we could not be certain about our specimens. Seven worms were recovered from two mice from Wadi Gharaba, eight worms from one mouse from Wadi Gebal, 132 from eight mice from Wadi El Arbaein and 254 from seven mice from Wadi Tlah and mostly in 2004 (six mice) and 2008 (11 mice), with just one infected mouse in 2012. A further thirty unencysted larval nematodes from 18 mice could not be identified and one mouse from Wadi Gharaba harboured 20 encysted nematode larvae in its liver.
Prevalence and abundance of cestodes
Prevalence of cestodes (intestinal dwelling adults + larvae combined) was 16.5% [12.16–21.76] overall. As with combined helminths and combined nematodes, there was a highly significant difference in prevalence among mice from different wadis (SITE × INFECTION χ 23 = 23.8, P < 0.001; Table 3), but no significant change in prevalence with year of survey (YEAR × INFECTION χ 23 = 1.15, P = 0.76), nor was the YEAR × SITE × INFECTION interaction significant (χ 29 = 10.8, P = 0.29) and thus overall prevalence was relatively stable across the period (Fig. 1E). While prevalence in three wadis was essentially similar, that among mice from Wadi Gharaba was much lower, and consistently so. There was a significant difference in prevalence between the two age classes (AGE × INFECTION χ 21 = 20.7, P < 0.001; Table 3), with a 3.5-fold higher prevalence among the older mice and in contrast to nematodes, a strong effect of host sex (SEX × INFECTION, χ 21 = 11.0 P = 0.001; Table 3) with prevalence among female mice twice as high as that among males. There were no interactions between the explanatory factors.
Negative binomial models in R did not converge and hence analysis of abundance was carried out using non-parametric tests. Overall abundance was 1.68 ± 0.52 worms/mouse and abundance did not vary significantly across surveys (Table 4; Kruskal–Wallis test, χ 23 = 1.5, P = 0.68). Combined cestodes (adults and larval stages) were most abundant in spiny mice from Wadi Gharaba (Table 4; Kruskal–Wallis test, χ 23 = 17.12, P = 0.001). Abundance increased significantly with host age (Mann–Whitney U test, z = 4.32, P < 0.001) with much higher abundance among the older animals (Table 4), and it differed also significantly between the sexes (Mann–Whitney U test, z = 3.36, P = 0.001) with more than 2-fold higher abundance among female compared with male mice (Table 4).
Prevalence and abundance of adult cestodes
The intestinal-dwelling adult cestode community comprised four species (prevalence = 13.9% [9.96–18.89] and abundance = 1.68 ± 0.520) but was dominated by one, Rodentolepis negevi Greenberg, Reference Greenberg1969, which represented 74.7% of all the adult stage cestodes recovered and had an overall prevalence of 10.2% [6.85–14.74]. Rodentolepis fraterna comprised 3.4% of adult cestodes, Mathevotaenia rodentinum (Joyeux, Reference Joyeux1927) 16.3%, Witenbergitaenia sinaica Wertheim et al. (Reference Wertheim, Schmidt and Greenberg1986) 1.7% and we were not able to identify with certainty seven specimens (3.9%). The overall prevalence of M. rodentinum was 1.6% and that of the other taxa considerably lower, so these were not analysed quantitatively.
The 29 specimens of M. rodentinum were recovered from only seven mice, all from Wadi El Arbaein, five mice in 2012 and two in 2004. Five of these were females, one of which was a juvenile. Rodentolepis fraterna was recovered from five mice, four of which were from Wadi El Arbaein and in this case four were males and two juveniles. One female mouse from Wadi Gebal was infected with W. sinaica.
Rodentolepis negevi
Rodentolepis negevi was encountered predominantly in two of the four wadis (Table 8. Gebal and Tlah), but was not recovered from any of the mice sampled from Wadi Gharaba (Table 8; SITE × INFECTION, χ 23 = 31.9, P < 0.001). Prevalence increased significantly with time, from a low in the first two surveys until 2012 (YEAR × INFECTION, χ 23 = 9.09, P = 0.028) and this was evident in mice from all the three wadis in which this species occurred (Fig. 5E) and therefore consistent across the period (YEAR × SITE × INFECTION, χ 29 = 9.8, P = 0.37). Prevalence was higher in female (Table 8; SEX × INFECTION, χ 21 = 14.0, P < 0.001) and older mice (AGE × INFECTION, χ 21 = 15.6, P < 0.001).
Overall abundance was low (mean worm burden = 0.31 ± 0.073), overdispersed (I = 7.4; D = 0.95) and best accounted for by the negative binomial model (χ 23 = 3.3, P = 0.35), but with only 44 out of 431 mice infected, parametric models failed to converge satisfactorily, so we applied only non-parametric tests. As with prevalence, abundance increased with successive surveys although, in contrast to prevalence, there was a noticeable drop in abundance in 2012 (Table 9), and peak abundance in the three wadis where this species occurred was in 2008 (Fig. 6E; main effect of YEAR, Kruskal–Wallis test, χ 23 = 8.9, P = 0.030). Since the parasite was never found in mice from Wadi Gharaba, not surprisingly, the difference in abundance among wadis was highly significant (Kruskal–Wallis test, χ 23 = 21.8, P < 0.001). As with prevalence, abundance increased with host age (Table 9; Mann–Whitney U test, z = 3.6, P < 0.001) and was higher in female mice (z = 3.7, P < 0.001).
Prevalence and abundance of larval stages of cestodes
Larval cestodes were rare in these populations of spiny mice and were only recovered from 12 mice in total (2.8% [1.28–5.78]). Eleven of these mice were infected with a Mesocestoides sp. which we were unable to identify to species level. The average worm burden across all the sampled mice (abundance) was 1.26 ± 0.516, but among the infected animals (intensity) was 49 worms/mouse, ranging from eight to 173 worms. Mesocestoides sp. was recovered in 2000 (three mice, one from Wadi Tlah and two from El Arbaein), 2004 (four mice, two from Wadi Tlah and one each from Wadis Gebal and Gharaba) and 2008 (four mice, three from Wadi Gharaba and one from Wadi Gebal) but not in 2012. Additionally, one mouse from Wadi Tlah was infected with five larval stages of Joyeuxiella rossicum in 2000 which were recovered from the liver.
Prevalence and abundance of Acanthocephala
Moniliformis acomysi was the only acanthocephalan recovered from the spiny mice with a prevalence of 5.6% [3.26–9.25]. Prevalence was affected significantly by the wadi in which mice were captured (Table 8; SITE × INFECTION, χ 23 = 33.9, P < 0.001) but did not vary significantly across years, and there was no SITE ×YEAR × INFECTION interaction. Of the 24 mice that were infected with this species, 18 were from Wadi Gharaba, and none from Wadi Gebal. Prevalence did not vary between sexes or age classes of mice. Much the same outcome was found for analysis of quantitative data by non-parametric tests. The only significant effect was that of SITE (Kruskal–Wallis test, χ 23 = 34.2, P < 0.001), and as Table 9 shows abundance was clearly much higher among mice from Wadi Gharaba.
Sources of variation in abundance data
The data in Table 5 show the percentage of deviance accounted for by each of the specific factors and their interactions, as fitted in MSMs in GLMs. For three of the four individual species in this analysis (P. muricola, M. muris and A. africana), SITE was clearly the greatest source of deviance. For three higher order taxa SITE also proved to be the factor contributing most to explaining deviance in MSMs (Total helminths, total nematodes and combined spiruroids) and for the combined oxyuroid nematodes it was the interaction of SITE with YEAR (as explained above), but SITE also contributed a substantial proportion of the explained deviance for this taxon. For D. kuntzi AGE accounted for most of the explained deviance, and AGE together with interactions with AGE played an important role in explaining deviance in the case of P. muricola, M. muris, combined spiruroids and also helminth species richness. For just one measure, BID, YEAR was the main source of deviance and in this case AGE was second in importance.
Canonical discriminant function analysis
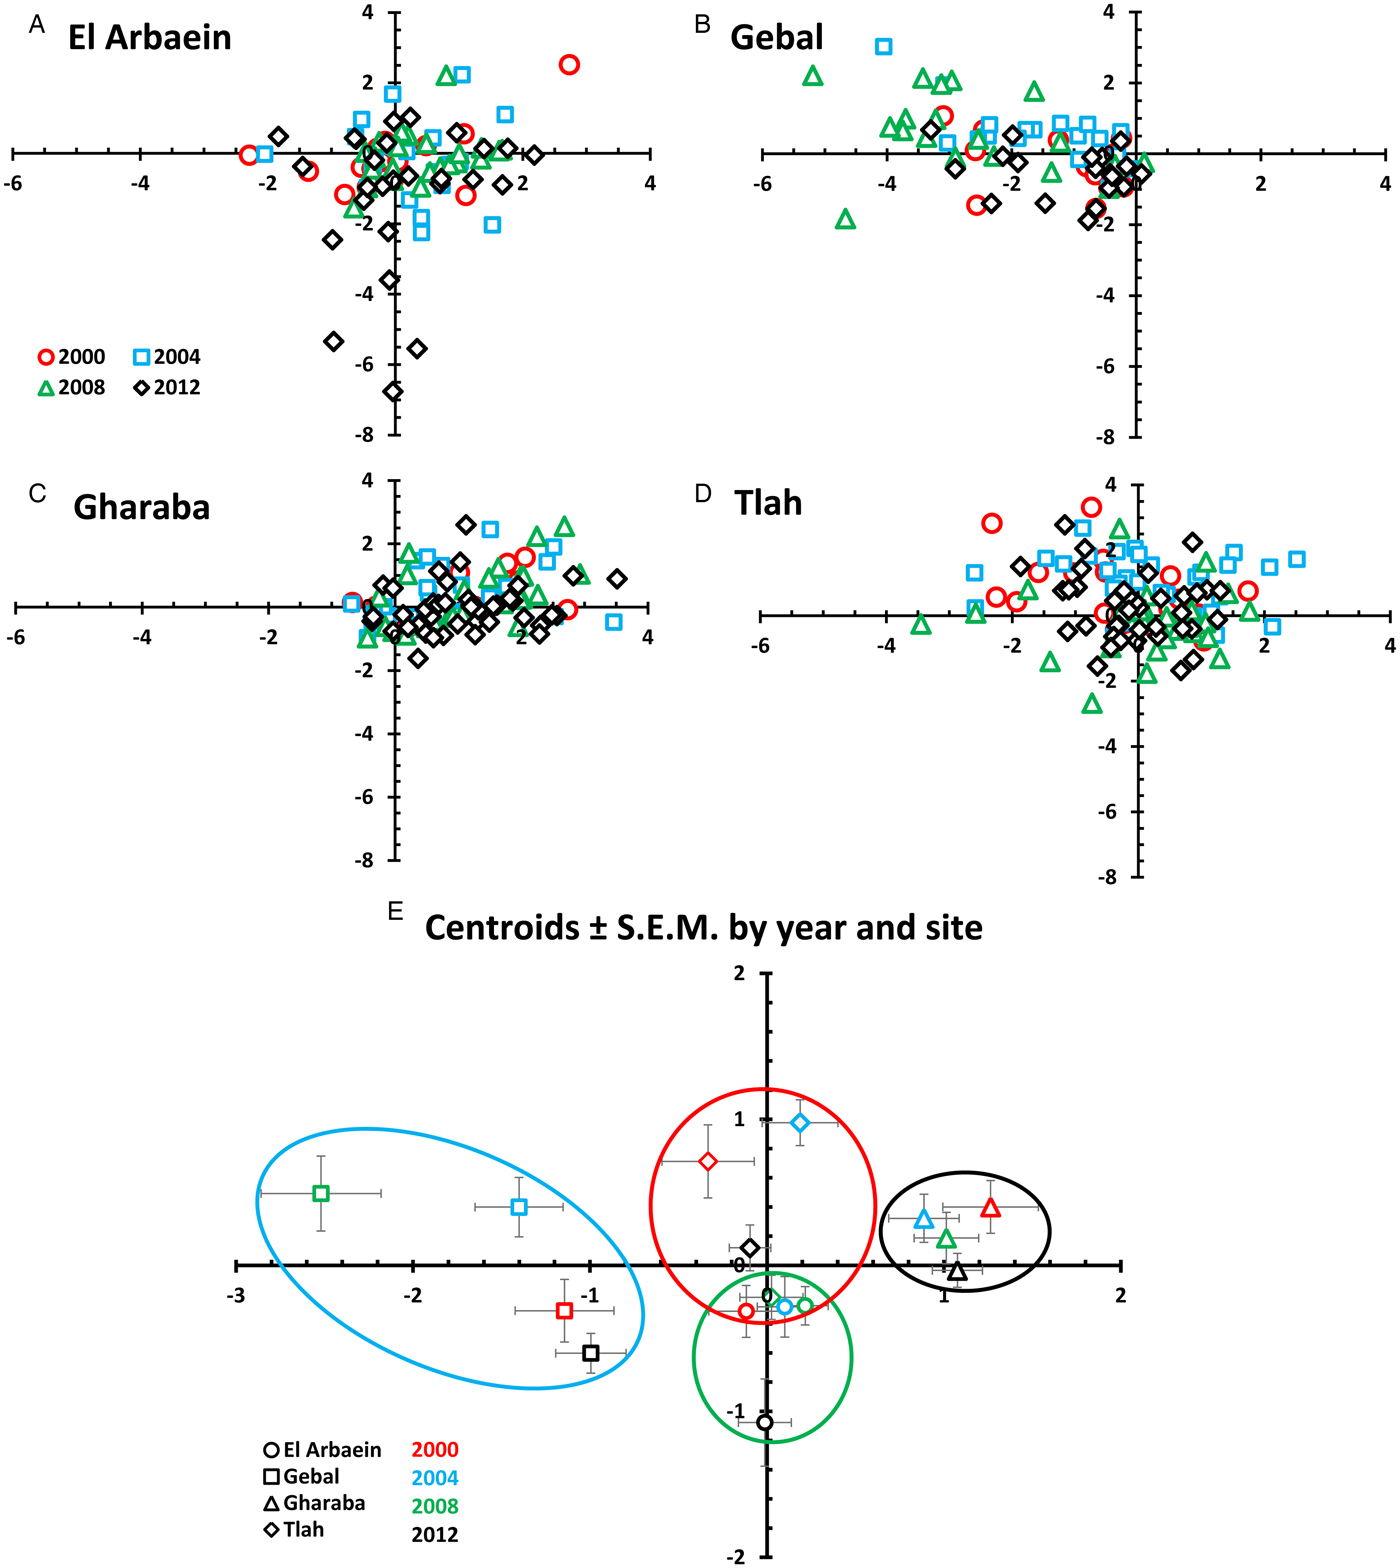
CDFA generated 15 axes that cumulatively accounted for 100% of the variance in the data. Canonical discriminant function 1 (eigenvalue = 0.810) accounted for 41.8% of the variance and function 2 (eigenvalue = 0.273) for a further 13.8% of the variance. Together these two axes accounted for 54.8% of the variance and since lower ranked axes individually explained much less of the residual variance they were not examined further. Function 1 (Fig. 8) essentially contrasts P. muricola (0.733) with M. muris (−0.667), hence the scatter of data points from Gharaba towards the positive range of the function 1 axis, and those from Gebal towards the negative range. There were additional positive but minor contributions to this axis from Streptopharagus spp. (0.163), A. africana (0.131) and G. aegypti (0.111) and negative from S. minuta (−0.285) and M. rodentinum (0.175). Axis 2 contrasts S. minuta (0.473), D. kunzi (0.391), P. muricola (0.370) and M. muris (0.327) with M. rodentinum (−0.577) and R. negevi (−0.324). With reference to Table 9, the negative values of centroids for all four estimates for mice from Wadi El Arbaein reflect the low abundance of S. minuta, D. kuntzi and the spiruroid nematodes in mice from this wadi.

Fig. 8. Scatter plots (A–D) and a plot of the centroids of functions 1 and 2 derived from canonical discriminant function analysis for 15 species of helminths in spiny mice grouped by site and year (E). Key for coloured symbols representing the four surveys in different years are the same for (A)–(D) and are given in the legend in (A). Panel (E) shows the centroids ± s.e.m. Each site is represented by a different symbol and each year by a different colour, as explained in the legend in (E). The rings/ellipsoids encompass approximate space occupied by the centroids + s.e.m. for each site: El Arbaein in green, Gebal in blue, Gharaba in black and Tlah in red outlines.
Figure 8E shows that with one exception, the centroids plus their SEMs for values from each wadi occupy space that is unique to each wadi. Those from Wadi Gharaba are to the right (positive) on the function 1 axis and those from Wadi Gebal to the left. Centroids from Wadi Tlah occupy central ground on the function 1 axis but are generally high on the function 2 axis and those from Wadi El Arbaein are low (negative) on the function 2 axis. The only overlap is between the values from Wadi Tlah in 2008, and those from Wadi El Arbaein in 2000, 2004 and 2008 but not 2012.
Discussion
Whilst taking into account intrinsic factors, in this paper we have focused primarily on the question of whether there are significant, and therefore meaningful, differences in the helminth community structures of spiny mice living in different sites among the wadis of the South Sinai massif (the spatial effect, reflected in SITE), and if so, whether they are stable over time (the spatiotemporal effect, reflected in the YEAR × SITE interaction). Inevitably there are likely to be some fluctuations over time (the temporal effect, reflected in YEAR), but the key question is whether, despite these between-year fluctuations, the rank order of values for each of our target parameters (including the species composition) derived from the different study sites changes over time. In this context, our analysis shows that the YEAR × SITE interaction on INFECTION reflecting prevalence was only significant in one case, for S. minuta. Likewise, where acceptable GLMs could be fitted in the analysis of abundance, the YEAR × SITE interaction was mainly confined to the oxyuroid nematodes A. africana and D. kuntzi, although there were also significant interactions for combined helminths and combined nematodes (probably mostly driven again in both cases by the oxyuroid component), but not for any of the spiruroid nematodes.
Our analysis shows not only that differences among wadis were generally maintained over time, but also that there were some profound differences in the combinations of parasites typically encountered at each of the four sites. The SITE effect accounted for most of the deviance in six of the ten taxa for which GLMs converged satisfactorily (Table 5) and the outcome of CDF analysis showed that the centroids for each wadi representing the mean values for canonical discriminant functions 1 and 2 together with their standard errors, irrespective of the year of survey, occupied unique two-dimensional space in Fig. 8E in all but one case. Moreover, prevalence varied among sites in 12 of the 14 analyses that were conducted on specific taxa (the only exceptions were S. minuta and D. kuntzi). Therefore, in agreement with Behnke et al. (Reference Behnke2000, Reference Behnke2004), we conclude that spiny mice from each wadi had a unique composition of helminth species which at the population level distinguished them from the inhabitants of other wadis, and that these differences among wadis were mostly stable over time, during the 12-year period over which our surveys were conducted.
Differences among the helminth communities of spiny mice from different wadi-populations were best reflected in the occurrence of spiruroid nematodes, as for example P. muricola only very rarely occurring in mice from Wadi Gebal, but dominating the helminth fauna of spiny mice in Wadi Gharaba, and in contrast M. muris dominating the spiruroid component in mice from Wadi Gebal, but occurring only rarely in mice from the other three wadis. In fact, mice from Wadi Gharaba also showed the highest prevalence of G. aegypti and the acanthocephalan M. acomysi, which was totally absent from mice from Wadi Gebal. Perhaps unexpectedly Wadi Gharaba mice were not infected with the cestode R. negevi, which was most abundant in mice from Wadi Tlah. All three species of oxyuroid nematodes were also more prevalent and more abundant in mice from Wadi Tlah than in those from the other wadis, whereas mice from Wadi El Arbaein showed intermediate prevalence and abundance of most helminth species, and hence their year centroids occupy central ground in Fig. 8E.
At this stage, we can only speculate as to why these differences among the populations of mice living in the four wadis occur. For the spiruroid nematodes, cestodes and the acanthocephalans, one obvious possibility resides in the local composition and availability of invertebrates that can act as intermediate hosts, such as the Coleoptera as reported from this region of Egypt by Semida et al. (Reference Semida2001) and other ground-dwelling insects including the Dictyoptera, Blattodea (Zalat et al., Reference Zalat2008). The spiruroid nematodes Streptopharagus greenbergi, M. muris and Gongylonema sp., are all known to exploit Coleoptera, such as tenebrionids in other regions (Montoliu et al., Reference Montoliu2013). Zalat et al. (Reference Zalat2001) recorded the highest diversity and species richness of ground-dwelling insects in Wadi Gharaba, significantly higher than for example in Wadi Gebal, and our data (Table 4) for helminth species richness and diversity show a trend in the same direction for these two wadis (i.e. highest values in mice from Wadi Gharaba and lowest in those from Wadi Gebal). Protospirura muricola, the dominant species in Wadi Gharaba is known to exploit Coleoptera among other invertebrates as intermediate hosts (Quentin, Reference Quentin1969; Campos and Vargas, Reference Campos and Vargas1977), and tenebrionid beetles have been used to maintain an Egyptian isolate of this species in the laboratory (Lowrie et al., Reference Lowrie, Behnke and Barnard2004; Schutgens et al., Reference Schutgens2015). Moniliformis aegypti is most likely to be transmitted by cockroaches (Blattodea), and these were particularly common around the human dwellings in Wadi Gharaba (personal observation), although not recorded by Zalat et al. (Reference Zalat2001) in their survey of ground-dwelling insects in this particular wadi but recorded elsewhere in the region by Zalat et al. (Reference Zalat2008). Interestingly, as noted above, R. negevi, whose life cycle has not been studied, but which like other hymenolepidid cestodes is likely to be transmitted through insects such as Coleoptera and possibly Siphonaptera (Behnke, Reference Behnke, Halton, Behnke and Marshall2001), was never recovered from mice from Wadi Gharaba.
Among-site differences were also found for two of the three species of the directly transmitted Oxyuroidea; the prevalence of D. kunzti did not vary significantly among sites although some differences in abundance were apparent (Fig. 6D, SITE × YEAR interaction) but A. africana clearly did vary in both prevalence and abundance, with highest values recorded for mice from Wadi Tlah though little difference in abundance in mice from the other three wadis. Ground temperature is likely to influence the rate of embryonation of eggs of species such as A. africana that depend on a period in the external environment for their eggs to reach infectivity, but Wadi Tlah is situated at an intermediate height above sea level, with Wadis Gebal and El Arbaein higher (and hence colder) and Wadi Gharaba lower (and warmer). In this case, therefore, the environmental temperature cannot be directly responsible for the higher abundance of A. africana in Wadi Tlah through its influence on the development of eggs. Nevertheless, it is possible that environmental temperature may have had a role in affecting the abundance of this species through immune trade-off in the mice (Lochmiller and Deerenberg, Reference Lochmiller and Deerenberg2000). It may be that host genetics play a role here, since the mice from this and each of the other wadis had a distinct genetic signature, although this has not been linked yet to susceptibility/resistance to specific helminths (Alfudhala, Reference Alfudhala2015). Even within a genetically homogeneous population, however, other environmental factors might indirectly influence the abundance and prevalence of helminths through trade-offs that the mice face, which for example, could restrict immune investment in harsher environments in which priority may be given to other needs for survival (Lochmiller and Deerenberg, Reference Lochmiller and Deerenberg2000). Tapeworms are known to be particularly susceptible to intra- and inter-specific competition in concurrently infected hosts (Read, Reference Read1951; Holmes, Reference Holmes1961; Arai, Reference Arai1980; Holland, Reference Holland1987; Bush and Lotz, Reference Bush and Lotz2000), and as we have shown the mice from Wadi Gharaba were associated with the highest abundance of helminths, including the spiruroid nematodes and the acanthocephalan M. muris, but were not infected with R. negevi. Thus it may be that R. negevi was unable to survive in that wadi, where host responses to the other species (Behnke et al., Reference Behnke, Bland and Wakelin1977) and competition for host resources would have been intense.
Our analysis revealed marked age effects in most cases, and the majority of these reflected higher prevalence and greater abundance of worms in the older mice. In fact, the only taxon that failed to show a significant age effect, even though values for prevalence and mean abundance were in the expected direction, was M. acomysi. In all other invertebrate-transmitted species, including all the spiruroid nematodes and the adult cestodes, worm burdens were significantly heavier in the older compared with the younger juvenile mice. This is much as predicted given that most helminths generate chronic infections in their hosts, and the longer a host lives, the more likely it is to be exposed to infective stages of helminths and hence to accumulate worms in its intestines (Anderson and Gordon, Reference Anderson and Gordon1982; Pacala and Dobson, Reference Pacala and Dobson1988). Our data are therefore consistent with many other studies on wild rodent helminths which have established age as a highly predictable feature of these host–parasite systems (Kisielewska, Reference Kisielewska1971; Montgomery and Montgomery, Reference Montgomery and Montgomery1989; Behnke et al., Reference Behnke1999; Bugmyrin et al., Reference Bugmyrin2005; Janova et al., Reference Janova2010; Loxton et al., Reference Loxton2017) and, as we have done here, a factor that must be taken into consideration and controlled for in assessing the importance of other explanatory factors.
We found a different pattern in two cases, however, with the prevalence and abundance of two oxyuroid nematodes being in the opposite direction, with higher values for both parameters among the younger mice. This is not unexpected since, in contrast to the spiruroid nematodes, oxyuroid species are directly transmitted with no dependence on intermediate hosts. Both A. africana and D. kuntzi are transmitted by eggs liberated in the feces of hosts with latent infections, and although to the best of our knowledge, neither species has been investigated in the laboratory, the host–parasite relationship of the related Aspiculuris tetraptera has been well documented. Depending on external environmental temperature (20–30 °C is the optimal range), eggs require a period of about 4–8 days to become embryonated and fully infective (Anya, Reference Anya1966). Adult mice are most likely to exploit latrine sites in close vicinity to their nests, and when juveniles begin to explore the local environment they are exposed to infective eggs. The prevalence and abundance of A. tetraptera both peak in young adult house mice before falling in older sectors of the population (Behnke, Reference Behnke1976). Aspiculuris tetraptera generates acquired immunity in laboratory mice (Behnke, Reference Behnke1975), and if A. africana does likewise, both parameters of infection would be expected to fall with host age as we have found and as has been reported for other parasites of wild rodents that are known to elicit strong acquired immunity in their hosts (Gregory, Reference Gregory1992; Gregory et al., Reference Gregory, Montgomery and Montgomery1992). Presumably much the same applies to D. kuntzi but there are no laboratory studies on this parasite or on any close relative to enable certainty.
Prevalence and abundance of helminths usually do not vary markedly between the sexes in wild rodents (Abu-Madi et al., Reference Abu-Madi2000; Bordes et al., Reference Bordes2012) and when it does the bias is more often towards higher abundance and prevalence in male hosts (Poulin, Reference Poulin1996; Schalk and Forbes, Reference Schalk and Forbes1997; Moore and Wilson, Reference Moore and Wilson2002; Ferrari et al., Reference Ferrari2004, Reference Ferrari2007; Luong et al., Reference Luong, Grear and Hudson2009). Consistent with the literature, in our data prevalence did not differ significantly between the sexes in most species, the only exception being R. negevi. However, we found that abundance did vary between the sexes, and surprisingly was mostly female biased. In two species in particular, P. muricola and R. negevi, worm burdens were markedly higher in female mice. Although there was no significant difference in abundance between the sexes for other species, in most cases the value for mean abundance of worms was numerically higher for female mice and collectively these effects were sufficiently robust to affect also the higher taxonomic orders as Tables 3, 4 and 6–9 show, suggesting that a small sex bias was a robust phenomenon across the helminths in the current system. Grzybek et al. (Reference Grzybek2015b), also reported female biased helminth infections in bank voles in Poland and provided a comprehensive discussion of other examples. In that study, M. muris was more prevalent and more abundant in females, although for M. muris in the current study neither parameter varied between the sexes.
As concluded earlier, the site of the capture of spiny mice was the most important factor affecting both prevalence and abundance of infection with most of the helminth species that we identified. If not the most influential, then the site of capture was certainly one of the key factors, in all cases except Streptopharagus spp. and D. kuntzi. The former was one of the rarer species, accounting for less than 5% of all spiruroid nematodes, but showed signs of rising prevalence and abundance towards the end of our study period. For this species, temporal effects were more marked than spatial effects and these were evident in all four sites, and thus consistent, reflecting a similar temporally increasing risk of exposure across the region, perhaps attributable to an influx of appropriate intermediate insect vectors. This region of Egypt has experienced marked climatic changes over the course of the decade over which these surveys were conducted, including increasing aridity with resultant consequences for Bedouin gardens (see Alsarraf et al., Reference Alsarraf2016 for discussion of recent local environmental changes). This is likely to have had a major effect on invertebrates in the region, although we are unaware of any quantitative studies of insect and other invertebrate populations across this period. Dentostomella kuntzi was likewise evenly distributed across sites, and here again, the overall temporal effect and the temporal changes across sites played a greater role than the wadi in which the mice lived. Like A. africana, D. kuntzi is transmitted directly between hosts via externally liberated eggs and is one of the core species of A. dimidiatus. Its transmission strategy is clearly highly efficient and appears to be independent of the environmental and other influences that are responsible for among-site variation in transmission of the other helminths in this study.
Intuitively, we might have expected intrinsic factors such as host age to play a major, perhaps even decisive, role in determining parasite communities, since the longer an animal lives, the greater its cumulative exposure to pathogens is likely to be. While clearly playing a significant and highly predictable role in most cases, in this and other recent studies in which data analysis has taken account of and controlled for confounding interactions between key quantified/identified factors, intrinsic factors have been shown to be less influential in shaping helminth communities compared with extrinsic factors (Decker et al., Reference Decker, Duszynski and Patrick2001; Calvete et al., Reference Calvete2004; Grzybek et al., Reference Grzybek2015a). Where surveys have encompassed more than just a single site for sampling helminth communities, the site effect has proved to be decisive and considerably more influential than intrinsic factors. Our current study therefore contributes to the growing body of work that collectively has implicated the location in which an animal lives, as the most important determinant of the parasites to which it is likely to be exposed (Calvete et al., Reference Calvete2004; Booth, Reference Booth2006; Brouat et al., Reference Brouat2007; Calabrese et al., Reference Calabrese, Brunner and Ostfeld2011; Young and MacColl, Reference Young and MacColl2017). Whether sites differ markedly ecologically in terms of habitat structure or are fundamentally similar appears to be less of an issue since site-specific differences in helminth communities have been reported in both cases (Eira et al., Reference Eira2006; Brouat et al., Reference Brouat2007; Froeschke et al., Reference Froeschke2010; Grzybek et al., Reference Grzybek2015a; Dwużnik et al., Reference Dwużnik2017). In some, habitat qualities that impinge on the transmission efficiency of helminths have been quantified and suggested as explanations for among-site differences (Kinsella, Reference Kinsella1974; Mollhagan, Reference Mollhagan1978; Decker et al., Reference Decker, Duszynski and Patrick2001; Froeschke et al., Reference Froeschke2010; Young and MacColl, Reference Young and MacColl2017). However, as Calabrese et al. (Reference Calabrese, Brunner and Ostfeld2011) wrote, it may just be bad luck for the inhabitants of particular sites, and in their own specific example, for deer mice living in a site where tick challenge was particularly heavy. Thus while the regional helminth fauna of a host meta-population may be well documented, the structures and compositions of specific helminth communities in host populations within the region may vary extensively from one another. Our data show that in general, these differences are dependent on the site of the capture of an animal, are maintained over time and are dominant effects shaping helminth communities.
Supplementary material
The supplementary material for this article can be found at https://doi.org/10.1017/S0031182018000987.
Dedication
This study was initiated in 2000 by J.M.B., A.B., F.S.G. and S.Z. jointly with Professor Chris Barnard, whose inspired leadership and contribution were crucial in the conception of this study and field work during the early expeditions, but who sadly died in 2007. We dedicate this paper to his memory.
Acknowledgements
We are grateful to all the staff of the Environment Research Centre of Suez Canal University and our Bedouin hosts led by Faraj Mahmoud from Fox Camp at St. Katherine for their support and warm hospitality during our stay in St. Katherine and in the camps in the more distant study sites (Hussein Saleh, Jemil Attiya Hussein & Nasr Mansur). We thank Mohammed Shaker and Mohamed Qotb for permission to work in the St. Katherine Protectorate and the staff at the Rangers office for providing vehicles and drivers to enable access to some of the remote locations and for their company and support on each of the expeditions. Mustafa Rashi El-Rafaei's skills in trapping rodents during the expedition in 2000 are also gratefully acknowledged. We thank Dr R. Bray from the Natural History Museum in London, Professor Boyko Georgiev of the Bulgarian Academy of Sciences for advice on the identity of some of the cestodes and Professor P. Harris for his contributions to the first two expeditions and subsequent laboratory work. Finally, we thank all the undergraduate students (George Bradford, Joseph Clark, Laura Cliffe, Jennifer Cowburn, Alice Cullinane, Job de Roij, Kirsty Elms, Samuel Franzen, Catherine Hill, Jane Hurst, Sally Jackson, Michael James, Michael Lamb, Alexander Rhodes and Adam Shooter) who helped with fieldwork and subsequent laboratory work at the University of Nottingham.
Financial support
We thank the Universities of Nottingham and Warsaw for enabling this study through financial support for travel and consumables. Our work was supported additionally by travel grants from the Royal Society (JMB) and the British Ecological Society (JMB) and we also received some financial support from the British Council in Cairo in 2000 (a LINK grant between Nottingham and Suez Canal University). Anna Bajer's expedition in 2008 was supported financially by KBN-BC Young Scientist Program no. WAW/342/06. The expedition of Polish staff to Egypt in 2012 was funded by the National Science Centre (NCN), Poland, grant OPUS 2011/03/B/NZ6/02090 (AB) and by the Ministry of Science and Higher Education through the Faculty of Biology, University of Warsaw's intramural grant DSM number 140000/501/86-110101.
Conflicts of interest
None.
Ethical standards
The project was approved by the St. Katherine Protectorate Management Unit and the Nature Conservation Sector of the Egyptian Environmental Affairs Agency. Under the agreed terms we were permitted to cull no more than 40% of the rodents captured.