Significant outcomes
∙ A magnesium deficient diet (MgD) for 6 weeks significantly increased immobility time in MgD mice.
∙ Gut microbiota correlated positively to the behaviour of control mice.
∙ Hippocampal IL-6 correlated positively to the altered GM after 6 weeks on MgD diet.
Limitations
∙ Only one test for depression was performed, the forced swim test.
∙ Magnesium was not measured in the blood.
∙ Potential study with supplementation was not carried out.
Introduction
Magnesium (Mg) plays an essential role in a wide range of cellular events, biochemical reactions and physical functions, by serving as a cofactor in over 300 enzymatic reactions, including DNA and protein synthesis, ATP synthesis, carbohydrate metabolism, cell proliferation, and membrane stability and function (Reference Grubbs and Maguire1–Reference Ryan5). Furthermore, Mg is critical in neurotransmission in the central nervous system where synaptic vesicles reprocessing depends on presynaptic concentration of Mg (Reference Koenig and Ikeda6), and Mg is a modulator of the N-Methyl d-aspartate receptor (NMDAr) function, a receptor critically linked to neuroplasticity (Reference Zarate, Du and Quiroz7). Mg deficiency has been suggested to play a role in the biological dysregulation contributing to psychiatric illnesses (Reference Murck8), such as major depression (Reference Rasmussen, Mortensen and Jensen9) and mood disorders (Reference Levine, Stein, Rapoport and Kurtzman10). Supporting this, Mg supplementation has been observed to possess antidepressant efficacy in patients suffering from depressive disorder (Reference Cox, Campbell and Dowson11,Reference Barragan-Rodriguez, Rodriguez-Moran and Guerrero-Romero12).
Moreover, Mg plays an important role in carbohydrate metabolism, particularly the action of insulin (Reference Chaudhary, Sharma and Bansal13–Reference Garfinkel and Garfinkel15). Briefly, the glucose transporting mechanism, insulin secretion and various enzymes such as synthases and phosphatases depend on Mg in carbohydrate oxidation (Reference Suarez, Pulido, Casla, Casanova, Arrieta and Rovira16), and Mg also seems to play a vital role in the glucose metabolism in the release of insulin (Reference Nadler, Buchanan, Natarajan, Antonipillai, Bergman and Rude17), and a role in insulin mediated glucose uptake (Reference Paolisso, Sgambato and Giugliano18). It has therefore been suggested that Mg deficiency may be involved in the pathogenesis of diabetes (Reference Nadler, Buchanan, Natarajan, Antonipillai, Bergman and Rude17).
Interestingly, Mg deficiency has previously been shown to contribute to neuroinflammation following 5 days of dietary deficiency (Reference Weglicki, Phillips, Freedman, Cassidy and Dickens19) and systemic inflammation after only 4 days of dietary deficiency (Reference Pachikian, Neyrinck and Deldicque20). The latter was associated with increased gut permeability and reduced abundance of the intestinal mucus production stimulatory Bifidobacterium spp. Interestingly, gut integrity and systemic inflammation were restored 18 days later, which was associated with an increase in abundance of Bifidobacterium spp. and Lactobacillus spp. As demonstrated, dietary magnesium deficient diet (MgD) impacts the gut microbiota (GM) of mice (Reference Pachikian, Neyrinck and Deldicque20). An altered GM profile has been associated with several aspects of behaviour including anxiety and depressive-like behaviour (Reference Collins, Kassam and Bercik21–Reference Cryan and O’Mahony24). Therefore, it can be hypothesised that diet-induced GM alterations may contribute in mediating behavioural changes.
Differences in the above mentioned inflammatory states may be explained by differences in systemic Mg levels, as the immune system may be compromised when deprived of Mg (Reference Johnson25), or alternatively be a consequence of diet-induced gut microbial changes modulating the immune system.
The purpose of the present study was to further characterise a proposed animal model of depression, induced by dietary Mg deficiency, to investigate the impact on the GM, and to correlate the GM to depressive-like behaviour, and the hippocampal neuroinflammatory signalling molecules and brain-derived neurotrophic (BDNF) levels in order to evaluate on the impact of Mg on a healthy microbiota–gut–brain axis.
Material and methods
Animals
A total of 30 male C57BL/6NBomTac mice (Taconic MB A/S, Denmark), 8 weeks old and weighing 19–22 g at the beginning of the experiments were used. Mice were housed in group of up to five in transparent plastic cages (27×43×18 cm; EUROSTANDARD III, Scanbur, Denmark) with pine bedding (Lignocel® S8; Brogaarden Aps, Lynge, Denmark), shelter, nesting material (Enviro-Dri; Brogaarden®, Denmark) at a stable temperature (22°C) and humidity (50–60%) controlled vivarium in a 12-h light/dark cycle (lights on at 07:00 a.m.) given free access to food (Altromin Standard diet 1324) and water. Clean cages and new bedding was provided once a week. At the beginning of the experiment, the animals were assigned to one of two the groups, the control group (CON, n=15) or MgD diet group (n=15). Body weights were recorded after 6 weeks on the experimental diet.
The animal experimentation committee, appointed by the Danish Ministry of Food, Fisheries and Agriculture, granted ethical permission for the studies. All experimental procedures complied with the EU Directive 2010/63/EU and the Danish Experimentation Act (LBK 1306 from 23 November 2007 with 2011 amendments). The protocol was approved by the Danish Animal Experimentation Committee (j.no 2012-15-2934-00254).
Experimental diets
The control group was fed standard diet (Altromin Standard diet 1324) containing 0.2% Mg, (which corresponds to four times more than the minimum Mg requirements of 500 Mg/kg of food) (Reference Kantak26).
Mice apportioned to the MgD group, were fed a MgD diet (50 mg Mg/kg equal to 0.02% Mg; Sniff Speziladiäten, Soest, Germany) providing 10% of the daily rations recommended (Reference Kantak26), as previously shown (Reference Singewald, Sinner, Hetzenauer, Sartori and Murck27). Mice were fed their respective diets for 6 weeks before behavioural testing and until euthanasia.
Behavioural paradigms
Before all behavioural tests, the mice were allowed to habituate to the testing room for at least 24 h. All tests were carried out between 08:00 a.m. and 03:00 p.m. Test environments were thoroughly cleaned with 70% ethanol between each animal.
Open field
Locomotor activity and test for visits in the centre of the field was carried out immediately before the forced swim test (FST) trial in the open field on study day 42, to ensure that there were no differences in locomotor status. Briefly, the mice were randomly placed in the centre of a square box (50×50×50 cm) for 5 min, and their movements were video-recorded and subsequently tracked by Noldus EthoVision XT7 software. Total distance travelled (cm) by the mice was used as an indicator of locomotor activity.
FST
Mice were randomly subjected to the FST as previously described (Reference Porsolt, Le Pichon and Jalfre28) following the locomotor test. The animal was placed in a transparent water-filled plastic cylinder (H: 25 cm, ϕ: 10 cm, water depth: 10 cm) maintained at 25°C. The illumination was set at 100 lux and the mice were videotaped for a 7-min period. Videotapes were subsequently scored by a trained observer blinded to the treatments. Total duration of immobility was measured during the 7 min of testing. Immobility was defined as when the mouse was floating and only making movements to keep the head above the water.
Metabolic measurements
Glucose tolerance test (GTT)
GTT was performed 2 days after the FST. The evening before the test, mice were fasted by taking food but leaving water from 10:00 p.m. to the beginning of the experiment the next morning at 08:00 a.m.
Each mouse was weighed before injection to know the exact amount of glucose for each animal. Fasting glucose was measured before injection of a 10% glucose solution (2 g/kg i.p.). Blood was collected from a small incision made at the distal 1–2 mm of the tail, where after glucose concentration was measured at time 15, 30, 60 and 120 min after the glucose injection. The blood glucose concentrations measurements were performed using Bayer Contour® Glucometer® test strips (BayerContour, USA).
Insulin levels
Blood samples for insulin measurements were collected after the 10-h fasting period before the GTT and 2 h after the glucose injection during GTT. Briefly, blood was collected from an incision at the tip of the tail onto a heparinised haematocrit tube. Trunk blood was collected after sacrifice to determine non fasting insulin concentration. All collected blood was heparinised, spun and plasma collected and frozen at −80°C for later analysis. Plasma insulin concentration was measured using Ultra-Sensitive Mouse Insulin ELISA kit (DRG Diagnostics, GMBH, Germany) following the manufacturer’s protocols. According to the manufacturer’s instructions, this assay does not detect proinsulin.
Molecular analyses
Characterisation of the GM
Faecal and caecal samples were obtained from 10 control and 10 MgD mice at euthanasia. Samples were collected directly into sterile 1.5 ml Eppendorf tubes (Eppendorf®, Germany) and stored at −80°C within 30 min. Faecal and caecal samples were analysed as previously described (Reference Pyndt, Krych and Larsen29). Briefly, bacterial DNA was extracted from samples followed by polymerase chain reaction (PCR) amplification of the bacterial 16S rRNA gene (V3 region), which was thereafter separated by denaturing gradient gel electrophoresis (DGGE), to obtain the individual GM profiles of the mice.
Hippocampal measurements [quantitative real-time polymerase chain reaction (real-time qPCR)]
The hippocampus was dissected out of the extracted brain immediately after cervical dislocation and stored in −80°C until further analysis. Tissue homogenisation, RNA extraction, RNA characterisation and cDNA synthesis were described in our previous work (Reference Elfving, Bonefeld, Rosenberg and Wegener30). cDNA was stored undiluted at −80°C until use. The cDNA samples were diluted (1 : 15) with diethylpyrocarbonate water before used as real-time qPCR template. The real-time qPCR reactions were carried out in 96-well PCR-plates using Mx3000P (Stratagene, USA) and SYBR Green. The gene expression of eight different reference genes (18s rRNA, ActB, CycA, Gapd, Hmbs, Hprt1, Rpl13A and Ywhaz) and tumour necrosis factor-α (TNF-α), interleukin-6 (IL-6), BDNF and insulin-like growth factor 1 (IGF-1) was investigated (Table 1). The reference genes were designed as described by Elfving et al. (Reference Elfving, Bonefeld, Rosenberg and Wegener30). Each SYBR Green reaction (10 µl of total volume) contained 1x SYBR Green master mix (BIO-RAD, CA, USA), 0.5 µM primer pairs and 3 µl of diluted cDNA and were carried out as previously described (Reference Elfving, Bonefeld, Rosenberg and Wegener30). All samples and standards were run in duplicate. A standard curve, was generated on each plate. The primers were obtained from DNA Technology A/S and Sigma-Aldrich, Denmark. For data normalisation, we first measured mRNA levels for the reference genes. Stability comparison of the expression of the reference genes was conducted with the Normfinder software (http://www.mdl.dk) (Reference Andersen, Jensen and Orntoft31). Hprt and ActB were determined to be the best combination in the hippocampus and values for each individual were normalised with the geometric mean of the reference genes.
Table 1 Names of genes and primer sequences for quantitative real-time polymerase chain reaction

Statistical analysis
Results are presented as mean±SEM. Group analysis using Shapiro–Wilks test revealed that data followed a normal distribution between the two groups. Therefore, behavioural parameters were tested for significant differences between normally fed and Mg-depleted mice using the unpaired Student’s t-test using GraphPad Prism version 5.00 for Windows (GraphPad software, CA, USA). For comparison of GTT results, the area under the GTT curve (AUC) was calculated. The criterion for statistical significance was p<0.05. Statistical analyses were performed using GraphPad Prism (version 5.00 for Windows).
In the real-time qPCR, group means were analysed for statistical significance using one-way analysis of variance (ANOVA) followed by Bonferroni multiple comparison testing using GraphPad Prism (version 5.00 for Windows).
DGGE gels were analysed by cluster analysis using the Dice Similarity Coefficient with a band position tolerance and optimisation of 1% using the Unweighted Pair Group Method with Arithmetic Mean clustering algorithm and by principal component analysis (PCA) in Bionumerics ver. 7.1 (Applied Maths, Belgium) as previously described and explained (Reference Lundberg, Clausen and Pang32). The three first principal components (PC1, 2 and 3) of the PCAs were used to compare the GM of treatment groups by ANOVA on ranked data, taken into account DGGE gel number and cage factor, and to create multiple linear regression models for analysing the correlation between GM composition and behaviour. The number of bands in each DGGE profile was used as a measure of GM diversity as previously described (Reference Muyzer and Smalla33). Owing to technical issues, the number of samples in each group were in faeces n=6 (control) and n=7 (MgD) and in caecum n=6 (control) and n=7 (MgD). Statistical analyses were performed using SAS JMP vers. 10 (SAS Institute Inc., USA). Data were checked for adherence to a normal distribution by QQ-plots and Shapiro–Wilks test for normality, and ranked if not normally distributed before subjected to ANOVA. A p-value<0.05 was considered significant. Robustness of the linear regression models was checked by removing a random sample twice, which did not affect significance.
Results
Body weight
After 6 weeks of feeding the experimental diet, MgD mice weighed significantly less than control mice (MgD mice 24.24.±0.6 vs. control 26.61±0.6, t=2.5, df=14, p=0.02).
Open field test
No significant difference was observed between control and MgD mice in the number of entries into the centre of the field (t=0.4, df=17, p=0.45). General locomotor activity as indicated by total distance travelled in the open field was not affected by dietary treatment, excluding the possibility that unspecific changes in locomotor activity would contribute to any effects in the FST (t=0.7, df=17, p=0.49, Fig. 1a).
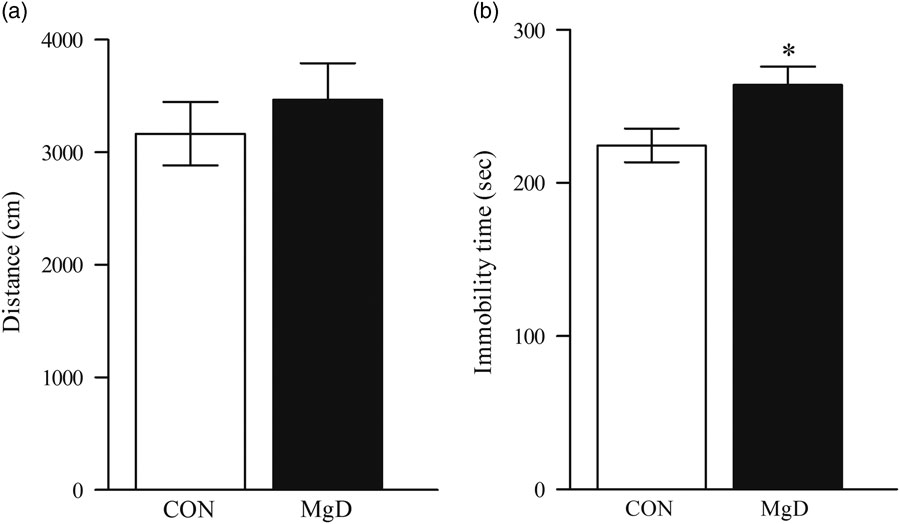
Fig. 1 Distance moved in the open field (a). There was no significant difference (t=0.70, df=17, p=0.49). Depression-like behaviour in the FST between MgD and CON mice (t=2.4, df=28, p=0.02) (b). Values are mean SEM, of 10–15 mice/group. *p<0.05. CON, control; FST, forced swim test; MgD, magnesium deficiency.
FST
Mice fed MgD for 6 weeks, showed significantly higher immobility scores than controls (MgD 264±12.15 s vs. controls 231.8±13.34 s), indicating a depressive-like phenotype (t=2.4, df=28, p=0.02, Fig. 1b).
Fasting blood glucose levels and the GTT
We found no significant difference in the fasting glucose measurements before administering glucose (Fig. 2a, t=0.35, df=18, p=0.72). However, after 15 min, MgD mice showed significant lower glucose response (Fig. 1a, t=2.04, df=18, p=0.05). MgD diet did not affect the fasting insulin concentration and neither 2 h following the glucose challenge [F(1,14)=0.92, p=0.35]. The area under the curve (AUC) was calculated after the GTT was performed. There was no significant difference between the MgD mice and the control mice (Fig. 2b, t=0.11, df=18, p=0.91).

Fig. 2 Blood glucose levels from control and MgD mice (a). Plasma insulin concentrations at fasting and 2 h after glucose injection (2 g/kg) during GTT, n=4–5/group (b). Area under the curve (AUC) was calculated (c). CON, control mice; GTT, glucose tolerance test; MgD, magnesium deficiency, n=10/group. Data are means±SEM.
Analysis of the GM
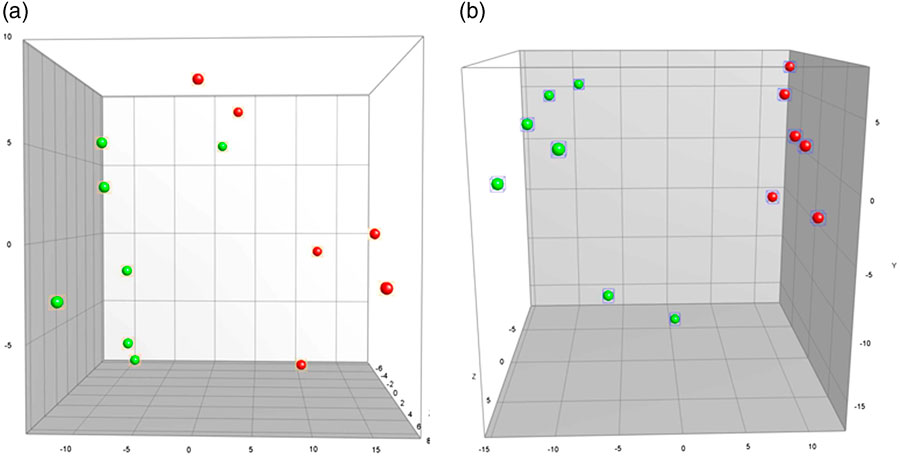
The GM profile of MgD mice differed significantly from mice fed a standard control diet in both faeces (faeces PC1, p=0.0004, Fig. 3a) and caecum (PC1, p<0.0001, Fig. 3b). The cluster analysis of faecal samples demonstrated the control mice to cluster together, and with six out of seven MgD mice to cluster. In caecum the same pattern was seen, with the control mice clustering together and five out of seven MgD mice clustering together. Faecal microbial diversity did not differ between groups (19.0±1.9 and 22.5±2.1 bands for MgD and control mice, respectively). Multiple linear regression analyses between the GM profiles and behaviour revealed the GM composition of the control mice to significantly correlate to the time spent immobile in the FST (faeces PC1 p=0.034 and PC2 p=0.011, positive correlation r 2=0.86).

Fig. 3 Principal Component Analysis plots illustrating differences in gut microbiota composition as determined by 16S rRNA gene (V3 region) targeted denaturing gradient gel electrophoresis between mice fed a control diet or a magnesium deficient diet in faeces (p=0.0004) (a) and caecum (p<0.0001) (b). Green, magnesium-deficient group; red, control group. Scale is ×107.
Hippocampal measurements real-time qPCR
The relative mRNA expression levels of TNF-α, IL-6, BDNF and IGF-1 analysed in the qPCR showed no differences. However, a strong tendency towards decreased mRNA IL-6 levels was observed in the MgD mice (t=1.87, df=18, p=0.08). The GM of MgD mice correlated significantly to hippocampal IL-6 levels (caecum, PC1, p=0.014, positive correlation r 2=0.68). No difference was observed in the mRNA expression level of BDNF (t=0.55, df=18, p=0.58), IGF-1(t=0.14, df=18, p=0.88) or TNF-α (t=1.28, df=18, p=0.21).
Discussion
The main findings in the present study was that following 6 weeks of dietary MgD, depressive-like behaviour was induced in the FST, which was associated with an altered GM.
Earlier studies suggest adverse effects of Mg depletion on nervous system function; including a few describing the effect of Mg deficiency on animal behaviour. The present study, where depressive-like behaviour is observed in the MgD mice, is thus in line with a previous report, demonstrating depressive-like behaviour following 3 weeks on dietary MgD (Reference Singewald, Sinner, Hetzenauer, Sartori and Murck27). Supporting the observed depressive-like phenotype in MgD fed mice, studies have shown that administration of Mg elevates the serum levels of Mg, and reduce time spent immobile in the FST, suggesting Mg to act as an antidepressant in the FST (Reference Decollogne, Tomas, Lecerf, Adamowicz and Seman34,Reference Poleszak, Szewczyk, K’dzierska, Wlaź, Pilc and Nowak35). The importance of these findings in translational setting is underlined by several studies demonstrating a clear connection between the level of Mg and affective symptomatology (Reference Eby and Eby36). Furthermore, Mg is a very important cation in the body. Its action in affective disorders may be hypothesised to be an alteration in neurochemical action. There are several hypotheses of the behavioural effects caused by Mg depletion. It could be speculated that the low concentration of Mg in the extracellular fluid, activates the NMDAr, causing disturbed calcium homoeostasis leading to possible long term potentiation, neurotoxicity and eventually to affective disorders, due to the detrimental effects in the hippocampal and locus coerules areas (Reference Crunelli and Mayer37–Reference Sartori, Whittle, Hetzenauer and Singewald42). Interestingly, blocking the NMDAr by antagonists has shown increased NMDAr/α-amino-3-hydroxy-5-methyl-4-isoxazolepropionic acid receptor density in hippocampus and to simulate antidepressant effect (Reference Tizabi, Bhatti, Manaye, Das and Akinfiresoye41) as well as the co-administration of Mg (Reference Decollogne, Tomas, Lecerf, Adamowicz and Seman34,Reference Poleszak, Szewczyk, Kedzierska, Wlaz, Pilc and Nowak43). Mg depletion may also play a role in the monoaminergic systems as Mg is a cofactor in activating tryptophan, a precursor in dopamine and serotonin synthesis (Reference Kantak26,Reference Boadle-Biber44). Interestingly, as previous described, the hypothalamic–pituitary–adrenal axis is hyperactive in depression, and this hyperactivity may be attenuated by Mg administration (Reference Cao and Peng45).
Interestingly, the depressive-like behaviour observed in the present work was associated with an altered GM. An imbalance in GM has been demonstrated to affect both metabolic and mental illnesses (Reference Cryan and O’Mahony24), for example, an altered GM seems to contribute to the development of diseases such as diabetes (Reference Djurhuus, Klitgaard and Beck-Nielsen46,Reference Turnbaugh, Ley, Mahowald, Magrini, Mardis and Gordon47), inflammatory bowel diseases (IBD) (Reference O’Mahony, Marchesi and Scully48,Reference Collins, Verdu, Denou and Bercik49) and depression (Reference O’Mahony, Marchesi and Scully48,Reference Desbonnet, Garrett, Clarke, Kiely, Cryan and Dinan50). Furthermore, the GM composition of dietary un-challenged mice correlated significantly to the behaviour expressed, supporting the GM to affect behaviour. It can be speculated whether MgD diet-induced GM alterations may be involved in mediating the behavioural changes observed or an inflammatory mechanism being involved as well. In addition, it is necessary to be aware of that the FST has a high predictive validity (Reference Cryan, Markou and Lucki51,Reference Petit-Demouliere, Chenu and Bourin52), but a rather limited construct validity (Reference Petit-Demouliere, Chenu and Bourin52). Therefore, supplementary assays of depressive-like behaviour including tail suspension test and anhedonia, measured in the sucrose consumption test, should to be carried out in future studies.
The immune system is compromised when deprived of Mg (Reference Johnson25). In the present study, we observed a strong tendency towards lower hippocampal IL-6, in the MgD mice after 6 weeks. This may result from a decreased metabolic state in cytokine-producing cells when these are deficient in Mg. Previous studies have demonstrated hippocampal IL-6 injections to induce depressive-like behaviour in the FST (Reference Wu and Lin53), thus underlining hippocampal IL-6 to affect behaviour in the FST. Interestingly, the GM of MgD mice correlated significantly to hippocampal IL-6, making the hypothesis that the diet-induced changes in the GM composition alters behaviour through immune-modulation attractive. Furthermore, it has been shown that neuroimmune responses occur during inflammatory events in a mouse model of IBD, suggesting an important role of the gut–brain axis (Reference Baticic, Detel, Kucic, Buljevic, Pugel and Varljen54). However, to conclude on the observations in our study, further investigations are warranted.
Previous studies have demonstrated that deficiency in the energy metabolism may contribute to some of the neurobiological mechanism of depression (Reference Kanarik, Alttoa and Matrov55). In this regard, clinical studies in patients with depression suggest a decrease in brain energy metabolism when Mg concentrations are reduced (Reference Iosifescu, Bolo, Nierenberg, Jensen, Fava and Renshaw56). Similarly, it has also been shown that the level of Mg in the blood may be a causative factor involved in insulin resistance (Reference Moles and McMullen57), and studies in experimental animals have demonstrated that Mg supplementation could prevent the induction of insulin resistance and diabetes mellitus, while Mg deficiency would predispose to hyperglycaemia (Reference Kandeel, Balon, Scott and Nadler58). However, the present work demonstrated that 6 weeks of MgD failed to affect both the glucose and the insulin levels in the GTT. Several reasons for this may exist. It can, for example, be speculated that the MgD diet should have been administered for a longer period for the mice to develop insulin resistance. Further, it still remains uncertain whether the plasma Mg concentration is a marker for insulin resistance or a causative factor and thereby contributing to the development of affective disorders. Hence, though this is hypothetical at the moment, changes in energy metabolism, could perhaps contribute to the neurobiological mechanism leading to increased depressive-like behaviour provoked by the MgD diet.
In conclusion, dietary MgD-induced depressive-like behaviour in mice, and further studies into the effect of MgD on the complex bidirectional microbiota–gut–brain axis are warranted to conclude on the observed association between GM, behaviour and the immune system.
Acknowledgement
The authors thank Heidi Jungland and Elsebeth Hornemann for skilful assistance during the experiments.
Financial Support
The project was supported by the Danish Medical Research Council (grant 11-107897) and the AU-IDEAS initiative (eMOOD).
Conflicts of Interest
G.W. is Editor in Acta Neuropsychiatrica. However, G.W. actively withdrew and was not involved in any decisions related to the present work. G.W. has received honorarium from H.Lundbeck A/S, Astra Zeneca AB, Servier A/S and Eli Lilly A/S. There are no conflicts of interest between the funding bodies and the work presented herein.
Ethical Standards
The authors assert that all procedures contributing to this work comply with the ethical standards of the relevant national and institutional guides on the care and use of laboratory animals.