


The results of the Quebec election held on October 1, 2018, came as a shock. All the polls conducted during the last week before the election had shown a close race between the Liberal party of Quebec (Parti libéral du Québec, or PLQ) and the Coalition Avenir Québec (CAQ). The three main pollsters—Ipsos, Léger and Mainstreet—had estimated the difference between these parties at two percentage points or less. Three polls from other pollsters conducted during the last days of the campaign, two of them with small samples (n = 500), had shown a larger margin (2.6–5 points). However, none of them came close to the election result: a margin of 12.6 points. Therefore, media and academics alike spoke of the “worst score in the history of electoral polls in Quebec.” If we look only at the polls conducted during the last week before an election, including in recent elections in Western countries, the Quebec 2018 score would also be ranked among the worst in the world (Jennings and Wlezien, Reference Jennings and Wlezien2018).
In this article, we make a distinction between polling miss and poll failure. We propose that three criteria need to be met to conclude that there was a poll failure. Using these criteria, we determine whether the Quebec 2018 election was indeed a poll failure, relying on two sources of data. First, we analyze the estimates of the polls conducted during the campaign in order to assess the global performance of the polls. Second, we use the results of a re-contact survey of respondents to the last pre-electoral survey conducted by Ipsos in order to understand whether changes in voter behaviour may explain the performance of the polls. We analyze this poll both at the national and regional level to assess whether voter behaviour is similar across regions and contexts.
Polling Miss or Poll Failure?
“Poll failures” are not new. Some well-known cases have led to in-depth analyses published in reports and major journals, starting with the 1948 US election (Mosteller, Reference Mosteller, Mosteller, Hyman, McCarthy, Marks and Truman1949). More recently, the 1992 UK election (Jowell et al., Reference Jowell, Hedges, Lynn, Farrant and Heath1993) and the 2002 French presidential election (Durand et al., Reference Durand, Blais and Larochelle2004), in particular, were considered major shocks. Other cases—like the 1998 Quebec election (Durand and Blais, Reference Durand and Blais1999; Durand et al., Reference Durand, Blais and Vachon2001, Reference Durand2002), the 2002 Hungarian election (Bodor, Reference Bodor2012) and the 2006 Italian election (Callegaro and Gasperoni, Reference Callegaro and Gasperoni2008)—were less publicized.
What are the factors that lead observers to conclude that there is a poll failure? There are two clear cases. The first—and this is the most common situation—is when the winning side is not the one that the polls forecast to win (for US 1948 and 2016, see Mosteller, Reference Mosteller, Mosteller, Hyman, McCarthy, Marks and Truman1949; Kennedy et al., Reference Kennedy, Blumenthal, Clement, Clinton, Durand, Franklin, McGeeney, Miringoff, Olson, Rivers, Saad, Evans Witt and Wlezien2017, Reference Kennedy, Blumenthal, Clement, Clinton, Durand, Franklin, McGeeney, Miringoff, Olson, Rivers, Saad, Evans Witt and Wlezien2018; for Brexit 2016, see Dunford and Kirk, Reference Dunford and Kirk2016; Duncan, Reference Duncan2016; for France 2002, first round, see Durand et al., Reference Durand, Blais and Larochelle2004; for Australia 2019, see Lewis, Reference Lewis2019). The second is when the story told by the polls was not the one that occurred in the end—that is, the polls predicted a close race and the reverse happened, or vice versa (for Quebec 1998, see Durand et al., Reference Durand, Blais and Vachon2001, Reference Durand2002; for UK 1992 and 2015, see Jowell et al., Reference Jowell, Hedges, Lynn, Farrant and Heath1993; Sturgis et al., Reference Sturgis, Baker, Callegaro, Fisher, Green, Jennings, Kuha, Lauderdale and Smith2016, Reference Sturgis, Kuha, Baker, Callegaro, Fisher, Green, Jennings, Lauderdale and Smith2018; for Hungary 2002, see Bodor, Reference Bodor2012; for Italy 2006, see Callegaro and Gasperoni, Reference Callegaro and Gasperoni2008; for Chile 2017, see Durand et al., Reference Durand, Johnson, Moreno and Traugott2018). However, in some of these cases, analyses show no significant difference between the polls and the vote (for example: Australia 2019, US 2016, Brexit 2016). In other situations, where the discrepancy between the polls and the vote is significant (for UK 1997, see Curtice, Reference Curtice1997; for France 2007, see Durand, Reference Durand2008a, Reference Durand2008b), the polling miss goes undetected because the winner was accurately forecast and the “story” corresponded to the results (Prosser and Mellon, Reference Prosser and Mellon2018).
These recent “failures” may have given the impression that polls have become less reliable. According to Jennings and Wlezien (Reference Jennings and Wlezien2018) and Puleston (Reference Puleston2017), this is not the case. In analyses of over 330 elections in more than 40 countries, they show that, on the contrary, poll error has decreased over the years.
But what exactly is a poll failure? We suggest that the first criterion is that the polls significantly—statistically—err in their prediction of the vote; that is, the election results lie outside the polls’ margin of error or credibility interval (see Baker et al. [Reference Baker, Michael Brick, Bates, Battaglia, Couper, Dever, Gile and Tourangeau2013], who suggest using the term credibility interval when applying the traditional formula for the margin of error to polls conducted using non-probability samples).
The “story” told by the polls leads to a second criterion. All or almost all the polls have to err in the same direction and at a similar level. This latter criterion is essential since it is because all the polls are telling the same story that the polls are blamed for having misled the population.
We need a third criterion to conclude that there was a poll failure. The source of the error has to lie with the polls themselves—that is, their samples, methodology, weighting, likely voter models, question order and so on—which means that we have to rule out the possibility of a last-minute shift among voters. Voter behaviour may indeed explain discrepancies. First, voters may change their minds late, after the last polls were conducted. Second, people who do not reveal their preferences—the “discreet” or non-disclosers—may disproportionately vote for the party that appears underestimated by the polls. Third, those who do not show up to vote may disproportionately be supporters of the party that is overestimated by the polls. If we can show that such behaviour occurred at a level that explains the discrepancy, we cannot dismiss the possibility that the polls were right when they were conducted. Therefore, if we cannot rule out the possibility that voter behaviour is responsible for the discrepancy, we cannot conclude that the polls failed.
If only the first criterion is met—that is, there are significant differences between some polls but not all, or most, of them and the vote—we would call it a pollster failure and look for possible house or mode effects. If the first two criteria are met—that is, there is also systematic poll bias (Prosser and Mellon, Reference Prosser and Mellon2018)—we would call it a polling miss, and we need to look for possible explanations, first in terms of voter behaviour. Finally, a poll failure is a systematic poll discrepancy that cannot be explained by voter behaviour.
How can we determine whether voter behaviour is responsible for a polling miss? Our claim is that only post-electoral surveys among respondents of pre-election surveys can tell whether a late swing or differential non-response or turnout occurred. This type of analysis has been carried out for the UK 2015 (Sturgis et al., Reference Sturgis, Baker, Callegaro, Fisher, Green, Jennings, Kuha, Lauderdale and Smith2016, Reference Sturgis, Kuha, Baker, Callegaro, Fisher, Green, Jennings, Lauderdale and Smith2018) and the Quebec 1998 (Durand et al., Reference Durand, Blais and Vachon2001) elections. In these cases, the authors concluded that voter behaviour did not significantly contribute to error and therefore went on looking for methodological explanations. Only in the UK 1970 election was a late campaign swing large enough to be considered the main reason for the polling discrepancy (Prosser and Mellon, Reference Prosser and Mellon2018). In this article, we examine whether the Quebec 2018 election was a poll failure—that is, a situation where the three criteria (significant difference, generalized bias, absence of differential voter behaviour) are met.
The 2018 Quebec Election: A Polling Miss or a Poll Failure?
We first examine the two criteria necessary to conclude that there was a polling miss: a) whether there is a significant difference between the polls and the vote, and b) whether all the polls erred in the same direction. We then use a re-contact survey to examine whether the third criterion is met—that is, whether late changes in voter behaviour or differential turnout explain the discrepancy.
What do the campaign polls tell us?
Figure 1 shows the evolution of vote intentions for the four main parties over the course of the campaign, as estimated using a local regression (Cleveland and Devlin, Reference Cleveland and Devlin1988; Loader, Reference Loader1999; Jacoby, Reference Jacoby2000). Support for the first three parties did not change much during the campaign. Movement occurred mostly for the fourth party, Québec solidaire (QS), which increased its share of the vote from around 12 per cent to 17 per cent during the campaign. In addition, the distance between the two main parties appeared to decrease, thus narrowing the gap.
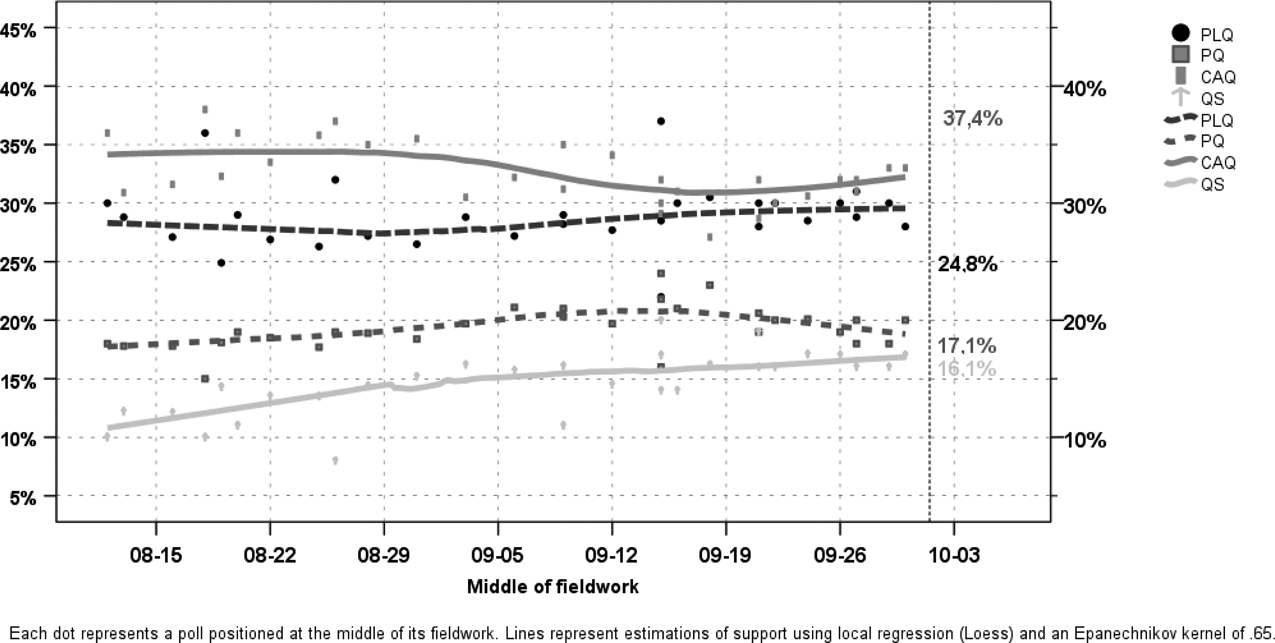
Figure 1 Support for the Main Political Parties during the Campaign
The polls forecast the support for the CAQ at 33 per cent, while it received 37.4 per cent of the vote. On the opposite side, they forecast the support for the PLQ at 30 per cent, while the party received 24.8 per cent of the vote. This was an unexpected result since pollsters and researchers alike had come to expect, based on historical evidence, an underestimation of the PLQ vote (Durand, Reference Durand2002). However, support for the two other parties was almost perfectly estimated. This rings a bell since if methodological factors were at play, we would need to explain why the error occurred only for the two main parties.
The polls conducted during the last week of the campaign
Six polls were conducted during the last week of the campaign, and five of them (the exception is the Angus Reid poll) were published during the campaign. The methods used were diverse. Léger and Angus Reid used their own web panels. Ipsos used a mix of telephone interviews (32%) and web (68%), relying on three different sources for the web sample. Mainstreet and Forum used interactive voice response (IVR). Research Co. used a web panel, with samples provided by the Lucid platform.
A number of measures have been proposed to summarize the level of discrepancy between polls and election results. Mosteller (Reference Mosteller, Mosteller, Hyman, McCarthy, Marks and Truman1949) proposed eight different measures for the US 1948 presidential election. Following Mitofsty's (Reference Mitofsky1998) recommendation, most researchers make sure to present the average absolute error (AAE) between the polls and the vote for the main candidates—M3, in Mosteller's terms—for comparative purposes. More recently, Martin et al. (Reference Martin, Traugott and Kennedy2005) proposed a new measure, A, which is the log of the odds ratio of the estimated vote share of the two leading parties or candidates over their vote share in the election. This measure has two interesting properties: it is comparable between elections, and it is signed in a way that gives an indication of the political bias of the polls (Martin et al., Reference Martin, Traugott and Kennedy2005; Callegaro and Gasperoni, Reference Callegaro and Gasperoni2008; Durand, Reference Durand2008b; Arzheimer and Evans, Reference Arzheimer and Evans2014; Wright et al., Reference Wright, Farrar and Russell2014). Besides, it may be generalized for multiple parties and candidates (for A', see Durand, 2008b; Arzheimer and Evans, 2013; Wright et al., Reference Wright, Farrar and Russell2014). Table 1 shows that the five polls published during the last week of the campaign estimated the difference between the two leading parties—the CAQ and the PLQ—at 2.6 points on average. There is no difference according to the methodology used. However, the two polls conducted during the last weekend of the campaign forecast a larger gap: 3 per cent and 5 per cent, respectively. The Angus Reid poll estimated the gap at 7 points, and its estimation of the PLQ vote was perfect. The election results showed a 12.6-point gap, significantly larger than any of the polls’ estimates. However, the fact that the last polls forecast a larger gap may hint at possible movements at the end of the campaign.
Table 1 Comparison between the Last Published Polls and Election Results
* Estimated from information provided by the firm.
In order to compare like with like, we compare with elections where polls were conducted during the last week before the election. In the Quebec 2018 election, M3 varies between 2.8 and 3.3, for an average of 3.1. In the 2015 UK election, considered a major polling miss, the average M3 statistic for the last week was 2.1 (Sturgis et al., Reference Sturgis, Baker, Callegaro, Fisher, Green, Jennings, Kuha, Lauderdale and Smith2016, Reference Sturgis, Kuha, Baker, Callegaro, Fisher, Green, Jennings, Lauderdale and Smith2018). If we compare within Quebec, the statistic was 2.9 in 1998, a well-known poll failure (Durand and Blais, Reference Durand and Blais1999; Durand et al., Reference Durand, Blais and Vachon2001, Reference Durand, Blais and Vachon2002).
If we now turn to A—the log odds for CAQ over PLQ in the polls and in the election—it varies from −0.25 to −0.38, with a mean of −0.33. All measures are highly significant, and they are all signed in the same direction, confirming the poll bias against the CAQ. Comparing with similar elections and taking only the polls conducted during the last week of the campaign, it was −0.17 for the Conservatives over Labour in the UK 2015 election, as well as for the PLQ over the Parti Québécois (PQ) in the Quebec 1998 election.
The A' measure—the log odds of CAQ versus all the others—also shows a significant difference between the polls and the election outcome, against the CAQ. It varies between −.19 and −.30, for an average of −.23. In comparison, this measure was −.18 for the Conservatives in the UK 2015 election and −.15 for the PLQ in Quebec in 1998. The performance of A' in 2018 is better than that of the Quebec 1998 election because support for two of the four major parties was well estimated in 2018.
In summary, all the measures indicate a major and significant error of the polls. This error is more substantial for the two leading parties, and it is constant across polls. Therefore, our first two criteria—the presence of a significant difference between the polls and the outcome, and the fact that all the polls erred in the same direction—are met. We can conclude that we have a polling miss. We now need to check whether changing voter behaviour explains the discrepancy—that is, whether we have a poll failure.
What does the re-contact survey tell us?
Ipsos Canada conducted its last poll of the campaign between September 26 and 28, 2018, among 1,250 respondents using a data collection method combining web surveys (n = 850) and telephone interviews (n = 400). Following the election, Ipsos cooperated with the authors to conduct a re-contact survey among respondents to the pre-election survey. The re-contact survey was short, with 10 questions pertaining to voting behaviour, timing of the decision and reasons for vote choice. Two-thirds (67.4%) of the pre-election respondents completed the re-contact survey, for a total of 842 respondents, with 492 from the web surveys (a cooperation rate of 69.6%) and 250 from the telephone interviews (62.5%). The surveys were weighted separately according to age group, sex, region (post-stratified), years of schooling and mother tongue. Table A1 in the appendix compares unweighted and weighted pre- and post-election respondents. It shows that, as in many surveys, the less educated and younger respondents were more difficult to reach. Younger respondents were even harder to contact in the post-election survey, which may have implications for the estimation of the vote. However, these differences do not translate into a major difference between the unweighted and weighted samples in terms of voting intention, and there is no significant difference between the pre- and post-election surveys for any of the variables. The ratio of the highest to the lowest weight is rather high—16.9 and 17.3 in the pre- and post-electoral polls, respectively—which is partly due to the necessity to compensate for regional stratification.
Does changing voting behaviour explain the difference between the polls and the vote?
Table 2 compares the pre-election estimates for the total and the post-electoral samples with the election results and the post-election reported vote. While Ipsos, similarly to all other pollsters, anticipated a close race between the two leading political parties in its last pre-election poll (see Table 1), its post-election re-contact poll estimates are much closer to the results. They give an exact estimation of the distance between the two leading parties and the estimates of the vote share are within the margin of error, except for QS.
Table 2 Ipsos Estimates and the Vote

We use these data to combine respondents’ answers to the pre-election and post-election surveys. Table 3 shows these pre- and post-election patterns. Overall, 63 per cent of the respondents reported having voted for the party they intended to vote for. This is 78 per cent of all voting respondents. These stable respondents are distributed almost equally between CAQ voters, PLQ voters and voters for the other parties. We now turn to the three possible explanations relative to voter behaviour that may explain the polling discrepancy. First, 8.2 per cent of the respondents changed their mind and voted for a different party than the one they intended to vote for. More than half of those (56%) reported having voted for CAQ—that is, 4.6 per cent of the respondents (5.7% of voters).
Table 3 Patterns of Pre-election and Post-election Answers

Second, 9.6 per cent of the respondents did not disclose any preference in the pre-election poll but declared a vote for a party after the election. Again, the majority (55%) of these respondents reported having voted for CAQ. This is 5.3 per cent of the respondents (6.6% of the voters).
Finally, the third possible explanation is differential turnout. Using aggregated data at the local level, Durand (Reference Durand2018) showed that turnout was particularly low in the ridings in the West Island of Montreal, where there is a concentration of non-French speakers and PLQ voters. However, the re-contact survey does not show that PLQ voters were more likely to stay home on election day.
This suggests that last-minute changes of mind and the voting behaviour of non-disclosers explain in good part the discrepancy between the polls and the outcome. More than 30 per cent of all declared CAQ voters (in the post-election survey) had reported a preference for another party or were undecided or “discreet” in the pre-election poll. Therefore, we can conclude that there was seemingly a large movement toward that party in the last days of the campaign.
Are respondents’ answers reliable?
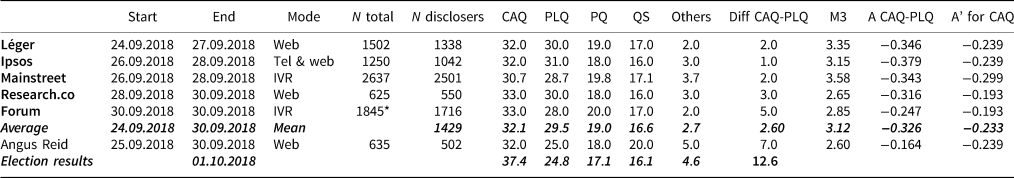
Could it be that people are not telling the truth and just pretend to have rallied behind the winner? This is a common explanation for polling discrepancies. Four pieces of information allow us to probe the reliability of our findings. We examine the respondents’ answers in the pre-election survey about how certain or uncertain they were about their vote choice, as well as their expectations about who would win the election. We also look at their answers in the post-election survey about the timing of their decision and the reasons they give for their vote. The first question that comes to mind is whether the respondents who declare that they changed their mind were unsure about their decision when surveyed before the election. Only those who revealed a preference for a party get to answer this question. Overall, 87.7 per cent were absolutely (58.2%) or fairly (29.4%) sure of their choice in the pre-election poll. This is 89 per cent among the respondents of the post-election poll. Figure 2 shows the answers to this question according to patterns of declaration. Shifting respondents and non-voters were much more likely to state that they were not sure of their choice (χ2 (10) = 108.1, p < .000). Between 3 and 7 per cent of stable voters for the different parties were not sure of their choice. In contrast, defectors (whether to CAQ or to another party) and decided respondents who did not vote were not sure of their choice in proportions varying from 26 per cent to more than 34 per cent. Therefore, those who changed were indeed less certain about their decision, which makes sense.
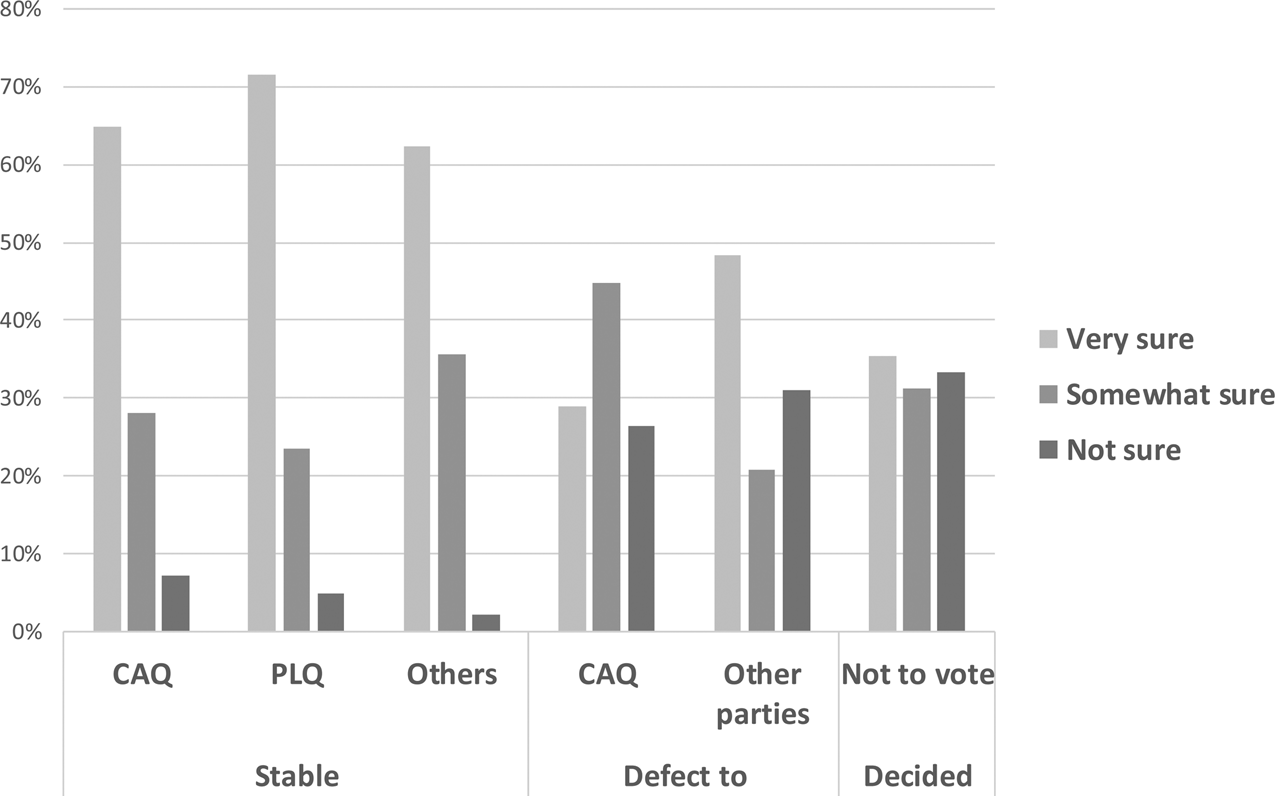
Figure 2 Behaviour on Election Day according to Pre-electoral Certainty of Choice
The pre-election survey also asked the web respondents which party they thought would win the election. Close to two respondents out of five (38.8%) anticipated that CAQ would win the election. This is similar (39.6%) among post-election respondents. There are significant differences in expectations about who is likely to win (χ2 (16) = 344.8, p < .000); however, this difference shows mostly among stable voters for the two leading parties who are more likely to think that their preferred party is going to win. Figure 3 shows that those who defected to CAQ were not more likely to think that CAQ would win the election than those who defected to other parties. The non-disclosers who decided for a party, whether CAQ or another party, are more likely to have said that they did not know who would win.
Figure 3 Behaviour on Election Day according to Perception of Who Is Likely to Win
We also examined whether those who changed their minds or moved from discreet to a specific vote choice made their decision later than stable respondents did. Overall, 21 per cent of the respondents declared having decided during the last weekend before the election and 15 per cent on election day or even in the booth. We consider these respondents as late deciders. There is a significant difference between shifting and stable respondents (χ2 (8) = 86.1, p < .000). As illustrated in Figure 4, shifting respondents, non-disclosers who decided to vote and non-voters were all more likely to report having made their decision late. Among stable respondents, only 20 to 30 per cent decided late, while among other respondents, the proportion varies between 49 and 82 per cent.

Figure 4 Pre-Post Patterns and Timing of Decision
Finally, respondents were asked, in an open-ended question, what was the main reason for their vote. These answers were first coded by Ipsos and then verified by the authors. We focus on three categories: general appreciation of the party (I like the leader, the policies and so forth); change government (get rid of the PLQ, time for change); and no answer/other reasons. The chi-square test for the difference between all the answers and voting behaviour is highly significant (χ2 (72) = 466, p < .000). Figure 5 illustrates that the main reason for the CAQ vote is undoubtedly appetite for change. However, stable CAQ voters were more likely to give this reason for their vote than the shifters or the non-disclosers who finally voted for CAQ.

Figure 5 Reasons for Reported Vote according to Pre-Post Patterns
All these tests indicate that the answers given by our respondents are consistent and reliable—that their reported vote is not the bare illustration of social desirability or willingness to declare having voted for the winner.
Is changing voter behaviour similar in all regions?
This section aims at better understanding and validating whether changing voter behaviour is responsible for the polling discrepancy. We examine whether the pre- and post-election patterns of change are the same in the different regions of Québec. The election results at the regional level are estimated using the data available at the Directeur général des élections du Québec (DGEQ) with the same regional divisions used by the pollsters: Island of Montreal, Montreal suburbs, Quebec City region and rest of Quebec (ROQ). The Island of Montreal is the metropolis. It is characterized by high urban concentration and cultural and ethnic diversity. The Montreal suburbs constitute the rest of the greater Montreal region. Residents are mostly French-speaking. The Quebec City region is the seat of government. It is an urban area characterized by high homogeneity of French-speaking residents. Finally, the rest of Quebec includes all the regions outside the two major cities. It is also mostly French-speaking.
The Island of Montreal voted quite differently than the other regions. It is the only region where the PLQ received the plurality of the votes (43%), and it is also the region where QS got the largest proportion of the vote (22%). In all the other regions, the CAQ was first, with more than 40 per cent of the vote; the PLQ received around 20 per cent; and QS received between 14 per cent and 17 per cent. The PQ received around 12 per cent of the vote on the Island of Montreal and in the Quebec City region and around 20 per cent elsewhere. Turnout on the Island of Montreal (60%) and in the rest of Quebec (66%) was lower than in the Montreal suburbs (69%) and in the Quebec City region (71%).
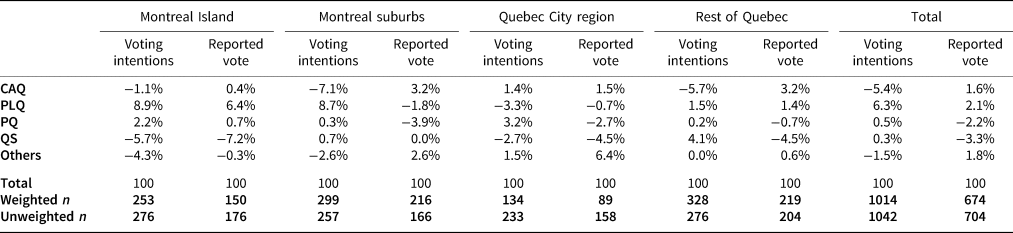
Table 4 shows the difference between voting intentions and reported vote, by region, and the actual outcome. It shows that the underestimation of CAQ support comes solely from the suburbs of Montreal and the rest of Quebec. In both regions, there is a significant difference between voting intentions for CAQ and actual vote. For the PLQ, overestimation is concentrated in the greater Montreal area—that is, in the Island of Montreal and the Montreal suburbs. The reported vote corrects the underestimation of the CAQ vote in the Montreal suburbs and in the rest of Quebec as well as the overestimation of the PLQ vote in the Montreal suburbs. It does not correct the discrepancy between the estimates and the outcome on the Island of Montreal. The underestimation of the QS vote in the post-election poll is present in three out of four regions, which may be related to the difficulty of reaching young voters. Finally, in the Quebec City region, the vote was well estimated in the pre-election and post-election surveys.
Table 4 Comparison of Voting Intentions, Reported Vote and Election Results
What does this mean for movements between parties and from non-disclosers? As expected, there is a significant difference between regions (χ2 (24) = 104.4, p < .000). Given the sample size, only some of the differences are significant. Table 5 shows that stability between voting intentions and the vote cast was higher in the Quebec City area, in favour of the CAQ, and on the Island of Montreal, in favour of the PLQ.
Table 5 Regional Patterns of Change between Pre-electoral and Post-electoral Polls

Movements toward the CAQ are more frequent in the Montreal suburbs, and shifts from non-disclosers to vote for the CAQ were more likely in the rest of Quebec.
We conclude that the patterns that we have seen at the national level do not translate in the same way in the different regions. The polls missed the target mostly in the regions where there were disproportionate movements toward the CAQ from decided or discreet respondents—that is, in the Montreal suburbs and the rest of Quebec. In the Quebec City region, the polls were right from the beginning; on the Island of Montreal, they were wrong and stayed wrong. The incorrect estimation on the Island of Montreal is not explained by movement and therefore could be due to methodological features—possibly differential turnout. It goes in the same direction as the conclusion reached by Mellon and Prosser (Reference Mellon and Prosser2017) for the UK 2015 election concerning missing non-voters.
Overall, we end up with three different situations. In the Quebec City region, there is no error in the polls. In the Montreal suburbs and in the rest of Quebec, there is a polling miss but not a poll failure. However, the polling misses seem due to different shifts in voter behaviour in the two regions. Finally, on the Island of Montreal, we conclude that there was a poll failure: both the pre-election and the post-election surveys show a significant discrepancy between the polls and the vote, and no shift in voter behaviour explains the difference.
Conclusion
Every polling error teaches us something about the polls’ possible biases and about the dynamics of electoral campaigns. Since polling methodology is currently undergoing a major transformation and diversification (Prosser and Mellon, Reference Prosser and Mellon2018), it is important to understand what happened in Quebec: whether the polls are the cause of the polling error or whether voter behaviour is the culprit.
We have shown that the Quebec 2018 election is a polling miss since the two essential criteria—a significant difference between the polls and the vote, and a systematic bias from all the pollsters—are met. However, contrary to other elections (Quebec in 1998 and the UK in 2015) where re-contact surveys were conducted to assess whether voter behaviour may explain the discrepancy, the Quebec 2018 election does not globally qualify as a poll failure. The difference between the polls and the vote is mostly explained by last-minute movements toward the underestimated party, combined with a tendency of non-disclosers to vote disproportionately for that same party. We have also shown that there are regional differences in these movements. This is a unique contribution since, to our knowledge, no other analysis of polling errors has examined regional patterns. These patterns lead to the conclusion that changes in voter behaviour in two specific regions, which were outside the two major cities, explain most of the polling discrepancy. However, the estimates for the Island of Montreal are off target before and after the election, which implies that methodological factors are at play—that is, that the polls failed on the Island of Montreal.
The answers that respondents gave to other questions regarding the certainty and timing of their decision, as well as the reasons for their reported vote choice, corroborate our analyses. A will for change indeed characterized this election, after 15 years of almost continuous PLQ government, and the CAQ came to represent, especially in the last moments of the campaign, the vehicle for change.
There are some limits to this analysis. First, we would have liked to have multiple re-contact surveys in order to confirm our results. Sturgis et al. (Reference Sturgis, Baker, Callegaro, Fisher, Green, Jennings, Kuha, Lauderdale and Smith2016, Reference Sturgis, Kuha, Baker, Callegaro, Fisher, Green, Jennings, Lauderdale and Smith2018), for example, could count on five re-contact surveys for their analysis of the UK 2015 election. However, the re-contact survey conducted by another firm, Leger360, is consistent with our findings (Léger, Reference Léger2018). Second, a larger sample size and a better cooperation rate would also have been preferable.
In a world of voter volatility, it seems that voters may decide on their vote at the last minute. We may, of course, attribute these changes to various events that occurred during the last days of the campaign, but this is a posteriori speculation. In such an environment, what are the pollsters supposed to do? How can they forecast the vote? The last Quebec election is full of lessons. First, pollsters should poll later in the campaign. Second, pollsters and the media alike should inform the public that voter behaviour has become more difficult to predict.
Finally, researchers have a dual responsibility. On the one hand, they need to stress that the polls are right most of the time: polls usually accurately forecast the outcome of an election. However, they also need to remind people that errors do occur: polls should be trusted but with a good dose of skepticism.
Acknowledgments
We wish to thank the reviewers for their very relevant comments and suggestions that greatly helped improve this article. We also wish to thank Ipsos Canada for their professional and financial contribution. The Social Sciences and Humanities Research Council (SSHRC), grant 435-2014-0077, and the Faculté des arts et des sciences, Université de Montréal, also contributed financially to this research. Finally, we wish to thank Philippe J. Fournier (Qc125) for his collaboration.
Appendix
Table A1 Comparison between Pre-electoral and Post-electoral Respondents - Recontact Survey


