Introduction
The iron ore deposits in the Middleback Range of South Australia, have been worked since the early 1900s. They were first developed by Broken Hill Proprietary Limited as a source of flux for the lead smelting works at Port Pirie and later mined as a source of iron ore for steel making. Iron Monarch is the largest of the deposits, having produced over 150 million tons of ore. The principal ore mineral is hematite, which grades into siliceous banded iron formation (Milnes, Reference Milnes1954). The upper part of the deposit also contains large lenses of manganese oxides, principally pyrolusite and hausmannite. The presence of manganese with small amounts of copper, zinc, bismuth, silver, phosphorous, arsenic and other elements has led to an unusually diverse mineralogy. Collecting from the 1960s to the 1990s has resulted in more than 160 mineral species being recorded (Francis, Reference Francis2010), and to date, six new mineral species have been described from Iron Monarch. Specimens of the new mineral species middlebackite were recovered from a one metre-sized quartz boulder found on RL160, on the southern side of the quarry in June 1990 (Francis, Reference Francis2010). The boulder is considered most probably to have originated from RL247 about one metre below surface. Initial investigations of the mineral showed the presence of Cu and a trace of Zn and the powder x-ray pattern could not be matched to any known mineral or synthetic compound. The mineral was mentioned as unnamed mineral UK05, a possible Cu carbonate or nitrate, by Pring et al. (Reference Pring, Kolitsch and Francis2000) and Francis (Reference Francis2010). The recent structure refinement of the mineral using synchrotron X-ray diffraction data has enabled its full characterisation as a new Cu oxalate species. The mineral and its name have been approved by the International Mineralogical Association Commission of New Minerals, Nomenclature and Classification (IMA2015-115; Elliott, Reference Elliott2016). Holotype material is preserved in the South Australian Museum, Adelaide, South Australia (Registration number G34300). The mineral is named for the Middleback Range, in which Iron Monarch is situated.
Occurrence
Iron Monarch is a large sedimentary iron ore deposit of Precambrian age. During its geological history the deposit has been folded gently and intruded by dolerite dykes. The secondary minerals at Iron Monarch have formed during Tertiary and post-Tertiary weathering of the deposit at low temperature due to the interaction of basic fluids with hausmannite under changing pH conditions (Pring and Birch, Reference Pring and Birch1993). These elements were mobilised into groundwaters during weathering processes. The secondary minerals precipitated from these fluids into fractures and joint planes in the orebody. The quartz boulder that contained the middlebackite has yielded a total of 50 mineral species, including sulfides (bornite, chalcocite, chalcopyrite, covellite, bismuthinite, pyrite, galena and sphalerite) and secondary minerals of Cu, Zn, Pb and Bi. On the type specimen, middlebackite occurs in seams in a matrix composed of quartz and minor goethite. Associated minerals are atacamite and mottramtite. Middlebackite has formed in a near surface environment at low temperature. A source of oxalate was probably decaying organic matter. Copper was derived from weathering of Cu sulfides with dissolution of Cu possibly facilitated by oxalic acid.
Appearance, physical and optical properties
Middlebackite forms as aggregates of blue prismatic crystals up to 0.3 mm across (Fig. 1). Individual crystals are up to 0.05 mm long. Crystals are translucent with a vitreous lustre. The mineral has a pale blue streak. The Mohs hardness is ~2. Crystals of middlebackite are brittle with one perfect cleavage and uneven fracture. The density could not be measured due to the limited availability of material. The calculated density is 3.64 g cm–3 based on the empirical formula. Optically, middlebackite is biaxial (+), with α = 1.663(4), β = 1.748(4) and γ = 1.861(4) (measured in white light). The calculated 2V is 86.7°. Dispersion is slight, r > v. The mineral is pleochroic with X = colourless, Y = very pale blue and Z = dark sky blue; Z > Y > X. The Gladstone–Dale compatibility, 1 – (K P/K C), is 0.011 based upon the empirical formula, in the range of superior compatibility (Mandarino, Reference Mandarino1981).
Fig. 1. Groups of middlebackite crystals (blue) associated with atacamite (green) on quartz. The field of view is 1.1 mm across. Specimen in private collection.
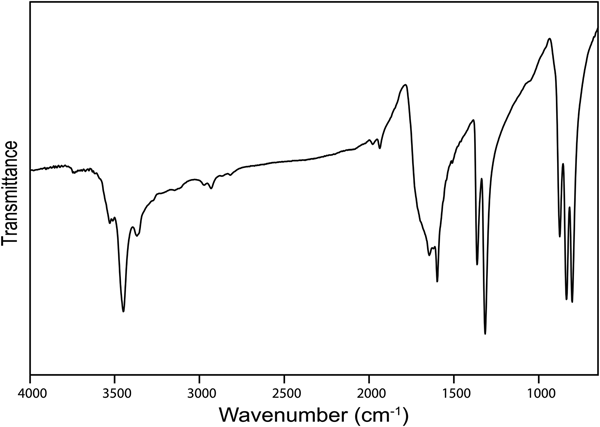
Infrared spectroscopy
The infrared (IR) spectrum (Fig. 2) of powdered middlebackite in the range 4000 to 650 cm–1 was obtained using a Nicolet 5700 FTIR spectrometer equipped with a Nicolet Continuum IR microscope and a diamond-anvil cell. The IR spectrum of middlebackite demonstrates strong bands due to carboxylate groups. Bands at 1599 cm–1 and 1645 cm–1 can be assigned to in-phase and out-of-phase antisymmetric stretching vibrations of carboxylate groups and bands at 1365 and 1316 cm–1 to their in-phase and out-of-phase symmetric stretching vibrations. Bands in the range 800 to 900 cm–1 may be assigned to in-plane bending vibrations of carboxylate groups. The observation of three bands, at 876, 835 and 804 cm–1, instead of the two expected due to the oxalate anion having two bending degrees of freedom suggests that one band could be assigned to Cu···O–H bending vibrations. Weak bands in the range from 1800 to 3200 cm–1 may correspond to overtones and combination modes. The spectrum shows a prominent sharp peak at 3448 cm–1 that can be attributed to the ν O–H stretching vibration of the hydrogen-bonded OH group. According to the empirical relation given by Libowitzky (Reference Libowitzky1999), this frequency corresponds to a donor–acceptor O···O separation of ~2.85 Å. The refined structure shows a separation of 2.890 Å. Smaller peaks at 3528, 3510 and 3369 cm–1 could represent overtones of carboxylate stretching vibrations.
Fig. 2. The Fourier-transform IR spectrum of powdered middlebackite.
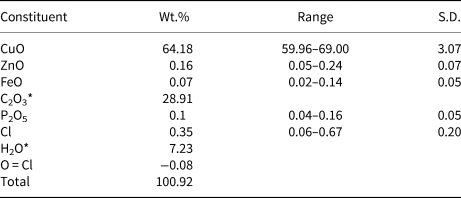
Chemical analysis
Chemical analyses were carried out using a Cameca SXFive electron microprobe (energy dispersive spectroscopy mode, 15 kV, 15 nA and a defocused 20 µm beam diameter). The following standards and X-ray lines were used: almandine (FeKα), chalcopyrite (CuKα), willemite (ZnKα) and apatite (PKα). No additional element with atomic number ≥9 was detected in amounts >0.05 wt.% oxide. Data were processed using the (φρZ) correction procedure of Pouchou and Pichoir (Reference Pouchou, Pichoir and Armstrong1985). Analytical data are given in Table 1. The presence of oxalate anions and OH were confirmed by infrared spectroscopy (Fig. 2) and by the crystal-structure analysis. The empirical formula, based on six oxygen atoms per formula unit, and with C2O3 and H2O calculated from the ideal formula is Cu2.00(C2O4)Cl0.02(OH)1.98. The simplified formula is Cu2C2O4(OH)2, which requires CuO 63.86, C2O3 28.91, H2O 7.23; total 100.00 wt.%.
Table 1. Compositional data for middlebackite.
Note: Number of analyses = 6; S.D. – standard deviation
* C2O3 and H2O calculated from the ideal formula.
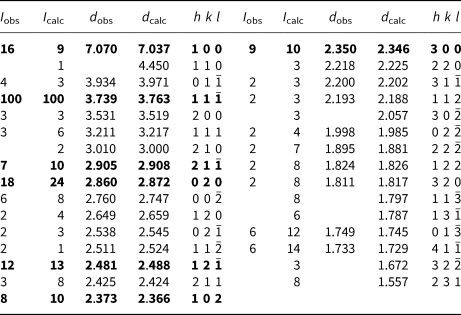
Powder X-ray diffraction
Powder X-ray diffraction data (Table 2) were collected using a Rigaku Hiflux Homelab diffractometer (CuKα X-radiation, λ = 1.541870 Å). Calculated intensities were obtained from the structural model using the program UNITCELL (Holland and Redfern, Reference Holland and Redfern1997). Unit-cell parameters refined using the Le Bail profile-fitting method (Le Bail et al., Reference Le Bail, Duroy and Fourquet1988, Hunter, Reference Hunter1998) and starting from the unit-cell parameters determined from the single-crystal study, are a = 7.282(1), b = 5.707(1), c = 5.693(1) Å, β = 104.51(2)° and V = 229.05(5) Å3. These values show good agreement with the single-crystal values.
Table 2. Powder X-ray diffraction data for middlebackite.
Notes: Calculated intensities were obtained using the program LAZY PULVERIX (Yvon et al., Reference Yvon, Jeitschko and Parthé1977); the strongest lines are given in bold.
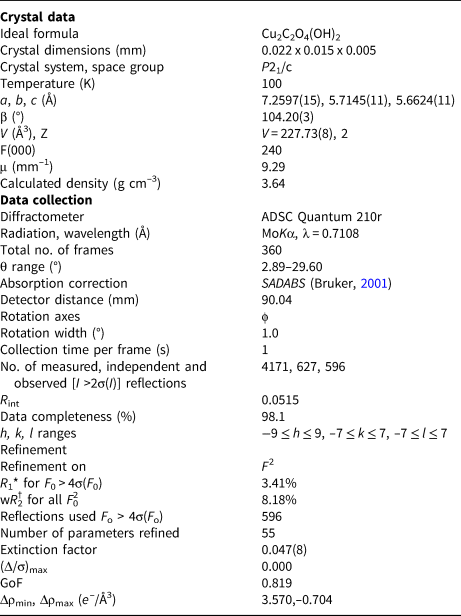
Structure determination
Single-crystal X-ray data collection and structure solution
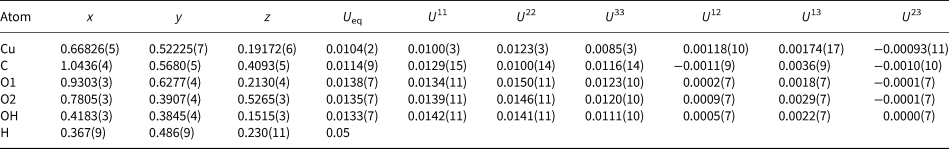
Single-crystal X-ray diffraction data were obtained at the micro-focus macromolecular beam line MX2 of the Australian Synchrotron. Data were measured with an ADSC Quantum 210r detector using monochromatic MoKα X-radiation (λ = 0.710800 Å), on a crystal 22 µm ×15 µm ×5 µm in size. A total of 4171 intensities were collected using a ɸ scan with frame widths of 1°, a counting time per frame of 1 s and a crystal-to-detector distance of 90.04 mm. The intensity data sets were processed using XDS (Kabsch, Reference Kabsch2010) with absorption correction and scaling completed using SADABS (Bruker, Reference Bruker2001) resulting in 627 unique reflections, 596 of which were above |F o| > 4σ|F|. Systematic absences were consistent with space group P21/c. The Cu atom was located during initial structure solution by direct methods using SHELXS-97 (Sheldrick, Reference Sheldrick2015) within the WinGX program suite (Farrugia, Reference Farrugia2012). The C atom and all O atoms were then located via subsequent difference-Fourier syntheses during the refinement, performed using SHELXL-97 (Sheldrick, Reference Sheldrick2015). All sites refined to full occupancy. The position of the H atom of the OH group were derived from difference-Fourier syntheses and its position refined freely with a fixed isotropic displacement (U iso = 0.05). The final model with anisotropic-displacement parameters for all non-H atoms refined to an R 1 index of 3.41%. Details of data collection and structure refinement are provided in Table 3. Fractional coordinates and atom displacement parameters are provided in Table 4, selected interatomic distances in Table 5 and bond valences in Table 6. The crystallographic information file has been deposited with the Principal Editor of Mineralogical Magazine and is available as Supplementary material (see below).
Table 3. Crystal data, data collection and refinement details.
*R 1 = Σ||Fo| – |Fc|| / Σ|Fo|
†wR 2 = Σw(|Fo|2 – |Fc|2) 2 / Σw|Fo|2)1/2; w = 1/[σ2(Fo2) + (0.042 P)2 + 12.60 P];
P = ([max of (0 or F 02)] + 2Fc2)/ 3
Table 4. Fractional atomic coordinates and displacement parameters (in Å2) for for middlebackite.
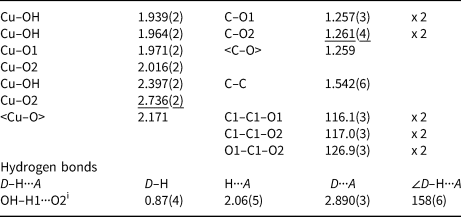
Table 5. Selected interatomic distances (Å), angles (°) and hydrogen bonds for middlebackite.
Symmetry code: (i) –x + 1, –y + 1, –z + 1.
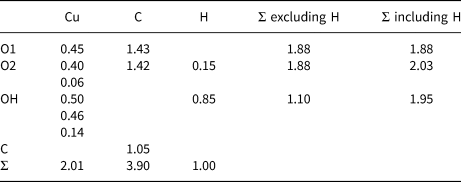
Table 6. Bond valence* (valence units) details for middlebackite.
*Note: Bond-valence parameters used are from Brown and Altermatt (Reference Brown and Altermatt1985).
Description of the crystal structure
The crystal structure of middlebackite (Fig. 3) comprises sheets consisting of edge- and corner-sharing octahedra parallel to the bc plane. [CuO3(OH)3] octahedra share OH–OH edges to form [Cu2O6(OH)4] dimers. Dimers link via corners, through O2 and OH, along [011] and along [01![]() $\bar{1}$]. Sheets link in the a direction via oxalate anions (Figs 4a and 7a). The Cu octahedron (Fig. 5) is strongly Jahn-Teller (4 + 2) distorted (Jahn and Teller, Reference Jahn and Teller1937; Eby and Hawthorne, Reference Eby and Hawthorne1993; Burns and Hawthorne, Reference Burns and Hawthorne1996) four short Cu–O bond lengths lie in the range 1.939 to 2.016 Å with apical O atoms at distances of 2.397 and 2.736 Å (Table 5). The bond-angle distortions are minor: the angle values showing the maximum deviations from the ideal 90 and 180° angles are 95.97 and 171.53°. The OH group is bonded to the Cu cation via two equatorial bonds and one apical bond. The H atom donates one hydrogen bond to the O2 anion at a distance of 2.06(5) Å and an OH–H1···O(2) angle of 158(6)°.
$\bar{1}$]. Sheets link in the a direction via oxalate anions (Figs 4a and 7a). The Cu octahedron (Fig. 5) is strongly Jahn-Teller (4 + 2) distorted (Jahn and Teller, Reference Jahn and Teller1937; Eby and Hawthorne, Reference Eby and Hawthorne1993; Burns and Hawthorne, Reference Burns and Hawthorne1996) four short Cu–O bond lengths lie in the range 1.939 to 2.016 Å with apical O atoms at distances of 2.397 and 2.736 Å (Table 5). The bond-angle distortions are minor: the angle values showing the maximum deviations from the ideal 90 and 180° angles are 95.97 and 171.53°. The OH group is bonded to the Cu cation via two equatorial bonds and one apical bond. The H atom donates one hydrogen bond to the O2 anion at a distance of 2.06(5) Å and an OH–H1···O(2) angle of 158(6)°.
Fig. 3. The sheet of [CuO3(OH)3] octahedra in the crystal structure of middlebackite. All structure drawings were completed with ATOMS (Dowty, Reference Dowty1999).
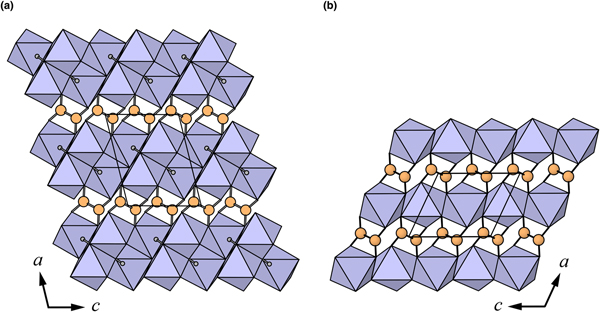
Fig. 4. The crystal structures of: (a) middlebackite; (b) moolooite viewed along [010]. The unit cells are outlined.
Fig. 5. Coordination of the Cu site in middlebackite showing Cu–O bond lengths in angstroms, Å.
Discussion
Oxalic acid is ubiquitous in natural environments (e.g. Franceschi and Nakata, Reference Franceschi and Nakata2005; Fomina et al., Reference Fomina, Hillier, Charnock, Melville, Alexander and Gadd2005) however, oxalate compounds are very rare in the geological environment. Oxalate minerals contain various cations such as Na, Ca, Al, Mg, transition metals and rare-earth elements. There are 20 minerals containing the oxalate anion, eight of which contain transition metals (Fe, Mn and Cu). Environments in which transition metal oxalate minerals occur include guano deposits, coal deposits, metal ore deposits and pegmatites. Middlebackite is the second Cu oxalate mineral after moolooite, CuC2O4, (Clarke and Williams, Reference Clarke and Williams1986; Christensen et al., Reference Christensen, Lebech, Andersen and Grivel2014). Other Cu-bearing oxalates known in nature are antipinite, KNa3Cu2(C2O4)4, (Chukanov et al., Reference Chukanov, Aksenov, Rastsvetaeva, Lyssenko, Belakovskiy, Färber, Möhn and Van2015) and wheatleyite, Na2Cu(C2O4)2·2H2O (Rouse et al. Reference Rouse, Peacor, Dunn, Simmons and Newbury1986). Middlebackite is only the third known anhydrous oxalate mineral along with natroxalate, Na2(C2O4), (Khomyakov, Reference Khomyakov1996) and antipinite and is the only organic mineral to contain an OH group that is not part of a complex organic anion. Of the transition metal oxalate minerals, only middlebackite and antipinite have had their structures refined using natural material due to the difficulty in acquiring good-quality crystals.
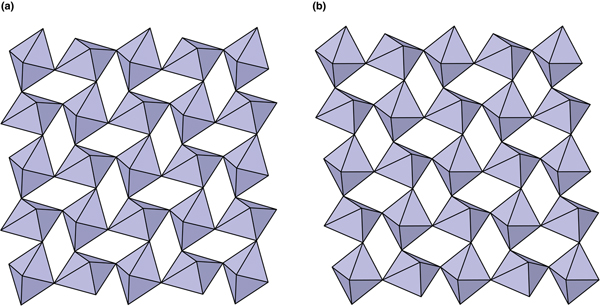
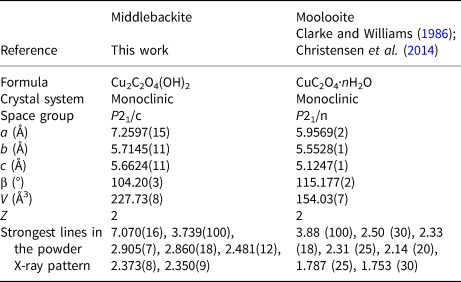
The crystal structures of middlebackite and moolooite are closely related. Crystallographic data are given in Table 7. The structure of moolooite (synthetic) was refined from synchrotron powder X-ray and neutron powder diffraction data by Christensen et al. (Reference Christensen, Lebech, Andersen and Grivel2014). Both structures contain one Cu and one C site, however, whereas moolooite has two O sites, an additional OH site is present in the middlebackite structure. Calculation of bond-length distortion parameters (Renner and Lehmann, Reference Renner and Lehmann1986) indicates that the Cu site in middlebackite is more strongly distorted than the site in moolooite with values of 12.704 and 9.872, respectively. The difference is mostly produced by the long apical bond Cu−O2 distance in middlebackite. Both structures are based on sheets of Cu octahedra. Linkage of the octahedra parallel to the sheet via corner-sharing is topologically identical in both structures (Figs 6). The structures differ, however, in that the sheet in middlebackite can be described as a double sheet, comprising two sheets linked via edge-sharing between octahedra. In both structures, linkage between sheets is via the C2O4 groups that link to the short O1–O2 edge of the Cu octahedron (Figs 4 and 7).
Fig. 6. The crystal structures of: (a) middlebackite; (b) moolooite showing the linkage of octahedra in the bc plane.
Fig. 7. The crystal structures of: (a) middlebackite; (b) moolooite viewed along [001]. The unit cells are outlined.
Table 7. Comparison of crystallographic data for middlebackite and moolooite.
The Cu oxalate minerals moolooite and antipinite from their type localities were produced by the interaction of oxalic acids from guano with copper sulfide minerals (Clarke and Williams Reference Clarke and Williams1986; Chukanov et al., Reference Chukanov, Aksenov, Rastsvetaeva, Lyssenko, Belakovskiy, Färber, Möhn and Van2015). The area in the Iron Monarch quarry that was most likely the source of the boulder that contained middlebackite was mined out many years ago (Francis, Reference Francis2010) and the source of oxalate is not known for certain. The mineral was formed in a near surface environment and there are several possible sources of oxalate. Oxalate is produced by some plants, fungi and lichens (e.g. Dutton and Evans, Reference Dutton and Evans1996; Prieto et al., Reference Prieto, Silva, Rivas, Wierzchos and Ascaso1997) and lichens and fungi living on mineral surfaces have been found to facilitate the dissolution of heavy metals (Chisholm et al. Reference Chisholm, Jones and Purvis1987; Fomina et al. Reference Fomina, Hillier, Charnock, Melville, Alexander and Gadd2005).
Supplementary material
To view supplementary material for this article, please visit https://doi.org/10.1180/mgm.2018.136
Acknowledgements
Ben Wade of Adelaide Microscopy, The University of Adelaide is thanked for assistance with the microprobe analysis. The infrared spectrum was acquired with the assistance of the Forensic Science Centre, Adelaide. The single-crystal x-ray data set was collected at the microfocus beam line MX2 at the Australian Synchrotron. The manuscript benefitted greatly from reviews by Mark Cooper, Peter Leverett and an anonymous reviewer.