


1. INTRODUCTION
Economic and social progress is closely related to advances in human capital. In economics, numerous theoretical and empirical studies have stressed its relevance for economic growth (Romer Reference Romer1986; Lucas Reference Lucas1988; Mankiw et al. Reference Mankiw, Romer and Weil1992; Barro Reference Barro2013; Gennaioli et al. Reference Gennaioli, La Porta, Lopez-De-Silanes and Shleifer2013). In economic history, however, there is an intense debate about the role played by human capital. While some authors claim that human capital (or at least the upper tail of the knowledge distribution) made a significant contribution to economic growth (Mokyr Reference Mokyr2009; Mokyr and Voth Reference Mokyr, Voth, Broadberry and O'Rourke2010; Galor Reference Galor, Hanushek, Machin and Woessmann2011), other works are less optimistic (Mitch Reference Mitch and Mokyr1993, Reference Mitch and Mokyr1999, Reference Mitch, Floud and Johnson2004; Allen Reference Allen2003; McCloskey Reference McCloskey2010).
Human capital, however, constitutes a broad and complex concept (Goldin Reference Goldin, Diebolt and Haupert2015). It comprises health, cognitive abilities, knowledge, physical skills and even behavioural traits. Notwithstanding the fact that it is not easy to find indicators that properly measure human capital, contemporary indicators usually include information on educational attainments, school enrolment rates or years of schooling, to mention only a few. Yet, for historical periods, such information is scarce or non-existent. Population censuses, for instance, provide information on literacy rates from the mid-19th century but, in order to proxy literacy for previous periods, researchers have often relied on the ability to sign official documents such as marriage registers (Cipolla Reference Cipolla1969; Allen Reference Allen2003; Reis Reference Reis, Allen, Bengtsson and Dribe2005)Footnote 1.
Still, even literacy is a broad and complex concept (Graff Reference Graff1987). Though defined as having the ability to read and write, there might be qualitative differences across literates which are unmeasurable, and hence neglected in quantitative analyses. This is particularly relevant when literacy, as a proxy for human capital, is related to economic development (García Abad et al. Reference García Abad, Pareja Alonso and Zarraga Sangroniz2007; González Portilla and Urrutikoetxea Lizarraga Reference González Portilla and Urrutikoetxea Lizarraga2016). In order to shed further light on these issues, much recent literature has proposed the broadening of the number of indicators by constructing historical numeracy indices as a complementary measure of human capital.
It is argued that the ability to understand and work with numbers, or numeracy, might be even more crucial for economic development than literacy (Crayen and Baten Reference Crayen and Baten2010a). In order to capture this skill—and thus human capital in a broader sense—a growing number of studies have compiled historical data from several distinct sources to compute the prevalence of age-heapingFootnote 2. Following this line of enquiry, this study first calculates age-heaping in Spain with the information reported in the population censuses. Spanish population censuses provide summary tables with the number of individuals, men and women, in each province by their exact age. Furthermore, information about the ability to read and write of all these individuals is also provided, which permits the computation of literacy rates.
Comparing both proxies allows a better understanding of the evolution of human capital in Spain in a period marked by profound socioeconomic transformations, namely the late 19th and the early 20th century. In this regard, socioeconomic change could have encouraged investment in particular skills which were not so much in demand in a preindustrial, or traditional, society. Similarly, greater numeracy and literacy could also have stimulated technological and socioeconomic change. The analysis of the complex relationship between human capital and economic development requires a conceptual framework. For the Basque Country, for instance, González Portilla and Urrutikoetxea Lizarraga (Reference González Portilla and Urrutikoetxea Lizarraga2016) proposed an evaluation of this relationship in stages. First, a starting point, around 1877-87, which reflected the legacies of the past. Then, the turn of the 20th century, in which some signs of change emerged, and finally the period from 1900 to 1930 in which human capital and economic development went hand in hand.
In this study, we follow a similar approach and contextualise the findings bearing in mind that socioeconomic change occurred more rapidly during the period 1900-30. Our results show that age-heaping remained relatively unchanged until the early 20th century whereas literacy gradually improved, albeit modestly. Furthermore, the level of age-heaping during the second half of the 19th century seemed, in some cases, abnormally low. Prior to the arrival of modern economic growth, age-heaping was practically inexistent in some territories. Lastly, we find no differences in age-heaping between men and women, which raises concerns about the data collection process given the sizable gender gaps in literacy. Our work also points to another technical issue: in Spain, age-heaping derived from population censuses emerges due to a preference for rounding ages in multiples of 10 (and does not exhibit a preference for ages ending in 5).
The rest of the paper is structured as follows. In section 2, a brief historical background is presented. The concept of age-heaping is defined and discussed in section 3 and the methodology and data are introduced and explained. The descriptive analysis for Spain is presented in section 4, while section 5 focuses on the results obtained for age-heaping at a regional level (provinces). Section 6 provides a discussion of our main findings and section 7 summarises and concludes.
2. HISTORICAL BACKGROUND
The transition from the Ancient Régime to a liberal state in Spain was plagued with difficulties both in terms of recurrent political conflict and social unrest (Calatayud et al. Reference Calatayud, Millán, Romeo, Calatayud, Millán and Romeo2016). From an economic perspective and compared with its European counterparts, Spain underwent a rather slow industrialisation process and it was only after WWI when GDP growth rates showed a substantial increase (Prados de la Escosura Reference Prados De La Escosura2017). In 1910, Spain was still an agrarian economy, where roughly 66 per cent of the labour force was involved in agriculture (Nicolau Reference Nicolau, Carreras and Tafunell2005).
Still, this overall picture hides substantial regional differences. For example, Catalonia, the Basque country and the capital region of Madrid, made considerable advances. In the first two territories, industrial development and structural change characterised the late 19th and early 20th centuries (Carreras Reference Carreras1990). In Barcelona, the labour force employed in industrial activities increased rapidly between 1877 and 1930 (being close to 60 per cent of the total active population in 1930). Similarly, in the Basque provinces of Guipúzcoa and Vizcaya, industrial employment tripled, reaching almost 40 per cent of total employment. Likewise, this period witnessed the emergence of the capital city of Madrid, which essentially resulted from the expansion of the manufacturing, construction and service sectors. In short, by 1930, while their population represented 11.8, 3.8 and 5.9 per cent of Spain, Catalonia, the Basque Country and Madrid contributed 34.6, 9.2 and 9.3 per cent to the industrial output, respectively (Tirado and Martinez-Galarraga Reference Tirado and Martinez-Galarraga2008). As a result, these diverging paths led to an upswing in regional income inequality during the early stages of modern economic growth (Rosés et al. Reference Rosés, Martinez-Galarraga and Tirado2010).
In a context of economic backwardness and sociopolitical instability, education was a source of concern for the successive liberal governments throughout the 19th century. The first national law of education (Ley de Instrucción Pública, known as the Moyano Act) was passed in 1857. The Moyano Act established compulsory schooling for children aged 6-9 years, but funding relied on local councils. Primary schooling thus depended on local demandsFootnote 3. The lack of or slow progress in terms of literacy witnessed in the second half of the 19th century led to the creation of the Ministerio de Instrucción Pública y Bellas Artes in 1900 (Núñez Reference Núñez1991).
Accordingly, literacy rates in 1870 were indeed rather modest. While in Germany or the United Kingdom, around 80 per cent of the adult population could read and write, literacy rates were around 30 per cent in Spain and Italy (Crafts Reference Crafts1997; Pamuk and Van Zanden Reference Pamuk, Van Zanden, Broadberry and O'Rourke2010). This figure is slightly lower if we consider the population census of 1860. In that year, only 26 per cent of the population above 10 years reported that they were able to read and write, an average that hides a significant gap between men and women (Núñez Reference Núñez, Jerneck, Morner, Tortella and Akerman2005)Footnote 4. Things were not much better regarding years of schooling. In 1870, the average number of years of schooling in Spain was 1.5, well behind other Western European countries such as Switzerland (6.1 years), Germany (5.4), France (4.1) or the United Kingdom (3.6)Footnote 5.
This backwardness hides, nonetheless, large regional differences. A dual structure existed with the northern provinces reaching higher literacy rates than those in the south (Núñez Reference Núñez1992). In 1860, literacy rates in provinces such as Almería (south) were only 14 per cent, but in Álava (north) 53 per cent of the population above the age of 10 was able to read and write. It has been argued that the existence of marked regional differences mimicked the unequal structure of access to land and could be one of the main reasons for the uneven development within Spain (Núñez Reference Núñez1992; Núñez and Tortella Reference Núñez and Tortella1993; Beltrán Tapia Reference Beltrán Tapia2013; Beltrán Tapia and Martinez-Galarraga Reference Beltrán Tapia and Martinez-Galarraga2018)Footnote 6.
3. METHODOLOGY, DATA AND SOURCES
Self-reported age regularly appears in parish and military records, tax rolls, civil and legal documents, passenger lists, and population censuses. Age, however, has often been misreported because of custom and tradition, poor numeracy skills, or a badly designed and executed data collection processFootnote 7. Digit preference for numbers ending in 0 and 5, as well as an aversion to certain digits such as 4 and 13, has been extensively documented in economic and social history (A'Hearn et al. Reference A'hearn, Baten and Crayen2009; Crayen and Baten Reference Crayen and Baten2010a; Szoltysek et al. Reference Szoltysek, Poniat and Gruber2017). In doing so, researchers have used a battery of tools to gauge age-heapingFootnote 8.
3.1 Methodology
One of the simplest approaches to assess age-heaping is the Whipple index, which assumes that respondents are uniformly distributed over a specified age range. Suppose we know the number of individuals aged 23-62, where P 23 stands for the total number of respondents who reported an exact age of 23. If respondents were uniformly distributed, no preference for ages ending in a specific digit should then be expected.
 $$\displaystyle{{( {P_{23} + P_{33} + P_{43} + P_{53}} ) } \over {1/10( {P_{23} + \ldots P_{62}} ) }} = \ldots = \displaystyle{{( {P_{32} + P_{42} + P_{52} + P_{62}} ) } \over {1/10( {P_{23} + \ldots P_{62}} ) }} = 1$$
However, if digit preference exists, then the above expression would not hold. This phenomenon is clearly observed in the Spanish population censuses as Figure 1 illustrates. The population pyramid in 1877 clearly displays an age preference for 0s which is greatly reduced by 1970. Given that population is seldom uniformly distributed and that the elderly tend to overstate their age, age-heaping is typically computed for a restricted range, thereby excluding the top and bottom of the distribution. This also enables comparisons since other historical sources, such as military records or marriage registers, overwhelmingly concentrate on young adults.
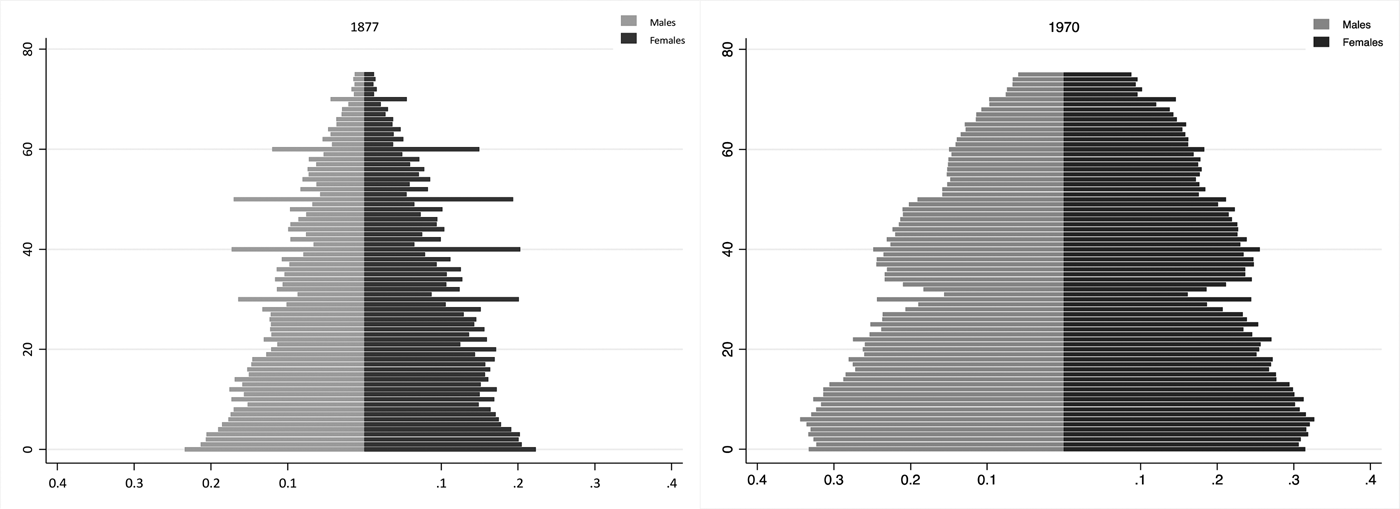
FIGURE 1 POPULATION PYRAMIDS BY AGE (0-75 YEARS OLD) AND SEX IN 1877 AND 1970.
Source: INE.
Bearing this in mind, the Whipple index is possibly the most popular indicator to measure preference for ages ending in 0 and 5 (Spoorenberg and Dutreuilh Reference Spoorenberg and Dutreuilh2007). It can be computed as the ratio of the number of reported ages ending in 0 or 5 to a fifth of the given population. As previously noted, this method assumes that respondents are uniformly distributed as regards age, consequently the oldest and youngest individuals are excluded. The Whipple index is thus computed for specific age cohorts (23-32, 33-42…) or for a whole range (23-62; 23-72). In both cases, the intervals must include an equal frequency of final digits. Then, if P 25 denotes the total number of respondents who reported an age of 25, the Whipple index for multiples of 5 for the range 23-62 years can be computed as follows,
 $$W = \left({\displaystyle{{( {P_{25} + P_{30} + P_{35} + P_{40} + P_{45} + P_{50} + P_{55} + P_{60}} ) } \over {1/5( {P_{23} + P_{24} \ldots + P_{61} + P_{62}} ) }}} \right)\;\times 100$$
By definition, the Whipple index varies between 100, which indicates no preference for ages ending in 0 or 5, and 500, which implies perfect heapingFootnote 9. In this way, however, we neglect the fact that age preference might occur in other terminal digits. Besides, this approach assumes uniformity over an age range of 10 years, which might be an arguable assumption (Spoorenberg and Dutreuilh Reference Spoorenberg and Dutreuilh2007). In order to account for preference and avoidance of all digits, Noumbissi (Reference Noumbissi1992) proposed a modified version of the Whipple index:
 $$\tilde{W} = \mathop \sum \limits_{i = 0}^9 ( {\vert {W_i-1} \vert } ) $$
where W i measures the age preference for each terminal digit and is computed as,
 $$W_0 = \displaystyle{{( {P_{30} + P_{40} + P_{50} + P_{60}} ) } \over {1/5( {P_{30}^5 + P_{40}^5 + P_{50}^5 + P_{60}^5 } ) }}$$
 $$W_9 = \displaystyle{{( {P_{29} + P_{39} + P_{49} + P_{59}} ) } \over {1/5( {P_{29}^5 + P_{39}^5 + P_{49}^5 + P_{59}^5 } ) }}$$
where P 29 stands for the number of respondents who reported an age of 29 while  $P_{29}^5 $ is the population of those aged 27-31. In this case, a value of 0 would imply no heaping, while absolute preference for a specific digit would deliver a maximum value of 16. Using information on preference for each individual digit, this modified version of the original Whipple index is also easy to compute, and more importantly, uses all information, thereby providing further evidence and robustness.
3.2 Data and Sources
In Spain, population censuses have been carried out on a regular basis since the mid-19th centuryFootnote 10. Since 1877, the information on the number of men and women by exact age has been summarised at the provincial level. In this study, we have thus gathered provincial data from the following censuses: 1877, 1887, 1900, 1910, 1920, 1930, 1940, 1970, 1991 and 2001. Similarly, censuses also report the number of men and women who could read and write, thereby allowing for the computation of literacy rates. Sadly, literacy is not reported by exact age, only in few censuses by age groups (4-6, 7-10, 11-20, etc.).
Regarding the data collection process, and as established in the enumerators' instructions, information was completed on family cards (cédulas de inscripción familiares) by the head of the household, or the local agent if household members could not write, on December 31Footnote 11. This implies that the raw data could be recorded by one person for the whole household. Therefore, information was not self-reported. Additionally, it is stipulated that family cards must contain information on the sex, age and level of education, among other characteristics, for each member of the household. More specifically, while the level of education was recorded marking one of the following alternatives («can read», «can read and write» or «cannot read or write»), the exact age was written down on the family card.
For the sake of clarity and to simplify matters, we follow A'Hearn et al. (Reference A'hearn, Baten and Crayen2009) and convert the original Whipple index into a new measure that ranges from 0 to 100:
 $${\rm ABCC} = {\rm \;}\left\{{1-\displaystyle{{( {W-100} ) } \over {400}}} \right\}\times 100{\rm \;\;for\;}W \ge 100$$
 $${\rm ABCC} = {\rm \;}100{\rm \;\;elsewhere}$$
 Theoretically, the ABCC index thus indicates the share of respondents that report age correctly and varies between 0 and 100Footnote 12. Equally, the modified version of the Whipple index ( $\tilde{W}$) can be easily transformedFootnote 13. Table 1 summarises both the original (ABCC) and adjusted
  $( {\overline {{\rm ABCC}} } ) $ indices at the national level for all population censuses since 1877. We compute two alternative indicators, for people aged 23-62 and 23-72 years. Unsurprisingly, using the traditional approach (ABCC) tends to slightly underestimate age-heaping. This is partly due to the fact that there seems to be no preference for the digit 5 in the Spanish censuses, as Figure 1 shows. Additionally, although the indices are greater when using the 23-62 age range than 23-72, these differences are negligible. For the sake of comparability, we concentrate on the traditional ABCC index and the 23-62 age range in the remainder of this articleFootnote 14.
TABLE 1 AGE-HEAPING IN SPAIN BY POPULATION CENSUS

Note:  $\overline {{\rm ABCC}} $ computed with the modified Whipple index or
  $\bar{{\rm W}}$.
Source: INE and authors' calculations.
4. AGE-HEAPING IN SPAIN SINCE THE MID-19TH CENTURY
4.1 Exploiting the Censuses: a Larger Dataset, Alternative Results
The census of 1877 was the first modern count reporting age-specific information for the whole population. Since the ABCC index has been constructed for the 23-62 age group, it then provides information about individuals born between 1815 and 1854Footnote 15. Table 2 displays age-heaping, measured with an ABCC index (per cent), for men and women born in the 1850s across Europe as computed by the Clio-Infra ProjectFootnote 16.
TABLE 2 AGE-HEAPING IN EUROPE DURING THE 1850S

Note: ABCC index (per cent) illustrated above is a birth decadal average.
Source: Clio-Infra
According to Table 2, there appears to be a divide between Russia, Spain and the rest. Nevertheless, the estimates must be taken with caution. For Spain, the ABCC index actually refers to those aged 43-52 in the population census of 1900 (Manzel Reference Manzel2007; Crayen and Baten Reference Crayen and Baten2010a)Footnote 17. Since age-heaping varies with age, it is important to check whether there is an age effectFootnote 18. Crayen and Baten (Reference Crayen and Baten2010b), for instance, find that age-heaping increases with ageFootnote 19. Our data indeed make it possible to compare different age groups over time with previous estimates.
In Figure 2, we compare the age-heaping of those aged 23-32 and 33-42 in each population census with the existing estimates. All values are presented by birth decade. First, our results show that the ABCC index in mid-19th century Spain was not as low as described in the existing literature. Furthermore, if we focus on specific age groups, the ABCC indices remained relatively stable in the late 19th century. Following age groups (23-32; 33-42) over time then provides a somewhat different view of the dynamics of age-heaping. If ABCC indices are displayed, on the other hand, for the whole range (23-62), sex and census (Figure 3), it can be argued that age-heaping did not improve much until the population census of 1920. The period of birth of those included in each population census is shown in the x-axis. This evidence reinforces the above finding: age-heaping remained relatively stable until the 20th century.

FIGURE 2 ABCC INDEX (PER CENT) IN SPAIN BY BIRTH DECADE, 1850-1980.
Note: Clio-Infra uses distinct age groups to construct the ABCC indices. More specifically, 1850s (43-52 years in 1900 census); 1860s (63-72 years in 1930 census); 1870s (53-62 years in 1930 census); 1880s (53-62 years in 1940 census); 1890s (43-52 years in 1940 census); 1900s (33-42 years in 1940 census).
Sources: Computed with data from Clio-Infra and INE.

FIGURE 3 ABCC INDEX (PER CENT) IN SPAIN BY SEX AND POPULATION CENSUS, 1877-2001.
Note: ABCC index (per cent) constructed for those aged 23-62 years. Population censuses are illustrated for each point while the x-axis displays the birth period.
Source: Calculated with data from INE.
If age-heaping is correlated with socioeconomic development, then this finding is in line with the existing evidence on living standards. Although Spain witnessed population and economic growth during the second half of the 19th century (Prados de la Escosura Reference Prados De La Escosura2017), some studies have indicated that improvements in living standards generally occurred from the 1880s onwards. Pérez Moreda et al. (Reference Pérez Moreda, Reher and Sanz Gimeno2015) find that mortality rates in Spain increased between the 1850s and 1880s, falling gradually thereafter. Equally, Martínez Carrión (Reference Martínez Carrión2016), using military records, finds that average adult heights only improved from the 1880s onwardsFootnote 20. Life expectancy, which remained stagnant at around 30 years between the 1860s and the 1880s, began to show an increasing trend in the 1890s (Felice and Pujol-Andreu Reference Felice and Pujol-Andreu2016). Finally, nutrition also improved in the late 19th and early 20th century (Cussó et al. Reference Cussó, Gamboa and Pujol-Andreu2018; Medina-Albaladejo and Calatayud Reference Medina-Albadalejo and Calatayud2020).
Additionally, the detailed information offered in the censuses can be used to compare Spain with neighbouring countries. A'Hearn et al. (Reference A'hearn, Delfino and Nuvolari2016), using the Italian census of 1871, also compute Whipple indices by age groups and sex. When comparing these indices with those derived from the Spanish population census of 1877, it seems that age-heaping was slightly less prevalent than previously claimedFootnote 21. In fact, it appears that age-heaping was less prevalent than in Italy, which challenges the conventional view (in Table 2) that Spain was lagging behind Italy by the mid-19th century. Although age-heaping was still more prevalent than in other countries (Belgium, Finland, France, etc.), it was less widespread than previously documented.
4.2 Female Age-heaping in Spain's Censuses of Population
When examining age-heaping by sex (Figure 3; Table A.1), there appears to be another important fact. In line with previous studies, we find that differences in age-heaping between males and females were small. This has also been found in other contexts. In the 17th and 18th centuries, women appeared to be as numerate, if not more so, than men in the Low Countries (De Moor and Van Zanden Reference De Moor and Van Zanden2010)Footnote 22. Using municipal registers, Gómez-i-Aznar (Reference Gómez-I-Aznar2019) shows that male and female levels of age-heaping were rather similar in 18th-century Catalonia. There were, however, sizable differences in literacy thereby opening the way for an interesting discussion.
The apparent lack of a relationship between these two proxies of human capital has brought about a compelling debate. On the one hand, and given its distinct nature, these skills might not be interchangeable. If, for instance, counting required less effort or training than literacy and both men and women actively participated in day-to-day activities then it would be reasonable to find similar levels of age-heaping. On the other hand, it has been pointed out that age might not have been self-reported. Instead, the head of the household, or a local agent when family members were illiterate, was responsible for this. As Blum et al. (Reference Blum, Colvin, McAtackney and McLaughlin2017) have recently shown, rural women in 19th-century Ireland heaped more than the censuses suggested, thereby recommending caution when using administrative dataFootnote 23.
In our case, although there were sizable differences in literacy between men and women, this was not the case as regards age-heaping as Figure 3, Table A.1 and Figure A.2 showFootnote 24. To shed further light on this issue, we use information for forty-nine provinces and six censuses to test the relationship between literacy and age-heaping, both for males and females. The panel structure of the data allows for time and province fixed effectsFootnote 25. After controlling for all these dimensions, the relationship appears to be statistically significant only for males, as Table 3 shows. In fact, while female literacy is not associated with female age-heaping, male literacy is, thus strongly suggesting that it was usually men who reported the ages of their wives.
TABLE 3 LITERACY AND NUMERACY IN SPAIN, 1877-1930

Robust standard errors in parentheses; ***P < 0.01, **P < 0.05, *P < 0.1. Literacy in columns (1) to (3) refers to the corresponding group (all, male and female). In column (4), however, literacy refers to male literacy. The data include six time periods: 1877, 1887, 1900, 1910, 1920 and 1930.
In this regard, Földvari et al. (Reference Földvári, Van Leeuwen and Van Leeuwen-LI2012) found that married women heaped significantly less than those who were not married. This could be the result of selection, learning within marriage, or women adapting their ages to that of their husbands. Blum et al. (Reference Blum, Colvin, McAtackney and McLaughlin2017), however, find that married women exhibited higher ABCC indices than those who were unmarried thereby suggesting that, instead of the previous interpretations, age was not self-reported in censuses or administrative data, but filled in by the head of the household, mostly menFootnote 26. Using information from the population census of 1930, Table 4 presents age-heaping for women by marital status. Sadly, this information is not available for the previous censuses. As shown here, the ABCC index for married women is essentially similar to that of men. The ABCC index was however significantly lower for singles and widows, whose figures are mostly identicalFootnote 27.
TABLE 4 FEMALE AGE-HEAPING BY MARITAL STATUS AND AGE COHORT IN SPAIN, 1930

Source: Calculated with data from INE.
Summing up, we show that differences in age-heaping between men and women were small for all the censuses. Moreover, the relationship between age-heaping and literacy only arises for males. In this regard, according to the instructions given by the census enumerators, age does not seem to be self-reported. Instead, the head of the household (or member) and the local agent filled in the cards. Taken together, the evidence suggests that female age-heaping computed from Spanish population censuses should be taken with caution since the ABCC index might not be reflecting their numeracy but that of their husbands. In the next section, we will describe the main regional patterns. Given the previous discussion, we will only focus on male age-heaping and literacy.
5. A REGIONAL PERSPECTIVE ON AGE-HEAPING AND LITERACY IN SPAIN, 1877-1930
While the previous section provides information at the national level, in this one we rely on disaggregated information on male age-heaping and literacy at the provincial levelFootnote 28. In general, there appears to be a strong relationship between age-heaping and literacy (Hippe Reference Hippe2012). In the United States, for instance, and using individual data from censuses, there is a statistically significant correlation between literacy and the probability of reporting a heaped ageFootnote 29. Likewise, A'Hearn et al. (Reference A'hearn, Delfino and Nuvolari2016, Reference A'hearn, Delfino and Nuvolari2019) have looked at this relationship with Italian censuses. Though the correlation is present in broad terms, they find some inconsistencies that might challenge the conventional interpretation of age-heaping as a proxy for numeracy skills.
In Spain, we study age-heaping and literacy at the provincial level for each census between 1877 and 1930Footnote 30. Using forty-nine provinces as the main unit of analysis, the correlation between the male ABCC indices and literacy rates ranges from 0.75 in 1877 to 0.59 in 1930, while the Spearman rank correlation goes from 0.80 in 1877 to 0.67 in 1930. Thus, and in line with the existing evidence, there is a strong and statistically significant relationship. In this regard, the 1887, 1900 and 1910 censuses reported literacy rates by sex and age group (21-30, 31-40, 41-50, 51-60). When ABCC indices are computed for these age groups and correlated with the corresponding literacy rates, further evidence is found in support of this relationshipFootnote 31.
Figure 4 shows male ABCC indices and literacy rates for the Spanish provinces (N = 49) between 1877 and 1930. While the solid line is the regression line, the connected black dots display the national average in each of the six censuses. At first glance, there appears to be a rather strong correlation between age-heaping and literacy. Figure 4, however, also shows that while male literacy improved rapidly, age-heaping remained relatively unchanged until the censuses of 1920 and 1930. Furthermore, there is substantial noise or dispersion within Spain, thereby calling for a closer examination.

FIGURE 4 ABCC INDEX (PER CENT) AND LITERACY RATES (PER CENT) IN SPAIN BY PROVINCE, MALES 1877-1930.
Notes: Data for the following population censuses: 1877, 1887, 1900, 1910, 1920 and 1930. The solid line represents the regression line, while the black squares are the national average.
Source: Calculated with data from INE.
Map 1 shows the spatial distribution of male age-heaping and literacy in 1877, 1900 and 1930. In brief, there appears to be a core, namely the centre and centre-north, where literacy was relatively high and age-heaping was practically non-existent. By 1877, in the provinces of Burgos, Álava, Segovia, Palencia, Soria, Valladolid, Madrid and Guadalajara, the ABCC index was above 98 per cent, thereby implying that less than 2 per cent of males aged 23-62 years old reported their age incorrectlyFootnote 32. This level of accuracy would place these territories with the most advanced European societiesFootnote 33. Male literacy rates in these provinces, however, ranged from 62 per cent in Guadalajara to 83 per cent in BurgosFootnote 34.

MAP 1 ABCC INDEX (LEFT) AND LITERACY RATE (RIGHT) IN SPAIN, MALES 1877-1930.
Notes: Provincial ABCC indices (per cent) and literacy rates (per cent) classified into nine equivalent categories for all censuses. In both cases, the range unchanged over the period. The ABCC indices range from 75 to 100 per cent while literacy rates range from 15 to 100 per cent.
Source: Calculated with data from INE.
In other provinces, especially in Andalusia, the Canary Islands, Galicia and the eastern coast, age-heaping and literacy were well below the national average. This great divide, as Map 1 shows and previous studies suggested (Núñez Reference Núñez1992), eventually diminished. On the eve of the Spanish Civil War (1936-1939), most of the northern provinces had almost completed the transition to universal male literacy. Similarly, age-heaping was negligible except for the north-west, Galicia and Asturias. In southern and south-eastern provinces, literacy rates and the ABCC index gradually improved, although they remained low.
In Figure 5, we standardise both measures [0,1] and depict the absolute change in the vertical axis (1877-1900; 1900-1930) and the initial level in the horizontal axis. As shown previously, catching up in human capital essentially occurred in the period 1900-30. That is to say, age-heaping and literacy improved more in provinces with a lower initial level. Yet, in the late 19th century, things were different. When considering all provinces, male literacy improved evenly between 1877 and 1900, irrespective of the initial levels. The situation regarding age-heaping, however, is less clear. Though some catching up can be observed, the absolute change in most provinces was negligible, in some cases even negative, implying little, if any, improvement during this period.

FIGURE 5 ABCC INDEX (LEFT) AND LITERACY RATE (RIGHT) IN SPAIN, MALES 1877-1900 AND 1900-1930.
Notes: Provincial ABCC index (per cent) and literacy rates (per cent) have been standardised using a fixed range for both periods, 1877-1900 and 1900-1930. The ABCC indices range was 75-100 while for literacy it was from 15 to 100 per cent. Thus, the y-axis reflects absolute change whereas the x-axis shows the initial level.
Source: Calculated with data from INE.
To delve further into the spatial patterns, Figure 6 displays the trajectories followed by four selected provinces: Madrid, Barcelona, Valencia and Seville. These provinces contain the largest cities in Spain. All things considered, the figure presents some interesting facts. On the one hand, in Madrid, the capital province, male age-heaping was practically inexistent even at the beginning of our period of analysis. Literacy was also relatively high, nearly 80 per cent in the earliest count, and improved thereafter. In Barcelona, however, literacy and age-heaping were initially far less impressive but, while literacy increased throughout the whole period, the ABCC index remained unchanged until the 1930 census. In Valencia, literacy was low (28 per cent) while the ABCC index was not far away from that of Barcelona where more than 40 per cent of men and women could read and write. Finally, in Seville, both indicators were initially low but then increased rapidly. All in all, these stories present a snapshot of the peculiar relationship between age-heaping and literacy in Spain.

FIGURE 6 ABCC INDEX AND LITERACY IN SPAIN BY PROVINCE, MALES 1877-1930.
Source: Calculated with data from INE.
Note: Marked dots correspond to the census years 1877, 1887, 1900, 1910, 1920 and 1930.
An important feature absent from our analysis is internal migration, which could affect the stock of human capital. Beltrán Tapia and Miguel Salanova (Reference Beltrán Tapia and De Miguel Salanova2017) found that the migrants moving to Madrid from 1880 to 1930 were on average more literate than their counterparts who remained in their provinces of origin. Other destinations, however, attracted fewer literate migrants, especially those moving from rural areas to the provincial capital, often resulting in negative self-selection. This is indeed relevant, since the type (and importance) of migratory flows would influence the stock of human capital both in sending and receiving regions. We acknowledge the potential relevance of internal migrations, but it must be born in mind that although internal migrations have been recurrent in Spanish history, permanent internal migrations remained low until the 1920s (Silvestre Reference Silvestre2001, Reference Silvestre2005).
6. DISCUSSION
Taken together, the findings reported here suggest that assessing the relationship between age-heaping and literacy during the early stages of modern economic growth is subject to some major issues, at least regarding the Spanish experience. First, and connected with the previous sections, female age in Spanish censuses, at least from 1877 to 1930, seems not to be self-reported. This, as pointed out previously, is a common concern in studies based on administrative dataFootnote 35. While censuses have the virtue of including the whole population, thereby removing concerns about potential selection bias or representativity, some authors have questioned their reliability. In our case, sizable differences between males and females are found in literacy but not in age-heaping which calls for caution when making explicit interpretations.
Besides, and although these relative indicators cannot be directly compared, age-heaping in late 19th-century Spain seems abnormally low given the widespread illiteracy. As reported in the census of 1877, male literacy in Almería, Granada, Málaga or the Canary Islands was around 20-25 per cent while ABCC indices ranged from 79 to 87 per cent. Given this level of accuracy and following the standards used by the United Nations Statistics Division (UNSD), these data would be labelled as «rough». Yet, these figures would be «fairly accurate», almost «highly accurate», for several northern provinces even though male literacy rates were in some cases below 75 per cent, thereby implying that one out of four adult males were not able to read and writeFootnote 36.
This leads to a recurrent theme: whether the accuracy of the data captures numeracy or whether it is affected by the data-collection process. In the first case, our findings would provide further evidence in support of the view that numeracy, reading and writing have a distinct nature. It is possible to hypothesise that, while learning to read and write required a larger investment of resources, effort and time, numeracy could be acquired more easily. Indeed, the latter may be obtained in a more intuitive way in daily life and work, especially when individuals are surrounded by other people who possess and use this skill. In this context, on-the-job training might be a crucial factor. In Spain, Rosés (Reference Rosés1998) stressed the relevance of on-the-job training during the industrialisation of Catalonia around the mid-19th century, a period marked by relatively modest literacy in comparison with other territories. Similarly, Nadal (Reference Nadal1996) argued that technical schools (liceus and escoles d'arts i oficis) provided the required skills to the factory workers in CataloniaFootnote 37.
On the other hand, if information is corrected and cross-checked with other sources, such as parish registers or padrones, by the local agent (or census taker) or clerical workers, age-heaping would then not be fully capturing numeracy. A'Hearn et al. (Reference A'hearn, Delfino and Nuvolari2016) have suggested that age-heaping is not directly measuring numeracy, at least in 19th-century Italy, but a «broader mix of contextual factors» related to the process of economic development. They define these factors as modernisation of the economy in a wide sense, including «cultural change in the direction of secularism, individualism, and linear time-perception» and, interestingly, also as an institutional change related with the state's administrative capacity to conduct the task of carrying out the population censuses.
In Spain, population censuses were undertaken on December 31. This colossal enterprise, coordinated by the Dirección General del Instituto Geográfico y Estadístico, was conducted at the local level by the Juntas Censales (municipales and provinciales)Footnote 38. As specified in the instructions, households were given registration cards some days before. The head of the household, or local agent if household members could not write, then filled in the information. On 1 January, the registration cards were collected and the Juntas municipales began the examination of the reported information, correcting and filling in the gaps or omissions found. Finally, the Juntas municipales tabulated the data in a specific format for the municipality and prepared the padrones Footnote 39.
Therefore, in parish and civil registers and padrones, information might have been filled in, cross-checked and corrected. Interestingly, the civil registry was introduced in the 1870s, after the passing of the Ley Provisional de Registro Civil of 1870 and subsequent acts. In both parish and civil registers, the date of birth was often recorded thereby allowing for a simple calculation of the age in each specific year. Besides, municipalities maintained a register, or padrón, of the residents or empadronados, which provided «a line for each empadronado» with basic information (name, address, date of birth, marital status…). The Ley Municipal of 1870 stipulated that all citizens must be registered in a municipality. Additionally, every 5 years municipalities had to carry out a padrón.
As a result, the information on age-heaping based on the Spanish population censuses may be pointing to the existence of limited numerical abilities, but also to a limited capacity of the state to collect the data. Differences in age-heaping could also be related to the presence of regional differences in administrative capacity. As previously mentioned, the state designed the data-collection process and sent instructions and materials (cédulas, etc.) to the municipalities. Local authorities and agents proceeded to collect, correct and tabulate the information before sending it to the provincial board, where it was summarised. We do not have evidence to claim that the allocation of funding varied, and it seems that much was devoted to printing the instructions and materials. However, given the spatial heterogeneity of the Spanish municipalities, it might be the case that the costs associated with collecting the data were greater in some places and the municipal budgets might have allocated different amounts of resources. In addition, there might be other relevant differences regarding the existence or not of parish registers or padrones which permitted cross-checking. The dissimilar settlement patterns in northern and southern Spain could also imply different costs when collecting the information. All these issues open up a new avenue for research that requires more detailed micro-level studies.
Although the accuracy of the census takers in performing their task is difficult to ascertain, it is recognised that older people find it more difficult to remember their exact age, so it is expected that rounding numbers would be more pronounced as people get olderFootnote 40. In order to explore this issue, we have divided our sample into two large groups by age: those between 23-42 and 43-62 years and calculated ABCC indices. Figure 7 shows the results. The increased age-heaping observed in the older generations, particularly in the early counts when age-heaping was more prevalent, is in line with the existing literature and makes us more confident about the capacity of the state to collect information and therefore about the accuracy of our male age-heaping indicators.

FIGURE 7 ABCC INDICES BY TWO LARGE AGE GROUPS, SPAIN 1877-2001.
Source: Calculated with data from INE.
Finally, since age-heaping is calculated for those aged 23-62 or 23-72, the developments described above might have an impact on the age-heaping reported in the population censuses of the early 20th century. As shown in Figure 1 and Map 1, age-heaping remained relatively unchanged in the early counts, improving thereafter. Besides, even if accuracy improved, this occurred unevenly as Map 1 shows. By 1930, age-heaping remained relatively high in the north-west (Galicia, Asturias). Given that migrations were particularly acute in the early 20th century, the latter might be explained by the selection biases these flows introduced regarding the characteristics of the population who migrated or stayed behind (Beltrán Tapia and Miguel Salanova Reference Beltrán Tapia and De Miguel Salanova2017). The general patterns might also be related to the different settlement patterns characterising Spain (Oto-Peralías Reference Oto-Peralías2020). In the north-west, the density of population entities is much higher than in other territories and most of these are relatively small, thus facilitating enumerating their populationsFootnote 41. It is therefore plausible to argue that the costs associated with the undertaking of a census might be affected by territorial specificities and their dynamismFootnote 42.
Literacy, on the other hand, improved throughout the whole period but especially in the early 20th century. Our study, then, shows that both stories are plausible. Literacy and age-heaping are correlated which reinforces the view that the latter captures a dimension of human capital, numeracy. Likewise, this story is consistent with a steady improvement of the data collection methods, especially after the introduction of the civil registry. Although we lack the evidence to disentangle this issue, this study calls for a careful consideration of the sources in historical contexts. Lastly, these results also point to the importance of territorial specificities that require further research.
7. CONCLUSIONS
This paper explores human capital in late 19th and early 20th-century Spain. In doing so, we use information published in six population censuses for age and the level of education. Subsequently, and following the existing literature, we calculate age-heaping and literacy rates. Our approach thus combines two distinct proxies of human capital.
In brief, there are three major findings. First, age-heaping was relatively stable in the late 19th century. In fact, it only significantly improved in the early 20th century. Literacy, however, gradually improved throughout the period of study. This dissociation might be the result of the distinct nature of both skills and/or issues related to the data-collection process. Second, by the mid-19th century, age-heaping, either for young adults (23-32 years) or for the whole distribution (23-62 years), was less significant than what previous studies have suggested. What is more, when provincial information is used, we find a correlation between age-heaping and literacy but also abnormally low levels of age-heaping in certain provinces where a sizable part of the population could not read and write. Likewise, although Italy and Spain exhibited similar levels of literacy during the 1870s, age-heaping was less relevant too. Third, differences in age-heaping between men and women were minor even though there were marked gaps as regards literacy.
In sum, this study provides further insights, but also raises questions about data sources and interpretation. The absence of a gender gap in age-heaping reinforces the view that female information in administrative data, such as population censuses, is not self-reported. In this case, the head of household, or local agent if household members were illiterate, filled in the information. Still, even if the analysis is restricted to males, the dissociation between age-heaping and literacy in the late 19th century and the abnormally low levels of age-heaping in certain provinces raise concerns about the sources, and hence the interpretation of these findings. If omitted information is filled in, cross-checked or corrected with other sources (parish and civil registries, padrones) by the Juntas municipales, then accuracy might not just be reflecting numeracy but the capacity of the local administration. Although our study does not permit digging further into these issues, human capital and data quality improved, especially in the early 20th century, whereas further research is needed to disentangle the late 19th-century story.
ACKNOWLEDGEMENTS
The authors would like to thank the editor and three anonymous referees for their comments. We are also grateful for the financial support of the Bank of Spain through the «Programa de Ayudas a la Investigación en Macroeconomía, Economía Monetaria, Financiera y Bancaria, e Historia Económica». This paper was presented at the III Seminar in Economic History at the Bank of Spain in Madrid. We would like to thank the participants for the comments received and Fran Marco-Gracia who kindly shared information regarding the population censuses with us. Financial support from the Spanish Ministry of Science and Innovation, Projects ECO2015-65049-C12-1-P, ECO2017-90848-REDT, PGC2018-095821-B-I00, HAR2015-64076-P, PGC2018-095529-B-I00 (MCIU/AEI/FEDER, UE), the Generalitat Valenciana (AICO/2018/1930 and PROMETEO/2020/083) and the Norwegian Research Council, Project 249723, is also gratefully acknowledged.
APPENDIX
TABLE A1 AGE-HEAPING IN SPAIN BY AGE GROUP AND SEX IN THE POPULATION CENSUS OF 1877

TABLE A2 AGE-HEAPING IN ITALY BY AGE GROUP AND SEX IN THE POPULATION CENSUS OF 1871


FIGURE A1. REGISTRATION CARD (CéDULA DE INSCRIPCIÓN), POPULATION CENSUS OF 1877.

FIGURE A2. DIFFERENCES IN AGE-HEAPING AND LITERACY BY SEX AND PROVINCE IN SPAIN, 1900.
Notes: ABCC indices (per cent) and literacy rates (per cent) by sex and province have been standardised using a fixed range. The ABCC indices range was 75-100 while for literacy it was from 10 to 100 per cent. The y-axis reflects the differences in literacy while the x-axis shows the differences in age-heaping.
Source: Calculated with data from INE.


