


1. Introduction
Convective mixing in porous media is an important process that has been studied extensively (Nield & Bejan Reference Nield and Bejan2006). Recently, it has received renewed attention in the context of geologic sequestration of carbon dioxide (
 $\text{CO}_{2}$
), a promising technology to mitigate climate change by reducing atmospheric greenhouse gas emissions (Lackner Reference Lackner2003; Orr Reference Orr2009; Szulczewski et al.
Reference Szulczewski, MacMinn, Herzog and Juanes2012). The sequestration process involves the capture of
$\text{CO}_{2}$
), a promising technology to mitigate climate change by reducing atmospheric greenhouse gas emissions (Lackner Reference Lackner2003; Orr Reference Orr2009; Szulczewski et al.
Reference Szulczewski, MacMinn, Herzog and Juanes2012). The sequestration process involves the capture of
 $\text{CO}_{2}$
from anthropogenic sources such as coal-fired and gas-fired power plants, the transportation after compression through a pipeline system and, finally, the injection of supercritical
$\text{CO}_{2}$
from anthropogenic sources such as coal-fired and gas-fired power plants, the transportation after compression through a pipeline system and, finally, the injection of supercritical
 $\text{CO}_{2}$
into underground geologic formations such as deep saline aquifers (IPCC Reference Metz2005). Once it reaches a brine-saturated porous formation,
$\text{CO}_{2}$
into underground geologic formations such as deep saline aquifers (IPCC Reference Metz2005). Once it reaches a brine-saturated porous formation,
 $\text{CO}_{2}$
dissolves into the ambient brine, creating a solution that is denser than both initial fluids. The density increase triggers a Rayleigh–Bénard-type gravitational instability that enables mass transport through advection and diffusion, known here as convective mixing, rather than diffusion alone (Weir, White & Kissling Reference Weir, White and Kissling1996; Lindeberg & Wessel-Berg Reference Lindeberg and Wessel-Berg1997; Ennis-King & Paterson Reference Ennis-King and Paterson2005; Riaz et al.
Reference Riaz, Hesse, Tchelepi and Orr2006). Convective mixing allows for faster solubility trapping of
$\text{CO}_{2}$
dissolves into the ambient brine, creating a solution that is denser than both initial fluids. The density increase triggers a Rayleigh–Bénard-type gravitational instability that enables mass transport through advection and diffusion, known here as convective mixing, rather than diffusion alone (Weir, White & Kissling Reference Weir, White and Kissling1996; Lindeberg & Wessel-Berg Reference Lindeberg and Wessel-Berg1997; Ennis-King & Paterson Reference Ennis-King and Paterson2005; Riaz et al.
Reference Riaz, Hesse, Tchelepi and Orr2006). Convective mixing allows for faster solubility trapping of
 $\text{CO}_{2}$
into the brine, thus increasing storage security against leakage risks (MacMinn, Szulczewski & Juanes Reference MacMinn, Szulczewski and Juanes2011; Szulczewski et al.
Reference Szulczewski, MacMinn, Herzog and Juanes2012).
$\text{CO}_{2}$
into the brine, thus increasing storage security against leakage risks (MacMinn, Szulczewski & Juanes Reference MacMinn, Szulczewski and Juanes2011; Szulczewski et al.
Reference Szulczewski, MacMinn, Herzog and Juanes2012).
Solubility trapping of
 $\text{CO}_{2}$
into groundwater at reservoir conditions (e.g.
$\text{CO}_{2}$
into groundwater at reservoir conditions (e.g.
 $\text{pCO}_{2}\sim 10~\text{MPa},~T\sim 60\,^{\circ }\text{C}$
) creates an acidic solution with
$\text{pCO}_{2}\sim 10~\text{MPa},~T\sim 60\,^{\circ }\text{C}$
) creates an acidic solution with
 $\text{pH}\sim 4$
(Xu et al.
Reference Xu, Kharaka, Doughty, Freifeld and Daley2010). As suggested by recent core flood experiments on carbonate rock samples (Carroll et al.
Reference Carroll, Hao, Smith and Sholokhova2013; Elkhoury, Ameli & Detwiler Reference Elkhoury, Ameli and Detwiler2013), interaction between the acidic
$\text{pH}\sim 4$
(Xu et al.
Reference Xu, Kharaka, Doughty, Freifeld and Daley2010). As suggested by recent core flood experiments on carbonate rock samples (Carroll et al.
Reference Carroll, Hao, Smith and Sholokhova2013; Elkhoury, Ameli & Detwiler Reference Elkhoury, Ameli and Detwiler2013), interaction between the acidic
 $\text{CO}_{2}$
–brine solution and carbonate rocks leads to dissolution of minerals such as calcite (
$\text{CO}_{2}$
–brine solution and carbonate rocks leads to dissolution of minerals such as calcite (
 $\text{CaCO}_{3}$
) through a series of geochemical reactions. Under constant flow conditions, rock dissolution may lead to the formation of high-porosity channels in the core sample (Carroll et al.
Reference Carroll, Hao, Smith and Sholokhova2013). To put this in the context of
$\text{CaCO}_{3}$
) through a series of geochemical reactions. Under constant flow conditions, rock dissolution may lead to the formation of high-porosity channels in the core sample (Carroll et al.
Reference Carroll, Hao, Smith and Sholokhova2013). To put this in the context of
 $\text{CO}_{2}$
sequestration, as mineral dissolution occurs in response to the lowered pH in brine, this could result in a positive feedback that further drives the solubility trapping of
$\text{CO}_{2}$
sequestration, as mineral dissolution occurs in response to the lowered pH in brine, this could result in a positive feedback that further drives the solubility trapping of
 $\text{CO}_{2}$
and mineral dissolutions (Xu, Apps & Pruess Reference Xu, Apps and Pruess2003). A recent study addressed this issue by performing a series of two-dimensional aquifer simulations that incorporate geochemistry into existing flow simulation software (Saaltink et al.
Reference Saaltink, Vilarrasa, De Gaspari, Silva, Carrera and Rötting2013). They concluded that porosity changes due to calcite dissolution were relatively small in the scenario they studied.
$\text{CO}_{2}$
and mineral dissolutions (Xu, Apps & Pruess Reference Xu, Apps and Pruess2003). A recent study addressed this issue by performing a series of two-dimensional aquifer simulations that incorporate geochemistry into existing flow simulation software (Saaltink et al.
Reference Saaltink, Vilarrasa, De Gaspari, Silva, Carrera and Rötting2013). They concluded that porosity changes due to calcite dissolution were relatively small in the scenario they studied.
Here, we revisit this problem using high-resolution simulation. The phenomenon of convective mixing has been studied through nonlinear simulations in two dimensions (e.g. Riaz et al. Reference Riaz, Hesse, Tchelepi and Orr2006; Hassanzadeh, Pooladi-Darvish & Keith Reference Hassanzadeh, Pooladi-Darvish and Keith2007; Hidalgo & Carrera Reference Hidalgo and Carrera2009; Neufeld et al. Reference Neufeld, Hesse, Riaz, Hallworth, Tchelepi and Huppert2010; Hidalgo et al. Reference Hidalgo, Fe, Cueto-Felgueroso and Juanes2012; Szulczewski, Hesse & Juanes Reference Szulczewski, Hesse and Juanes2013; Bolster Reference Bolster2014; Slim Reference Slim2014), three dimensions (Pau et al. Reference Pau, Bell, Pruess, Almgren, Lijewski and Zhang2010; Fu, Cueto-Felgueroso & Juanes Reference Fu, Cueto-Felgueroso and Juanes2013) and experimental systems reproducing the conditions for a stationary horizontal layer (Kneafsey & Pruess Reference Kneafsey and Pruess2010; Neufeld et al. Reference Neufeld, Hesse, Riaz, Hallworth, Tchelepi and Huppert2010; Backhaus, Turitsyn & Ecke Reference Backhaus, Turitsyn and Ecke2011; Slim et al. Reference Slim, Bandi, Miller and Mahadevan2013) or a migrating buoyant current (MacMinn et al. Reference MacMinn, Neufeld, Hesse and Huppert2012; MacMinn & Juanes Reference MacMinn and Juanes2013). In the case of three-dimensional simulations, a striking self-organized network pattern is observed near the top boundary layer (Fu et al. Reference Fu, Cueto-Felgueroso and Juanes2013). Here, we study the morphology of rock dissolution patterns that develop from the interplay between reaction and density-dependent flow and ask the following questions: how do flow patterns translate into spatial organization of the permeability field through mineral dissolution? What is the evolution that leads to this pattern morphology? As rock dissolution alters local porosity and permeability, how does their change, in turn, affect flow and transport? We seek answers to these questions through high-resolution three-dimensional simulation of convective mixing in porous media coupled with carbonate geochemistry.
1.1. Decoupled formulation for multispecies reactive transport
The classic formulation of flow and transport in porous media coupled to geochemical reactions is a set of mass balance equations for the relevant chemical species, namely the ions and molecules participating in the chemical processes (Steefel & Lasaga Reference Steefel and Lasaga1994):
 $$\begin{eqnarray}{\it\phi}\frac{\partial c_{i}}{\partial t}+\boldsymbol{{\rm\nabla}}\boldsymbol{\cdot }(\boldsymbol{u}c_{i})-\boldsymbol{{\rm\nabla}}\boldsymbol{\cdot }({\it\phi}D\boldsymbol{{\rm\nabla}}c_{i})=r_{i}\quad (i=1,2,\dots ,N_{tot}),\end{eqnarray}$$
where
 $c_{i}$
is the mass concentration of species
$c_{i}$
is the mass concentration of species
 $i$
,
$i$
,
 $r_{i}$
is the source/sink term of species
$r_{i}$
is the source/sink term of species
 $i$
due to chemical reactions (defined as the mass of species
$i$
due to chemical reactions (defined as the mass of species
 $i$
produced/consumed in all participating reactions per unit volume and unit time),
$i$
produced/consumed in all participating reactions per unit volume and unit time),
 $N_{tot}$
is the number of aqueous species,
$N_{tot}$
is the number of aqueous species,
 ${\it\phi}$
is porosity,
${\it\phi}$
is porosity,
 $\boldsymbol{u}$
is the Darcy velocity and
$\boldsymbol{u}$
is the Darcy velocity and
 $D$
is the diffusion/dispersion coefficient. Equation (1.1) is then coupled with chemical reactions through appropriate relations for the source/sink term.
$D$
is the diffusion/dispersion coefficient. Equation (1.1) is then coupled with chemical reactions through appropriate relations for the source/sink term.
When chemical reactions are slow compared with transport, a reaction-controlled system, one can use a kinetic formulation for
 $r_{i}$
to characterize the reactions. For example, a simplified kinetic formulation to describe precipitation/dissolution of a mineral takes the form (Steefel & Lasaga Reference Steefel and Lasaga1994):
$r_{i}$
to characterize the reactions. For example, a simplified kinetic formulation to describe precipitation/dissolution of a mineral takes the form (Steefel & Lasaga Reference Steefel and Lasaga1994):
 $$\begin{eqnarray}r_{i}={\it\xi}Kf(c_{m}),\end{eqnarray}$$
where
 ${\it\xi}$
is the reactive mineral surface area,
${\it\xi}$
is the reactive mineral surface area,
 $K$
is the kinetic rate constant associated with dissolution/precipitation and
$K$
is the kinetic rate constant associated with dissolution/precipitation and
 $f(c_{m})$
is some function of concentrations of the participating species (
$f(c_{m})$
is some function of concentrations of the participating species (
 $c_{m}$
). Kinetic formulations similar to (1.2) have been adopted to study dissolution patterns in fractured media (Detwiler & Rajaram Reference Detwiler and Rajaram2007) and formation of wormholes (Szymczak & Ladd Reference Szymczak and Ladd2011), both of which can exhibit slow chemical kinetics.
$c_{m}$
). Kinetic formulations similar to (1.2) have been adopted to study dissolution patterns in fractured media (Detwiler & Rajaram Reference Detwiler and Rajaram2007) and formation of wormholes (Szymczak & Ladd Reference Szymczak and Ladd2011), both of which can exhibit slow chemical kinetics.
When reactions are fast, the problem becomes transport-limited because the reaction time scale is much smaller than the transport time scale. In the limit of instantaneous chemical equilibrium, the kinetic reaction rates become by definition infinitely large, but the rates of production/consumption
 $r_{i}$
remain bounded by the rate at which chemicals are brought in contact to sustain the reactions.
$r_{i}$
remain bounded by the rate at which chemicals are brought in contact to sustain the reactions.
A challenging aspect of reactive transport simulation is the high computational cost as a result of the highly nonlinear nature of the coupled equations. To alleviate this computational burden, one can rewrite the mass balance equations through linear combinations to eliminate the source/sink terms in all but a small subset of the transport equations (Yeh & Tripathi Reference Yeh and Tripathi1991; Lichtner Reference Lichtner, Lichtner, Steefel and Oelkers1996; Steefel & MacQuarrie Reference Steefel, MacQuarrie, Lichtner, Steefel and Oelkers1996; Saaltink, Ayora & Carrera Reference Saaltink, Ayora and Carrera1998). Most reactive transport codes today employ variants of this split into primary and secondary chemical species (Yeh & Tripathi Reference Yeh and Tripathi1991; Olivella et al. Reference Olivella, Gens, Carrera and Alonso1996; Saaltink et al. Reference Saaltink, Batlle, Ayora, Carrera and Olivella2004; Xu et al. Reference Xu, Sonnenthal, Spycher and Pruess2006; Hammond et al. Reference Hammond, Lichtner, Lu, Mills, Zhang, Yeh and Parker2012).
For the special case of geochemical systems described by instantaneous equilibrium reactions, one can reformulate the problem as a transport equation for a conservative species
 ${\it\tau}$
, defined as any quantity in the system that is unaffected by reactions:
${\it\tau}$
, defined as any quantity in the system that is unaffected by reactions:
 $$\begin{eqnarray}{\it\phi}\frac{\partial {\it\tau}}{\partial t}+\boldsymbol{{\rm\nabla}}\boldsymbol{\cdot }(\boldsymbol{u}{\it\tau})-\boldsymbol{{\rm\nabla}}\boldsymbol{\cdot }({\it\phi}D\boldsymbol{{\rm\nabla}}{\it\tau})=0,\end{eqnarray}$$
from which the rate of production/consumption
 $r_{i}$
is determined by an analytical expression (De Simoni et al.
Reference De Simoni, Carrera, Sánchez-Vila and Guadagnini2005, Reference De Simoni, Sánchez-Vila, Carrera and Saaltink2007):
$r_{i}$
is determined by an analytical expression (De Simoni et al.
Reference De Simoni, Carrera, Sánchez-Vila and Guadagnini2005, Reference De Simoni, Sánchez-Vila, Carrera and Saaltink2007):
 $$\begin{eqnarray}r_{i}=2{\it\phi}F_{i}({\it\tau})\left(\boldsymbol{{\rm\nabla}}{\it\tau}\boldsymbol{\cdot }D\boldsymbol{{\rm\nabla}}{\it\tau}\right).\end{eqnarray}$$
Typical examples of the conservative variable
 ${\it\tau}$
include ionic charge (Andre & Rajaram Reference Andre and Rajaram2005), or a given element such as carbon (De Simoni et al.
Reference De Simoni, Carrera, Sánchez-Vila and Guadagnini2005).
${\it\tau}$
include ionic charge (Andre & Rajaram Reference Andre and Rajaram2005), or a given element such as carbon (De Simoni et al.
Reference De Simoni, Carrera, Sánchez-Vila and Guadagnini2005).
Equation (1.4) consists of two
 ${\it\tau}$
-dependent factors, both of which control where and how much reaction occurs in a reactive transport system.
${\it\tau}$
-dependent factors, both of which control where and how much reaction occurs in a reactive transport system.
-
(a) The chemical speciation function of species
 $i$
. Chemical speciation refers to the distribution of a given element or ion amongst chemical species in the system. The speciation function of element/ion
$i$
, defined here as
$F_{i}({\it\tau})=\text{d}^{2}c_{i}/\text{d}{\it\tau}^{2}$
(De Simoni et al.
Reference De Simoni, Sánchez-Vila, Carrera and Saaltink2007), describes the vigor of the chemical reactions at a given system state (i.e. for a given value of
${\it\tau}$
) and depends solely on the specifics of the reactions. It can be calculated offline, therefore greatly reducing the computational cost of the simulation.
$i$
. Chemical speciation refers to the distribution of a given element or ion amongst chemical species in the system. The speciation function of element/ion
$i$
, defined here as
$F_{i}({\it\tau})=\text{d}^{2}c_{i}/\text{d}{\it\tau}^{2}$
(De Simoni et al.
Reference De Simoni, Sánchez-Vila, Carrera and Saaltink2007), describes the vigor of the chemical reactions at a given system state (i.e. for a given value of
${\it\tau}$
) and depends solely on the specifics of the reactions. It can be calculated offline, therefore greatly reducing the computational cost of the simulation. -
(b) The scalar dissipation rate,
${\it\varepsilon}=\boldsymbol{{\rm\nabla}}{\it\tau}\boldsymbol{\cdot }D\boldsymbol{{\rm\nabla}}{\it\tau}$
, measures the local rate of fluid mixing as a result of fluid flow and transport.


Loosely speaking,
 $r_{i}$
is controlled locally by both the chemistry and the fluid mechanics. This decoupled formulation ((1.3) and (1.4)) has been shown to be a good approximation in systems with fast (but not instantaneous) reactions (Sanchez-Vila, Dentz & Donado Reference Sanchez-Vila, Dentz and Donado2007). It has been adopted by various authors to study reactions driven by fluid mixing, including calcite dissolution in coastal carbonate aquifers (Rezaei et al.
Reference Rezaei, Sanz, Raeisi, Ayora, Vázquez-Suñé and Carrera2005; Romanov & Dreybrodt Reference Romanov and Dreybrodt2006; De Simoni et al.
Reference De Simoni, Sánchez-Vila, Carrera and Saaltink2007) and numerical modelling of laboratory experiments of saltwater–freshwater mixing (Guadagnini et al.
Reference Guadagnini, Sanchez-Vila, Saaltink, Bussini and Berkowitz2009). In our system, the time to reach geochemical equilibrium is estimated to be of the order of tens of hours, which is indeed small compared with the time for flow and transport over the natural length scale in a typical aquifer (see appendix A). In situations where local transport time is comparable with that of reaction, non-equilibrium effects can occur, although the finite-rate kinetics would have minimal effect for the parameter ranges we investigate in this study (Sanchez-Vila et al.
Reference Sanchez-Vila, Dentz and Donado2007). The above assumptions allow us to adopt the decoupled approach, which also simplifies computation and offers insight into the interplay between geochemical and hydrodynamic processes.
$r_{i}$
is controlled locally by both the chemistry and the fluid mechanics. This decoupled formulation ((1.3) and (1.4)) has been shown to be a good approximation in systems with fast (but not instantaneous) reactions (Sanchez-Vila, Dentz & Donado Reference Sanchez-Vila, Dentz and Donado2007). It has been adopted by various authors to study reactions driven by fluid mixing, including calcite dissolution in coastal carbonate aquifers (Rezaei et al.
Reference Rezaei, Sanz, Raeisi, Ayora, Vázquez-Suñé and Carrera2005; Romanov & Dreybrodt Reference Romanov and Dreybrodt2006; De Simoni et al.
Reference De Simoni, Sánchez-Vila, Carrera and Saaltink2007) and numerical modelling of laboratory experiments of saltwater–freshwater mixing (Guadagnini et al.
Reference Guadagnini, Sanchez-Vila, Saaltink, Bussini and Berkowitz2009). In our system, the time to reach geochemical equilibrium is estimated to be of the order of tens of hours, which is indeed small compared with the time for flow and transport over the natural length scale in a typical aquifer (see appendix A). In situations where local transport time is comparable with that of reaction, non-equilibrium effects can occur, although the finite-rate kinetics would have minimal effect for the parameter ranges we investigate in this study (Sanchez-Vila et al.
Reference Sanchez-Vila, Dentz and Donado2007). The above assumptions allow us to adopt the decoupled approach, which also simplifies computation and offers insight into the interplay between geochemical and hydrodynamic processes.
2. Mathematical formulation
We consider a two-dimensional porous medium with square geometry composed mainly of carbonate rocks, or
 $\text{CaCO}_{3}$
(figure 1). The porous domain has impermeable boundaries at the top and bottom, and we assume periodicity in the lateral direction. The height of the square domain is denoted
$\text{CaCO}_{3}$
(figure 1). The porous domain has impermeable boundaries at the top and bottom, and we assume periodicity in the lateral direction. The height of the square domain is denoted
 $H$
. There are two participating solutions in the system; solution 1 consists of brine saturated with
$H$
. There are two participating solutions in the system; solution 1 consists of brine saturated with
 $\text{CO}_{2}$
, and it enters the domain through the top boundary; solution 2 is the ambient brine that initially fully saturates the porous medium. An important assumption we make in this formulation is that both solutions are initially at chemical equilibrium with the carbonate formation. This assumption is justified because (i) the pH for solution 1 is around 4, which indicates fast reaction with the carbonate; (ii) solution 2 is the ambient brine, which has already reached chemical equilibrium with the carbonate during its geologic residence time. This assumption distinguishes our formulation from the classical kinetic reaction behaviour. Under this set-up, neither solution 1 nor solution 2 alone will induce reactions; rather it is the mixing of the two solutions, which disturbs local chemical equilibrium, that triggers geochemical reactions and rock dissolution. We assume Boussinesq, incompressible Darcy flow through porous media (Nield & Bejan Reference Nield and Bejan2006):
$\text{CO}_{2}$
, and it enters the domain through the top boundary; solution 2 is the ambient brine that initially fully saturates the porous medium. An important assumption we make in this formulation is that both solutions are initially at chemical equilibrium with the carbonate formation. This assumption is justified because (i) the pH for solution 1 is around 4, which indicates fast reaction with the carbonate; (ii) solution 2 is the ambient brine, which has already reached chemical equilibrium with the carbonate during its geologic residence time. This assumption distinguishes our formulation from the classical kinetic reaction behaviour. Under this set-up, neither solution 1 nor solution 2 alone will induce reactions; rather it is the mixing of the two solutions, which disturbs local chemical equilibrium, that triggers geochemical reactions and rock dissolution. We assume Boussinesq, incompressible Darcy flow through porous media (Nield & Bejan Reference Nield and Bejan2006):
 $$\begin{eqnarray}\boldsymbol{{\rm\nabla}}\boldsymbol{\cdot }\boldsymbol{u}=0,\quad \boldsymbol{u}=-\frac{k({\it\phi})}{{\it\mu}}(\boldsymbol{{\rm\nabla}}P-{\it\rho}g\boldsymbol{z}),\end{eqnarray}$$
where
 $\boldsymbol{u}$
is the Darcy velocity,
$\boldsymbol{u}$
is the Darcy velocity,
 $k$
is permeability,
$k$
is permeability,
 ${\it\mu}$
is dynamic viscosity,
${\it\mu}$
is dynamic viscosity,
 $P$
is pressure,
$P$
is pressure,
 ${\it\rho}$
is fluid density,
${\it\rho}$
is fluid density,
 $g$
is gravitational acceleration and
$g$
is gravitational acceleration and
 ${\it\phi}$
is porosity. We adopt a simple cubic law for the permeability–porosity relationship,
${\it\phi}$
is porosity. We adopt a simple cubic law for the permeability–porosity relationship,
 $k=k_{0}({\it\phi}/{\it\phi}_{0})^{3}$
, where
$k=k_{0}({\it\phi}/{\it\phi}_{0})^{3}$
, where
 $k_{0}$
and
$k_{0}$
and
 ${\it\phi}_{0}$
are the initial permeability and porosity, respectively. This relationship captures the evolution in permeability induced by porosity increase observed in laboratory experiments (Carroll et al.
Reference Carroll, Hao, Smith and Sholokhova2013).
${\it\phi}_{0}$
are the initial permeability and porosity, respectively. This relationship captures the evolution in permeability induced by porosity increase observed in laboratory experiments (Carroll et al.
Reference Carroll, Hao, Smith and Sholokhova2013).

Figure 1. The problem is set up in a two-dimensional square homogeneous porous medium composed mainly of carbonate rocks. The domain is impermeable at the top and bottom. Solution 1, the equilibrated
 $\text{CO}_{2}$
-rich brine, enters via diffusion at the top of the formation, which is initially saturated with solution 2, the equilibrated aquifer brine.
$\text{CO}_{2}$
-rich brine, enters via diffusion at the top of the formation, which is initially saturated with solution 2, the equilibrated aquifer brine.
We denote the density of solution 1 as
 ${\it\rho}_{1}$
and that of solution 2 as
${\it\rho}_{1}$
and that of solution 2 as
 ${\it\rho}_{2}$
, where
${\it\rho}_{2}$
, where
 ${\it\rho}_{1}>{\it\rho}_{2}$
, and the density difference as
${\it\rho}_{1}>{\it\rho}_{2}$
, and the density difference as
 ${\rm\Delta}{\it\rho}={\it\rho}_{1}-{\it\rho}_{2}>0$
. We define the mixing ratio
${\rm\Delta}{\it\rho}={\it\rho}_{1}-{\it\rho}_{2}>0$
. We define the mixing ratio
 ${\it\alpha}$
as the volumetric ratio of solution 1 in the mixture:
${\it\alpha}$
as the volumetric ratio of solution 1 in the mixture:
 $$\begin{eqnarray}{\it\alpha}(x,z,t)=\frac{V_{solution\,1}}{V_{total}}.\end{eqnarray}$$
The density of the fluid mixture,
 ${\it\rho}$
, increases linearly with the mixing ratio:
${\it\rho}$
, increases linearly with the mixing ratio:
 $$\begin{eqnarray}{\it\rho}={\it\rho}_{2}+{\rm\Delta}{\it\rho}\,{\it\alpha}.\end{eqnarray}$$
When the two solutions mix at
 ${\it\alpha}$
, chemical equilibrium is temporarily disturbed locally and the mixture undergoes a series of geochemical reactions to reach a new equilibrium with calcite. While this process can be complicated by the participation of other co-existing minerals such as magnesite (
${\it\alpha}$
, chemical equilibrium is temporarily disturbed locally and the mixture undergoes a series of geochemical reactions to reach a new equilibrium with calcite. While this process can be complicated by the participation of other co-existing minerals such as magnesite (
 $\text{MgCO}_{3}$
) or gypsum (
$\text{MgCO}_{3}$
) or gypsum (
 $\text{CaSO}_{4}\cdot \text{H}_{2}\text{O}$
), the dominant effect can be captured with the following four reactions (Sanford & Konikow Reference Sanford and Konikow1989; De Simoni et al.
Reference De Simoni, Sánchez-Vila, Carrera and Saaltink2007):
$\text{CaSO}_{4}\cdot \text{H}_{2}\text{O}$
), the dominant effect can be captured with the following four reactions (Sanford & Konikow Reference Sanford and Konikow1989; De Simoni et al.
Reference De Simoni, Sánchez-Vila, Carrera and Saaltink2007):
 $$\begin{eqnarray}\displaystyle & \text{HCO}_{3}^{-}\rightleftharpoons \text{CO}_{2}+\text{H}_{2}\text{O}-\text{H}^{+} & \displaystyle\end{eqnarray}$$
 $$\begin{eqnarray}\displaystyle & \text{CO}_{3}^{2-}\rightleftharpoons \text{CO}_{2}+\text{H}_{2}\text{O}-2\text{H}^{+} & \displaystyle\end{eqnarray}$$
 $$\begin{eqnarray}\displaystyle & \text{Ca}^{2+}\rightleftharpoons \text{CaCO}_{3}-\text{CO}_{2}-\text{H}_{2}\text{O}+2\text{H}^{+} & \displaystyle\end{eqnarray}$$
 $$\begin{eqnarray}\displaystyle & \text{OH}^{-}\rightleftharpoons \text{H}_{2}\text{O}-\text{H}^{+}. & \displaystyle\end{eqnarray}$$
Eight chemical species participate in these reactions, namely calcium carbonate (
 $\text{CaCO}_{3}$
), water (
$\text{CaCO}_{3}$
), water (
 $\text{H}_{2}\text{O}$
), carbon dioxide (
$\text{H}_{2}\text{O}$
), carbon dioxide (
 $\text{CO}_{2}$
), hydrogen ion (
$\text{CO}_{2}$
), hydrogen ion (
 $\text{H}^{+}$
), bicarbonate (
$\text{H}^{+}$
), bicarbonate (
 $\text{HCO}_{3}^{-}$
), carbonate (
$\text{HCO}_{3}^{-}$
), carbonate (
 $\text{CO}_{3}^{2-}$
), calcium ion (
$\text{CO}_{3}^{2-}$
), calcium ion (
 $\text{Ca}^{2+}$
) and hydroxide (
$\text{Ca}^{2+}$
) and hydroxide (
 $\text{OH}^{-}$
). Adopting the approach of De Simoni et al. (Reference De Simoni, Sánchez-Vila, Carrera and Saaltink2007) discussed in § 1.1, we track the mixing ratio
$\text{OH}^{-}$
). Adopting the approach of De Simoni et al. (Reference De Simoni, Sánchez-Vila, Carrera and Saaltink2007) discussed in § 1.1, we track the mixing ratio
 ${\it\alpha}$
, which is a conserved quantity in the system equivalent to
${\it\alpha}$
, which is a conserved quantity in the system equivalent to
 ${\it\tau}$
in (1.3), using the advection–diffusion equation:
${\it\tau}$
in (1.3), using the advection–diffusion equation:
 $$\begin{eqnarray}{\it\phi}\frac{\partial {\it\alpha}}{\partial t}+\boldsymbol{{\rm\nabla}}\boldsymbol{\cdot }(\boldsymbol{u}{\it\alpha})-\boldsymbol{{\rm\nabla}}\boldsymbol{\cdot }({\it\phi}D\boldsymbol{{\rm\nabla}}{\it\alpha})=0,\end{eqnarray}$$
where
 $D$
is the diffusion/dispersion coefficient, taken here as constant. We assume here that
$D$
is the diffusion/dispersion coefficient, taken here as constant. We assume here that
 $D$
is the same for all chemical species in the system and is also the same as that of the fluid mixture. Using (1.4), we can then explicitly calculate the rate of calcite dissolution, which according to (2.6) is also the production rate for
$D$
is the same for all chemical species in the system and is also the same as that of the fluid mixture. Using (1.4), we can then explicitly calculate the rate of calcite dissolution, which according to (2.6) is also the production rate for
 $\text{Ca}^{2+}$
:
$\text{Ca}^{2+}$
:
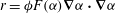
 $$\begin{eqnarray}r=2{\it\phi}F({\it\alpha})\left(\boldsymbol{{\rm\nabla}}{\it\alpha}\boldsymbol{\cdot }D\boldsymbol{{\rm\nabla}}{\it\alpha}\right),\quad F({\it\alpha})=\frac{\partial ^{2}[\text{Ca}^{2+}]}{\partial {\it\alpha}^{2}},\end{eqnarray}$$
where
 $F({\it\alpha})$
is the speciation term associated with
$F({\it\alpha})$
is the speciation term associated with
 $\text{Ca}^{2+}$
that we obtain a priori with a geochemical code such as PHREEQC (see appendix B). Equation (2.9) states that the local rate of porosity change is controlled by two mechanisms: (i) chemical speciation of calcium ion,
$\text{Ca}^{2+}$
that we obtain a priori with a geochemical code such as PHREEQC (see appendix B). Equation (2.9) states that the local rate of porosity change is controlled by two mechanisms: (i) chemical speciation of calcium ion,
 $F({\it\alpha})$
, which measures the vigor of the rock dissolution reaction in (2.6); and (ii) strength of fluid mixing, which is measured in terms of scalar dissipation rate of
$F({\it\alpha})$
, which measures the vigor of the rock dissolution reaction in (2.6); and (ii) strength of fluid mixing, which is measured in terms of scalar dissipation rate of
 ${\it\alpha}$
. Finally, we update porosity locally using the calcite dissolution rate
${\it\alpha}$
. Finally, we update porosity locally using the calcite dissolution rate
 $r$
:
$r$
:
 $$\begin{eqnarray}c_{s}\frac{\partial {\it\phi}}{\partial t}=r{\it\Theta}({\it\phi}_{1}-{\it\phi}),\end{eqnarray}$$
where
 $c_{s}$
is the molar density of calcite, and
$c_{s}$
is the molar density of calcite, and
 ${\it\Theta}$
is the Heaviside step function that limits the increase in porosity to a maximum value
${\it\Theta}$
is the Heaviside step function that limits the increase in porosity to a maximum value
 ${\it\phi}_{1}$
, which accounts for the presence of residual minerals that are non-reactive in the system. Once
${\it\phi}_{1}$
, which accounts for the presence of residual minerals that are non-reactive in the system. Once
 ${\it\phi}$
reaches
${\it\phi}$
reaches
 ${\it\phi}_{1}$
locally, the assumption of chemical equilibrium fails since there is no more calcite to react with the unequilibriated mixtures; nevertheless, we assume equilibrium for solutions that pass through the inert area. We keep this special case in mind and address its limitations when we interpret the results in § 3.2.
${\it\phi}_{1}$
locally, the assumption of chemical equilibrium fails since there is no more calcite to react with the unequilibriated mixtures; nevertheless, we assume equilibrium for solutions that pass through the inert area. We keep this special case in mind and address its limitations when we interpret the results in § 3.2.
We choose as characteristic velocity the speed at which a fluid parcel sinks in the porous medium:
 $U_{c}=k_{0}{\rm\Delta}{\it\rho}g/{\it\mu}$
. The natural length scale is the length over which diffusion and advection are balanced:
$U_{c}=k_{0}{\rm\Delta}{\it\rho}g/{\it\mu}$
. The natural length scale is the length over which diffusion and advection are balanced:
 $L={\it\phi}D/U_{c}$
. We choose to rescale the problem with this intrinsic length scale
$L={\it\phi}D/U_{c}$
. We choose to rescale the problem with this intrinsic length scale
 $L$
as it is more relevant than domain height (
$L$
as it is more relevant than domain height (
 $H$
) for characterizing local quantity changes. We set the other characteristic quantities as
$H$
) for characterizing local quantity changes. We set the other characteristic quantities as
 $$\begin{eqnarray}{\it\rho}_{c}={\rm\Delta}{\it\rho},\quad P_{c}={\rm\Delta}{\it\rho}gL,\quad T_{c}=\frac{{\it\phi}_{0}L}{U_{c}},\quad {\it\phi}_{c}={\it\phi}_{0},\quad F_{c}=\max (|F({\it\alpha})|),\quad r_{c}=\frac{2{\it\phi}_{0}F_{c}D}{L^{2}}.\end{eqnarray}$$
Applying these scales, we obtain three dimensionless parameters: the dimensionless domain height
 $\text{H}=H/L$
, the maximum relative porosity increase
$\text{H}=H/L$
, the maximum relative porosity increase
 $R_{{\it\phi}}={\it\phi}_{1}/{\it\phi}_{0}$
, and the dissolution Damkhöler number:
$R_{{\it\phi}}={\it\phi}_{1}/{\it\phi}_{0}$
, and the dissolution Damkhöler number:
 $$\begin{eqnarray}\mathit{Da}=\frac{r_{c}T_{c}}{c_{s}{\it\phi}_{0}}=\frac{2F_{c}}{c_{s}}.\end{eqnarray}$$
Since we use the intrinsic length scale here, the Rayleigh number (
 $\mathit{Ra}=U_{c}L/D$
) is identically equal to one, and
$\mathit{Ra}=U_{c}L/D$
) is identically equal to one, and
 $\text{H}$
plays the role of the traditional
$\text{H}$
plays the role of the traditional
 $\mathit{Ra}$
(Hidalgo & Carrera Reference Hidalgo and Carrera2009). The dissolution Damkhöler number measures the competition between rock dissolution rate and solute transport velocity. In dimensionless form, the governing equations read
$\mathit{Ra}$
(Hidalgo & Carrera Reference Hidalgo and Carrera2009). The dissolution Damkhöler number measures the competition between rock dissolution rate and solute transport velocity. In dimensionless form, the governing equations read
 $$\begin{eqnarray}\displaystyle & \boldsymbol{{\rm\nabla}}\boldsymbol{\cdot }\boldsymbol{u}=0,\quad \boldsymbol{u}=-{\it\phi}^{3}(\boldsymbol{{\rm\nabla}}P^{\prime }-{\it\alpha}\boldsymbol{z}), & \displaystyle\end{eqnarray}$$
 $$\begin{eqnarray}\displaystyle & \displaystyle {\it\phi}\frac{\partial {\it\alpha}}{\partial t}+\boldsymbol{{\rm\nabla}}\boldsymbol{\cdot }(\boldsymbol{u}{\it\alpha})-\boldsymbol{{\rm\nabla}}\boldsymbol{\cdot }({\it\phi}\boldsymbol{{\rm\nabla}}{\it\alpha})=0, & \displaystyle\end{eqnarray}$$
 $$\begin{eqnarray}\displaystyle & \displaystyle \frac{\partial {\it\phi}}{\partial t}=\mathit{Da}~r{\it\Theta}(R_{{\it\phi}}-{\it\phi}/{\it\phi}_{0}),\quad r={\it\phi}F({\it\alpha})(\boldsymbol{{\rm\nabla}}{\it\alpha}\boldsymbol{\cdot }\boldsymbol{{\rm\nabla}}{\it\alpha}). & \displaystyle\end{eqnarray}$$
Here,
 $P^{\prime }$
is the dimensionless pressure with respect to a hydrostatic datum posed by
$P^{\prime }$
is the dimensionless pressure with respect to a hydrostatic datum posed by
 ${\it\rho}_{2}$
. The boundary and initial conditions are
${\it\rho}_{2}$
. The boundary and initial conditions are
 $$\begin{eqnarray}\displaystyle {\it\alpha}(x,z=0)=1,\quad \left.\frac{\partial {\it\alpha}}{\partial z}\right|_{x,z=\text{H}}=0,\end{eqnarray}$$
 $$\begin{eqnarray}\boldsymbol{u}\boldsymbol{\cdot }\boldsymbol{n}(x,z=0)=0,\quad \boldsymbol{u}\boldsymbol{\cdot }\boldsymbol{n}(x,z=\text{H})=0,\end{eqnarray}$$
 $$\begin{eqnarray}{\it\phi}(t=0)=1,\quad {\it\alpha}(t=0)=0.\end{eqnarray}$$
We adopt a stream function–vorticity formulation for (2.13) (Tan & Homsy Reference Tan and Homsy1988; Riaz & Meiburg Reference Riaz and Meiburg2003; Fu et al. Reference Fu, Cueto-Felgueroso and Juanes2013) and solve for the stream functions with an eighth-order finite difference scheme, implemented with a fast Poisson solver (Swarztrauber Reference Swarztrauber1977). To evaluate the derivatives used in the transport equation (2.14) and consumption rate (2.15b ), we use sixth-order compact finite differences in the vertical direction (Lele Reference Lele1992) and a Fourier discretization along the horizontal direction, which we assume to be periodic. We integrate (2.14) and (2.15a ) sequentially in time using a third-order Runge–Kutta scheme with dynamic time stepping (Ruith & Meiburg Reference Ruith and Meiburg2000). We accelerate the onset of the gravitational instability by perturbing the initial mixing ratios at the top boundary with small white noise (an uncorrelated Gaussian random function).
3. Dissolution regimes
In this section, we describe dissolution patterns as a result of the reaction with calcite, and we illustrate the various dissolution regimes. Specifically, we focus on
 $\langle {\rm\Delta}{\it\phi}\rangle$
, the domain-averaged porosity increase, and
$\langle {\rm\Delta}{\it\phi}\rangle$
, the domain-averaged porosity increase, and
 $\text{d}\langle {\it\alpha}\rangle /\text{d}t$
, the time derivative of the domain-averaged pore–volume ratio of solution 1 (the equilibrated
$\text{d}\langle {\it\alpha}\rangle /\text{d}t$
, the time derivative of the domain-averaged pore–volume ratio of solution 1 (the equilibrated
 $\text{CO}_{2}$
-rich brine), or cumulative mass of solution 1 in the domain. We solve the governing equations for Damkhöler numbers up to 20 and values of
$\text{CO}_{2}$
-rich brine), or cumulative mass of solution 1 in the domain. We solve the governing equations for Damkhöler numbers up to 20 and values of
 $\text{H}$
up to 6000 on a grid of
$\text{H}$
up to 6000 on a grid of
 $2500^{2}$
cells. Convergence tests show that the required grid resolution increases superlinearly with the product of
$2500^{2}$
cells. Convergence tests show that the required grid resolution increases superlinearly with the product of
 $\text{H}$
and
$\text{H}$
and
 $\mathit{Da}$
since both parameters have a combined effect on generating small-scale details.
$\mathit{Da}$
since both parameters have a combined effect on generating small-scale details.

Figure 2. Snapshots of mixing ratio (a) and porosity percentage increase (b) for a simulation with
 $\text{H}=6000$
,
$\text{H}=6000$
,
 $\mathit{Da}=20$
and
$\mathit{Da}=20$
and
 $R_{{\it\phi}}=2$
at time
$R_{{\it\phi}}=2$
at time
 $t=0.6\text{H}$
(top), 4H (middle) and 15H (bottom).
$t=0.6\text{H}$
(top), 4H (middle) and 15H (bottom).
3.1. Mixing-controlled dissolution patterns
The diffusive layer of solution-1-rich mixture near the top boundary becomes gravitationally unstable after some initial onset time, resulting in finger-like structures (figure 2, top left) that migrate downwards, stripping away the dense fluid (figure 2, middle left). Fingering dynamics and scaling relations have been studied extensively (Riaz et al. Reference Riaz, Hesse, Tchelepi and Orr2006; Hassanzadeh et al. Reference Hassanzadeh, Pooladi-Darvish and Keith2007; Hidalgo & Carrera Reference Hidalgo and Carrera2009; Hidalgo et al. Reference Hidalgo, Fe, Cueto-Felgueroso and Juanes2012; Hewitt, Neufeld & Lister Reference Hewitt, Neufeld and Lister2013; Slim et al. Reference Slim, Bandi, Miller and Mahadevan2013; Slim Reference Slim2014) and will not be the focus of this work. The density-driven flow leads to mixing of fluids and triggers rock dissolution reactions which alter the permeability field. Initially, these reactions chisel out patterns that follow closely the interface of the fluid fingers, leaving the interior of these fingering channels almost unaffected (figure 2, top and middle right). The ‘hollowness’ of the dissolution patterns can be understood as the direct consequence of a mixing-controlled dissolution rate (1.4). The rate of fluid mixing, as measured by the scalar dissipation rate, is strongest along finger interfaces where the concentration gradient is large (Hidalgo et al. Reference Hidalgo, Fe, Cueto-Felgueroso and Juanes2012) and is weak within the core of the fingers, where concentration gradients are small. Over time, the rock dissolution patterns evolve in two ways.
-
(a) Elongation towards the bottom: new fingers are continuously born at the top boundary; the cascade of fingers of different ages interact through a merging process where young fingers merge into old ones, small ones into bigger ones, allowing the surviving fingers to sink and coarsen laterally in size (Riaz et al. Reference Riaz, Hesse, Tchelepi and Orr2006; Hassanzadeh et al. Reference Hassanzadeh, Pooladi-Darvish and Keith2007; Pau et al. Reference Pau, Bell, Pruess, Almgren, Lijewski and Zhang2010; Slim Reference Slim2014). As a result, finger-like dissolution channels continue to extend downwards and expand laterally (figure 2, bottom), following the locations of finger interfaces where mixing is strong.
-
(b) Focusing near the top: while dissolution channels elongate towards the bottom due to downward migration of fingers, regions of high rock dissolution, or ‘dissolution hubs’ start to appear near the top boundary (figure 2, bottom). These hubs develop as a result of repeated events of newly born fingers carrying
${\it\alpha}\approx 1$
meeting the upwelling plume of
${\it\alpha}\approx 0$
, creating high concentration gradients that result in strong mixing and reaction.


Figure 3. Volume-averaged measures of (a) percentage increase in
 ${\it\phi}$
(b) chemical speciation and (c) scalar dissipation rate over time for a simulation with
${\it\phi}$
(b) chemical speciation and (c) scalar dissipation rate over time for a simulation with
 $\text{H}=6000$
. The transition in curve colour from light orange to dark indicates increase in
$\text{H}=6000$
. The transition in curve colour from light orange to dark indicates increase in
 $\mathit{Da}$
. The dark circles in (a) and (b) indicate the shutdown time
$\mathit{Da}$
. The dark circles in (a) and (b) indicate the shutdown time
 $t_{sd}^{{\rm\Delta}{\it\phi}}$
and
$t_{sd}^{{\rm\Delta}{\it\phi}}$
and
 $t_{sd}^{F({\it\alpha})}$
, respectively, as defined in § 3.2. (d) Cumulative (volume-averaged) porosity increase plotted against
$t_{sd}^{F({\it\alpha})}$
, respectively, as defined in § 3.2. (d) Cumulative (volume-averaged) porosity increase plotted against
 $\mathit{Da}$
for different values of
$\mathit{Da}$
for different values of
 $\mathit{H}$
(square, triangle and circle). (e,f) Plots of
$\mathit{H}$
(square, triangle and circle). (e,f) Plots of
 $t_{sd}^{{\rm\Delta}{\it\phi}}$
and
$t_{sd}^{{\rm\Delta}{\it\phi}}$
and
 $t_{sd}^{F({\it\alpha})}$
against
$t_{sd}^{F({\it\alpha})}$
against
 $\mathit{Da}$
for different values of
$\mathit{Da}$
for different values of
 $\mathit{H}$
.
$\mathit{H}$
.
3.2. Speciation-controlled reaction shutdown
The overall dissolution pattern is controlled by fluid mixing, as evidenced by the spatial correlation between the permeability and mixing fields. However, the magnitude of permeability increase, or how much reaction occurs when the two fluids mix, is set by the shape of the speciation term
 $F({\it\alpha})$
. As shown in figure 10 in appendix B,
$F({\it\alpha})$
. As shown in figure 10 in appendix B,
 $F({\it\alpha})$
for our geochemical system is a highly nonlinear function, showing that reaction is favoured in the lower range of mixing ratios (
$F({\it\alpha})$
for our geochemical system is a highly nonlinear function, showing that reaction is favoured in the lower range of mixing ratios (
 ${\it\alpha}<0.1$
); when
${\it\alpha}<0.1$
); when
 ${\it\alpha}>0.2$
,
${\it\alpha}>0.2$
,
 $F({\it\alpha})$
becomes so small that regardless of the strength of local mixing, almost no reaction will take place. The behaviour of this speciation curve is crucial for explaining the system’s evolution.
$F({\it\alpha})$
becomes so small that regardless of the strength of local mixing, almost no reaction will take place. The behaviour of this speciation curve is crucial for explaining the system’s evolution.
For a simulation with
 $\text{H}=6000$
,
$\text{H}=6000$
,
 $\mathit{Da}=20$
, we track the domain-averaged porosity increase
$\mathit{Da}=20$
, we track the domain-averaged porosity increase
 $\langle {\rm\Delta}{\it\phi}\rangle$
with time, and find that after a period of monotonic growth,
$\langle {\rm\Delta}{\it\phi}\rangle$
with time, and find that after a period of monotonic growth,
 $\langle {\rm\Delta}{\it\phi}\rangle$
reaches a plateau, indicating a shutdown of dissolution reactions globally (figure 3
a). We compute the time for dissolution shutdown,
$\langle {\rm\Delta}{\it\phi}\rangle$
reaches a plateau, indicating a shutdown of dissolution reactions globally (figure 3
a). We compute the time for dissolution shutdown,
 $t_{sd}^{{\rm\Delta}{\it\phi}}$
, as the time when
$t_{sd}^{{\rm\Delta}{\it\phi}}$
, as the time when
 $\langle {\rm\Delta}{\it\phi}\rangle$
reaches 95 % of the plateau value, denoted
$\langle {\rm\Delta}{\it\phi}\rangle$
reaches 95 % of the plateau value, denoted
 $\langle {\rm\Delta}{\it\phi}\rangle _{sd}$
; the shutdown times are shown as dark circles in figure 3(a). We next track the domain-averaged speciation term over time and find that it also flattens out towards zero after some period of time. We compute the corresponding time for speciation shutdown,
$\langle {\rm\Delta}{\it\phi}\rangle _{sd}$
; the shutdown times are shown as dark circles in figure 3(a). We next track the domain-averaged speciation term over time and find that it also flattens out towards zero after some period of time. We compute the corresponding time for speciation shutdown,
 $t_{sd}^{F({\it\alpha})}$
, shown as dark circles in figure 3(b), as the time when
$t_{sd}^{F({\it\alpha})}$
, shown as dark circles in figure 3(b), as the time when
 $\langle F({\it\alpha})\rangle$
falls below 0.02. Shutdown time for dissolution corresponds closely to that of speciation (figure 3
a,b, dark circles) and this shutdown happens much earlier than the decaying of global degree of mixing (figure 3
c). In other words, while reaction-inducing fluid mixing is still active in the system, the fast decay of chemical speciation has caused the dissolution reactions to stop at a much earlier time. We refer to this as a speciation-controlled reaction shutdown. The concept of convective shutdown was coined in the context of the one-sided convection system to describe the effect of domain saturation on the mass flux (Hewitt et al.
Reference Hewitt, Neufeld and Lister2013). Here, we find a shutdown in reaction caused by the decay of chemical speciation, not the loss in strength of the convective instability.
$\langle F({\it\alpha})\rangle$
falls below 0.02. Shutdown time for dissolution corresponds closely to that of speciation (figure 3
a,b, dark circles) and this shutdown happens much earlier than the decaying of global degree of mixing (figure 3
c). In other words, while reaction-inducing fluid mixing is still active in the system, the fast decay of chemical speciation has caused the dissolution reactions to stop at a much earlier time. We refer to this as a speciation-controlled reaction shutdown. The concept of convective shutdown was coined in the context of the one-sided convection system to describe the effect of domain saturation on the mass flux (Hewitt et al.
Reference Hewitt, Neufeld and Lister2013). Here, we find a shutdown in reaction caused by the decay of chemical speciation, not the loss in strength of the convective instability.
We extend the above analysis to a range of values of
 $\text{H}$
and
$\text{H}$
and
 $\mathit{Da}$
, and find that the plateau value
$\mathit{Da}$
, and find that the plateau value
 $\langle {\rm\Delta}{\it\phi}\rangle _{sd}$
scales linearly with
$\langle {\rm\Delta}{\it\phi}\rangle _{sd}$
scales linearly with
 $\mathit{Da}$
(figure 3
d):
$\mathit{Da}$
(figure 3
d):
 $$\begin{eqnarray}\langle {\rm\Delta}{\it\phi}\rangle _{sd}\sim \mathit{Da},\end{eqnarray}$$
which is a consequence of the role that
 $\mathit{Da}$
plays in the porosity-update equation (2.15a
). The shutdown time for dissolution and speciation both decrease with increasing
$\mathit{Da}$
plays in the porosity-update equation (2.15a
). The shutdown time for dissolution and speciation both decrease with increasing
 $\mathit{Da}$
(figure 3
e, f). This is because as
$\mathit{Da}$
(figure 3
e, f). This is because as
 $\mathit{Da}$
increases, the permeability near the top boundary increases faster, allowing fluid to enter and saturate the domain faster, and leading to an earlier speciation shutdown (see further discussion in § 4). We find that
$\mathit{Da}$
increases, the permeability near the top boundary increases faster, allowing fluid to enter and saturate the domain faster, and leading to an earlier speciation shutdown (see further discussion in § 4). We find that
 $\text{H}$
, on the other hand, has little impact on
$\text{H}$
, on the other hand, has little impact on
 $\langle {\rm\Delta}{\it\phi}\rangle _{sd}$
and
$\langle {\rm\Delta}{\it\phi}\rangle _{sd}$
and
 $t_{sd}^{{\rm\Delta}{\it\phi}}$
, an observation that is consistent with the fact that the rate of fluid mixing is independent of
$t_{sd}^{{\rm\Delta}{\it\phi}}$
, an observation that is consistent with the fact that the rate of fluid mixing is independent of
 $\text{H}$
(Hidalgo et al.
Reference Hidalgo, Fe, Cueto-Felgueroso and Juanes2012).
$\text{H}$
(Hidalgo et al.
Reference Hidalgo, Fe, Cueto-Felgueroso and Juanes2012).
We analyse the time series of the porosity field and find that the maximum porosity
 ${\it\phi}_{1}$
is reached locally for simulations with large
${\it\phi}_{1}$
is reached locally for simulations with large
 $\mathit{Da}$
and
$\mathit{Da}$
and
 $\text{H}$
after some initial period of dissolution and this critical time arrives later for smaller
$\text{H}$
after some initial period of dissolution and this critical time arrives later for smaller
 $\mathit{Da}$
and
$\mathit{Da}$
and
 $\text{H}$
. This indicates that the special case of non-equilibrium state as discussed in § 2 is indeed present in some of our simulations. For small enough
$\text{H}$
. This indicates that the special case of non-equilibrium state as discussed in § 2 is indeed present in some of our simulations. For small enough
 $\mathit{Da}$
and
$\mathit{Da}$
and
 $\text{H}$
(e.g.
$\text{H}$
(e.g.
 $\text{H}=2000$
with any
$\text{H}=2000$
with any
 $\mathit{Da}$
;
$\mathit{Da}$
;
 $\text{H}=4000$
with
$\text{H}=4000$
with
 $\mathit{Da}=1$
;
$\mathit{Da}=1$
;
 $\text{H}=6000$
with
$\text{H}=6000$
with
 $\mathit{Da}=1$
), however,
$\mathit{Da}=1$
), however,
 ${\it\phi}_{1}$
is not reached anywhere. When
${\it\phi}_{1}$
is not reached anywhere. When
 ${\it\phi}_{1}$
is reached, we find that the spatial spread of the non-equilibrium state is focused near the top boundary and accounts for a small portion of the domain, between 0.17 and 0.69 %. This suggests that non-equilibrium effects are not critical in our examples. However, such non-equilibrium effect could be more important for simulations with large Damkhöler numbers as the maximum
${\it\phi}_{1}$
is reached, we find that the spatial spread of the non-equilibrium state is focused near the top boundary and accounts for a small portion of the domain, between 0.17 and 0.69 %. This suggests that non-equilibrium effects are not critical in our examples. However, such non-equilibrium effect could be more important for simulations with large Damkhöler numbers as the maximum
 ${\it\phi}$
could be reached early on in the simulation and impact larger areas.
${\it\phi}$
could be reached early on in the simulation and impact larger areas.
4. Impact on the macroscopic mass exchange rate
The macroscopic mass exchange rate measures how fast solution 1, the equilibrated
 $\text{CO}_{2}$
-rich brine at the top, enters the formation and mixes with the resident brine. It is a quantity of special interest in the context of geologic carbon sequestration as it determines the effectiveness of solubility trapping. Previous studies that do not account for geochemical reactions (Hassanzadeh et al.
Reference Hassanzadeh, Pooladi-Darvish and Keith2007; Pau et al.
Reference Pau, Bell, Pruess, Almgren, Lijewski and Zhang2010; Hidalgo et al.
Reference Hidalgo, Fe, Cueto-Felgueroso and Juanes2012; Hewitt et al.
Reference Hewitt, Neufeld and Lister2013; Slim et al.
Reference Slim, Bandi, Miller and Mahadevan2013; Slim Reference Slim2014) have shown that the exchange rate, often referred to as the
$\text{CO}_{2}$
-rich brine at the top, enters the formation and mixes with the resident brine. It is a quantity of special interest in the context of geologic carbon sequestration as it determines the effectiveness of solubility trapping. Previous studies that do not account for geochemical reactions (Hassanzadeh et al.
Reference Hassanzadeh, Pooladi-Darvish and Keith2007; Pau et al.
Reference Pau, Bell, Pruess, Almgren, Lijewski and Zhang2010; Hidalgo et al.
Reference Hidalgo, Fe, Cueto-Felgueroso and Juanes2012; Hewitt et al.
Reference Hewitt, Neufeld and Lister2013; Slim et al.
Reference Slim, Bandi, Miller and Mahadevan2013; Slim Reference Slim2014) have shown that the exchange rate, often referred to as the
 $\text{CO}_{2}$
flux, reaches a plateau after the onset of instability and remains constant until domain saturation starts to impact the top boundary, at which point the flux decays (figure 4,
$\text{CO}_{2}$
flux, reaches a plateau after the onset of instability and remains constant until domain saturation starts to impact the top boundary, at which point the flux decays (figure 4,
 $\mathit{Da}=0$
). Further, it has been shown that this constant flux is independent of the domain size
$\mathit{Da}=0$
). Further, it has been shown that this constant flux is independent of the domain size
 $\text{H}$
(Hidalgo et al.
Reference Hidalgo, Fe, Cueto-Felgueroso and Juanes2012; Slim Reference Slim2014). We address here how these observations change in the presence of rock dissolution reactions.
$\text{H}$
(Hidalgo et al.
Reference Hidalgo, Fe, Cueto-Felgueroso and Juanes2012; Slim Reference Slim2014). We address here how these observations change in the presence of rock dissolution reactions.

Figure 4. Volume-averaged measure of mass exchange rate of solution 1 for increasing Damkhöler numbers with
 $\text{H}=6000$
(a) and for three values of
$\text{H}=6000$
(a) and for three values of
 $\text{H}$
with
$\text{H}$
with
 $\mathit{Da}=20$
(b). The coarsest dashed curves in both figures correspond to the case with
$\mathit{Da}=20$
(b). The coarsest dashed curves in both figures correspond to the case with
 $\text{H}=6000$
and without reaction (
$\text{H}=6000$
and without reaction (
 $\mathit{Da}=0$
).
$\mathit{Da}=0$
).
We define the mass exchange rate as the volumetric flux of solution 1,
 $\text{d}\langle {\it\alpha}\rangle /\text{d}t$
, which we calculate by taking numerical derivative of
$\text{d}\langle {\it\alpha}\rangle /\text{d}t$
, which we calculate by taking numerical derivative of
 $\langle {\it\alpha}\rangle$
with respect to
$\langle {\it\alpha}\rangle$
with respect to
 $t$
. For simulations with fixed
$t$
. For simulations with fixed
 $\text{H}$
(e.g.
$\text{H}$
(e.g.
 $\text{H}=6000$
) and
$\text{H}=6000$
) and
 $\mathit{Da}>1$
, we observe significant differences with respect to the non-reactive case. Instead of reaching a plateau after the onset of convection, the flux continues to grow with time as a result of increasing permeability from rock dissolution near the top (figure 4
a); the rate of flux increase grows with
$\mathit{Da}>1$
, we observe significant differences with respect to the non-reactive case. Instead of reaching a plateau after the onset of convection, the flux continues to grow with time as a result of increasing permeability from rock dissolution near the top (figure 4
a); the rate of flux increase grows with
 $\mathit{Da}$
. When
$\mathit{Da}$
. When
 $\mathit{Da}$
is sufficiently large (e.g.
$\mathit{Da}$
is sufficiently large (e.g.
 $\mathit{Da}=20$
), the increase in
$\mathit{Da}=20$
), the increase in
 $\text{d}\langle {\it\alpha}\rangle /\text{d}t$
hits a ceiling early on (figure 4
a,
$\text{d}\langle {\it\alpha}\rangle /\text{d}t$
hits a ceiling early on (figure 4
a,
 $\mathit{Da}=20$
); this is because the relative porosity increase
$\mathit{Da}=20$
); this is because the relative porosity increase
 $\langle {\rm\Delta}{\it\phi}\rangle$
at the top has reached
$\langle {\rm\Delta}{\it\phi}\rangle$
at the top has reached
 $R_{{\it\phi}}$
and cannot increase further. In all cases, with or without reaction, the flux ultimately decays due to the effect of domain saturation and, as shown in figure 4, the flux decays at earlier times as
$R_{{\it\phi}}$
and cannot increase further. In all cases, with or without reaction, the flux ultimately decays due to the effect of domain saturation and, as shown in figure 4, the flux decays at earlier times as
 $\mathit{Da}$
increases. This is, again, because an increase in permeability leads to a more convective system that can reach saturation faster. These observations are largely independent of the values of
$\mathit{Da}$
increases. This is, again, because an increase in permeability leads to a more convective system that can reach saturation faster. These observations are largely independent of the values of
 $\text{H}$
(figure 4
b), similar to what we observe in § 3.2.
$\text{H}$
(figure 4
b), similar to what we observe in § 3.2.
5. Dissolution patterns in three dimensions
We simulate (2.13)–(2.15) with the same boundary and initial conditions in three dimensions, for a case with
 $\text{H}=2500$
,
$\text{H}=2500$
,
 $\mathit{Da}=5$
and
$\mathit{Da}=5$
and
 $R_{{\it\phi}}=2$
with a grid resolution of
$R_{{\it\phi}}=2$
with a grid resolution of
 $368^{3}$
cells. The numerical scheme is the same as that for two dimensions, where we use Fourier discretization in the
$368^{3}$
cells. The numerical scheme is the same as that for two dimensions, where we use Fourier discretization in the
 $x$
and
$x$
and
 $y$
directions and compact finite differences in the
$y$
directions and compact finite differences in the
 $z$
direction. Similar to the 2D results, the reaction shuts down at around
$z$
direction. Similar to the 2D results, the reaction shuts down at around
 $t/\text{H}=8$
. We present the final morphology (at
$t/\text{H}=8$
. We present the final morphology (at
 $t/\text{H}=14$
) of dissolved rock in figure 5. As the 3D columnar fingers move downwards (see more details in Fu et al.
Reference Fu, Cueto-Felgueroso and Juanes2013) they chisel out columnar-shaped regions along the finger–brine interfaces (figure 5
a) as a result of the high local concentration gradients. Underneath the top boundary layer, the interiors of fingers are barely affected by reaction (figure 7
b–f, black–white frames). These empty columns are analogous to the hollow channels observed in two dimensions (see § 3.1). At the top boundary we observe the same dissolution hubs as seen in two dimensions (§ 3.1); here, they take the shape of upside-down dunes, scattered and hanging from the top surface (figure 5
b).
$t/\text{H}=14$
) of dissolved rock in figure 5. As the 3D columnar fingers move downwards (see more details in Fu et al.
Reference Fu, Cueto-Felgueroso and Juanes2013) they chisel out columnar-shaped regions along the finger–brine interfaces (figure 5
a) as a result of the high local concentration gradients. Underneath the top boundary layer, the interiors of fingers are barely affected by reaction (figure 7
b–f, black–white frames). These empty columns are analogous to the hollow channels observed in two dimensions (see § 3.1). At the top boundary we observe the same dissolution hubs as seen in two dimensions (§ 3.1); here, they take the shape of upside-down dunes, scattered and hanging from the top surface (figure 5
b).

Figure 5. Dissolution patterns in three dimensions: for a simulation of
 $\text{H}=2500,~\mathit{Da}=5$
and
$\text{H}=2500,~\mathit{Da}=5$
and
 $R_{{\it\phi}}=2$
, at
$R_{{\it\phi}}=2$
, at
 $t/\text{H}=14.0$
, this figure shows surface contours for (a)
$t/\text{H}=14.0$
, this figure shows surface contours for (a)
 ${\rm\Delta}{\it\phi}=4\,\%$
and (b)
${\rm\Delta}{\it\phi}=4\,\%$
and (b)
 ${\rm\Delta}{\it\phi}=8\,\%$
.
${\rm\Delta}{\it\phi}=8\,\%$
.
While 3D visualization gives insight into the morphology of the rock dissolution patterns, it provides limited quantitative details. To obtain more information about the interior structure of the dissolution morphology, we plot horizontal slices of
 ${\rm\Delta}{\it\phi}/{\it\phi}_{0}$
at six depths:
${\rm\Delta}{\it\phi}/{\it\phi}_{0}$
at six depths:
 $z/\text{H}=0.01$
(top boundary layer),
$z/\text{H}=0.01$
(top boundary layer),
 $z/\text{H}=0.14,027,0.54$
and
$z/\text{H}=0.14,027,0.54$
and
 $0.82$
(the bulk) and
$0.82$
(the bulk) and
 $z/\text{H}=1.0$
(bottom). As fingers start to arrive at a given depth, circular rings of dissolved rock emerge within the horizontal plane, reflecting the shape of fingering plumes at those depths. With the exception of the top boundary layer (
$z/\text{H}=1.0$
(bottom). As fingers start to arrive at a given depth, circular rings of dissolved rock emerge within the horizontal plane, reflecting the shape of fingering plumes at those depths. With the exception of the top boundary layer (
 $z/\text{H}=0.01$
), the dissolved rings continue to expand laterally to form a tessellation of polygons. The polygons are ‘hollow’ inside and separated from each other by a clearly defined polygonal network of undissolved edges (figure 7
b–f, black and white frames). Once the tessellation has evolved into its full form, usually within
$z/\text{H}=0.01$
), the dissolved rings continue to expand laterally to form a tessellation of polygons. The polygons are ‘hollow’ inside and separated from each other by a clearly defined polygonal network of undissolved edges (figure 7
b–f, black and white frames). Once the tessellation has evolved into its full form, usually within
 ${\rm\Delta}t=2500$
after the fingers invade that depth, the pattern ‘freezes’ in time due to a drastic reduction in dissolution activity.
${\rm\Delta}t=2500$
after the fingers invade that depth, the pattern ‘freezes’ in time due to a drastic reduction in dissolution activity.
We track the dissolution rate at each depth as a function of time, denoted here as
 $\text{d}\langle {\it\phi}\rangle _{z}/\text{d}t$
, where
$\text{d}\langle {\it\phi}\rangle _{z}/\text{d}t$
, where
 $\langle \cdot \rangle _{z}$
is the average across the
$\langle \cdot \rangle _{z}$
is the average across the
 $x{-}y$
plane, and observe that the dissolution rates peak at around the time that dissolution structures ‘freeze’ at that depth (figure 6). Similar to earlier observations in two dimensions (§ 3.2), the ‘freezing’ of rock dissolution structures is a consequence of a speciation-controlled reaction shutdown: once fingers arrive at a given layer, dissolution reactions take place for a short period of time; once the layer becomes weakly saturated with
$x{-}y$
plane, and observe that the dissolution rates peak at around the time that dissolution structures ‘freeze’ at that depth (figure 6). Similar to earlier observations in two dimensions (§ 3.2), the ‘freezing’ of rock dissolution structures is a consequence of a speciation-controlled reaction shutdown: once fingers arrive at a given layer, dissolution reactions take place for a short period of time; once the layer becomes weakly saturated with
 ${\it\alpha}$
(e.g.
${\it\alpha}$
(e.g.
 $\langle {\it\alpha}\rangle _{z}>0.1$
), the reactions stop. Figure 6 also clearly demonstrates the temporal dynamics of the shutdown process: instead of occurring all at once, the shutdown takes place at later times for deeper layers. Overall, this provides us with a more mechanistic description on how these tessellation patterns evolve: as fingers arrive at each layer, they imprint their ‘images’ through mineral dissolution onto the porosity field; once the reaction shuts down, the dissolution pattern becomes immune to further alterations by fingering dynamics.
$\langle {\it\alpha}\rangle _{z}>0.1$
), the reactions stop. Figure 6 also clearly demonstrates the temporal dynamics of the shutdown process: instead of occurring all at once, the shutdown takes place at later times for deeper layers. Overall, this provides us with a more mechanistic description on how these tessellation patterns evolve: as fingers arrive at each layer, they imprint their ‘images’ through mineral dissolution onto the porosity field; once the reaction shuts down, the dissolution pattern becomes immune to further alterations by fingering dynamics.

Figure 6. Dissolution rate (laterally averaged) at various depths over time. Dots (cyan-coloured online) correspond to the ‘freezing’ events, which is around the time that the tessellation pattern at that depth adopts its final configuration.
5.1. Coarsening of dissolution patterns
Finger coarsening in non-reactive convective mixing has been observed and quantified in both experimental studies (Backhaus et al.
Reference Backhaus, Turitsyn and Ecke2011; MacMinn & Juanes Reference MacMinn and Juanes2013) and simulations (Fu et al.
Reference Fu, Cueto-Felgueroso and Juanes2013; Hewitt et al.
Reference Hewitt, Neufeld and Lister2013; Slim et al.
Reference Slim, Bandi, Miller and Mahadevan2013). The dynamics of coarsening are different in the boundary layer and within the bulk. Near the top boundary, finger roots initially coarsen through a series of merging events but then reaches a statistical steady state, where the finger root spacing stands at a quasi-steady value (Fu et al.
Reference Fu, Cueto-Felgueroso and Juanes2013; MacMinn & Juanes Reference MacMinn and Juanes2013). On the other hand, finger coarsening in the bulk persists throughout the entire lifetime of the falling fingers (MacMinn & Juanes Reference MacMinn and Juanes2013). In this work, because dissolution structures are directly linked to the spatial arrangement of fingers, it is not surprising to find that the dissolution patterns also coarsen with depth (figure 7), in much the same way that fingers coarsen in the bulk. Here, we quantify this coarsening by counting the number dissolved polygonal rings (
 $N_{polygon}$
) as a function of depth (
$N_{polygon}$
) as a function of depth (
 $z$
), as seen in figure 7 (black and white frames) at
$z$
), as seen in figure 7 (black and white frames) at
 $t=14$
(figure 8). The analysis shows that the dissolution patterns coarsen with depth, and exhibit a robust power-law scaling:
$t=14$
(figure 8). The analysis shows that the dissolution patterns coarsen with depth, and exhibit a robust power-law scaling:
 $$\begin{eqnarray}N_{polygon}\sim z^{-1}.\end{eqnarray}$$

Figure 7. Horizontal slices of the reaction rate
 $r={\it\phi}F({\it\alpha})\boldsymbol{{\rm\nabla}}{\it\alpha}\boldsymbol{\cdot }\boldsymbol{{\rm\nabla}}{\it\alpha}$
(colour frames) and the relative porosity increase
$r={\it\phi}F({\it\alpha})\boldsymbol{{\rm\nabla}}{\it\alpha}\boldsymbol{\cdot }\boldsymbol{{\rm\nabla}}{\it\alpha}$
(colour frames) and the relative porosity increase
 ${\rm\Delta}{\it\phi}/{\it\phi}_{0}$
(black and white frames) at different depths: (a)
${\rm\Delta}{\it\phi}/{\it\phi}_{0}$
(black and white frames) at different depths: (a)
 $z/\text{H}=0.01$
; (b)
$z/\text{H}=0.01$
; (b)
 $z/\text{H}=0.14$
; (c)
$z/\text{H}=0.14$
; (c)
 $z/\text{H}=0.27$
; (d)
$z/\text{H}=0.27$
; (d)
 $z/\text{H}=0.54$
; (e)
$z/\text{H}=0.54$
; (e)
 $z/\text{H}=0.82$
; and ( f)
$z/\text{H}=0.82$
; and ( f)
 $z/\text{H}=1.0$
. The colour frames for
$z/\text{H}=1.0$
. The colour frames for
 $r$
are at different times: (a)
$r$
are at different times: (a)
 $t/\text{H}=6.0$
; (b)
$t/\text{H}=6.0$
; (b)
 $t/\text{H}=1.2$
;(c)
$t/\text{H}=1.2$
;(c)
 $t/\text{H}=2.7$
; (d)
$t/\text{H}=2.7$
; (d)
 $t/\text{H}=5.0$
; (e)
$t/\text{H}=5.0$
; (e)
 $t/\text{H}=7.8$
; and ( f)
$t/\text{H}=7.8$
; and ( f)
 $t/\text{H}=10.1$
(subtracted from a background image corresponding to
$t/\text{H}=10.1$
(subtracted from a background image corresponding to
 $t/\text{H}=8.9$
for clarity). Red indicates high value (colourmap not shown). The black and white frames for
$t/\text{H}=8.9$
for clarity). Red indicates high value (colourmap not shown). The black and white frames for
 ${\rm\Delta}{\it\phi}/{\it\phi}_{0}$
are all at time
${\rm\Delta}{\it\phi}/{\it\phi}_{0}$
are all at time
 $t/\text{H}=14.0$
. The colourmap range varies with depth to best reflect the dissolution structure.
$t/\text{H}=14.0$
. The colourmap range varies with depth to best reflect the dissolution structure.

Figure 8. Number of dissolved polygonal rings as a function of depth at
 $t=14$
.
$t=14$
.
The above scaling was suggested by an earlier study in two dimensions (MacMinn & Juanes Reference MacMinn and Juanes2013), where the number of fingers in the bulk is found to scale with convective time as:
 $N_{fingers}\sim t_{conv}^{-1}$
. This is indeed consistent with (5.1) if we consider a constant finger falling speed so that
$N_{fingers}\sim t_{conv}^{-1}$
. This is indeed consistent with (5.1) if we consider a constant finger falling speed so that
 $z\sim t_{conv}$
. However, understanding the mechanism that leads to such scaling remains a future task in this study.
$z\sim t_{conv}$
. However, understanding the mechanism that leads to such scaling remains a future task in this study.
6. Summary
In this paper, we study rock dissolution as a result of geochemical reactions during convective mixing in porous media, in the context of
 $\text{CO}_{2}$
sequestration. To couple geochemistry with flow and transport, we assume a mixing-limited reactive transport system where reactions reach chemical equilibrium instantaneously compared to the transport time scale. This allows us to adopt a formulation that completely decouples transport from reaction, and describes the local reaction rate as a function of scalar dissipation and chemical speciation (De Simoni et al.
Reference De Simoni, Carrera, Sánchez-Vila and Guadagnini2005). Using high-resolution simulations, we investigate the interplay between flow and reaction as a result of local permeability changes from rock dissolution. Because the reactive system we study here is mixing-limited, we find that the rate of rock dissolution is initially high in regions of high fluid mixing, which leads to dissolution patterns that closely follow the structure of the mixing field. However, geochemical reactions shut down much earlier than convective mixing shuts down; a result of the highly nonlinear behaviour of chemical speciation. This feature of a speciation-controlled shutdown highlight the important role that the details of the geochemical equilibrium play in this hydrodynamics–reaction coupled process.
$\text{CO}_{2}$
sequestration. To couple geochemistry with flow and transport, we assume a mixing-limited reactive transport system where reactions reach chemical equilibrium instantaneously compared to the transport time scale. This allows us to adopt a formulation that completely decouples transport from reaction, and describes the local reaction rate as a function of scalar dissipation and chemical speciation (De Simoni et al.
Reference De Simoni, Carrera, Sánchez-Vila and Guadagnini2005). Using high-resolution simulations, we investigate the interplay between flow and reaction as a result of local permeability changes from rock dissolution. Because the reactive system we study here is mixing-limited, we find that the rate of rock dissolution is initially high in regions of high fluid mixing, which leads to dissolution patterns that closely follow the structure of the mixing field. However, geochemical reactions shut down much earlier than convective mixing shuts down; a result of the highly nonlinear behaviour of chemical speciation. This feature of a speciation-controlled shutdown highlight the important role that the details of the geochemical equilibrium play in this hydrodynamics–reaction coupled process.
In both 2D and 3D simulations, we find that rock dissolution focuses on the top boundary, leaving the rock in the rest of the domain almost undissolved. As a result of the porosity increase at the top, we observe a significant increase in the rate at which the denser fluid enters the domain. This increase in solubility rate could enhance the effectiveness of
 $\text{CO}_{2}$
trapping in the context of a migrating plume (MacMinn et al.
Reference MacMinn, Szulczewski and Juanes2011). In the bulk, we see weak coupling from the rock dissolution patterns to the fingering dynamics, since the permeability increase is small below the boundary layer. We investigate the dissolution morphology in three dimensions and observe that the pattern at each depth exhibits a polygonal tessellation structure. This structure corresponds closely to the spatial arrangement of columnar fingers, and it also coarsens with depth in a similar way that convective fingers coarsen with time in the bulk of the domain.
$\text{CO}_{2}$
trapping in the context of a migrating plume (MacMinn et al.
Reference MacMinn, Szulczewski and Juanes2011). In the bulk, we see weak coupling from the rock dissolution patterns to the fingering dynamics, since the permeability increase is small below the boundary layer. We investigate the dissolution morphology in three dimensions and observe that the pattern at each depth exhibits a polygonal tessellation structure. This structure corresponds closely to the spatial arrangement of columnar fingers, and it also coarsens with depth in a similar way that convective fingers coarsen with time in the bulk of the domain.
Acknowledgements
This work was funded by the US Department of Energy through a DOE CAREER Award (grant DE-SC0003907) and a DOE Mathematical Multifaceted Integrated Capability Center (grant DE-SC0009286). L.C.-F. gratefully acknowledges a ‘Ramón y Cajal’ Fellowship from the Spanish Ministry of Economy and Competitiveness (RyC-2012-11704). D.B. would like to acknowledge partial funding via NSF grant EAR-1351625.
Appendix A. Comparison between time to reach chemical equilibrium and characteristic time of transport
The following analysis is specific to the chemical system in (2.4)–(2.7) but can be extended to other systems as well. We first estimate the time to reach chemical equilibrium when solutions 1 and 2 are mixed at a given
 ${\it\alpha}$
. We use the KINETICS data block in PHREEQC (Parkhurst Reference Parkhurst1995) and the Plummer–Wigley–Parkhurst rate model for calcite dissolution (Plummer, Wigley & Parkhurst Reference Plummer, Wigley and Parkhurst1978). Figure 9 plots calcium ion concentration over time for a mixture of
${\it\alpha}$
. We use the KINETICS data block in PHREEQC (Parkhurst Reference Parkhurst1995) and the Plummer–Wigley–Parkhurst rate model for calcite dissolution (Plummer, Wigley & Parkhurst Reference Plummer, Wigley and Parkhurst1978). Figure 9 plots calcium ion concentration over time for a mixture of
 ${\it\alpha}=0.01$
, showing that equilibrium is reached at around
${\it\alpha}=0.01$
, showing that equilibrium is reached at around
 $t=10~\text{h}$
. We confirm with additional kinetic simulations that equilibrium is reached within tens of hours for all values of
$t=10~\text{h}$
. We confirm with additional kinetic simulations that equilibrium is reached within tens of hours for all values of
 ${\it\alpha}$
(not shown here).
${\it\alpha}$
(not shown here).

Figure 9. When solutions 1 and 2 mix at
 ${\it\alpha}=0.01$
, concentration of
${\it\alpha}=0.01$
, concentration of
 $\text{Ca}^{2+}$
in the mixed solution increases over time as the mixture equilibrates over course of tens of hours.
$\text{Ca}^{2+}$
in the mixed solution increases over time as the mixture equilibrates over course of tens of hours.
We estimate the characteristic transport time across the natural length scale of the diffusive boundary layer
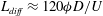 $L_{diff}\approx 120{\it\phi}D/U$
to be of the order of thousands of hours or more for a typical aquifer (
$L_{diff}\approx 120{\it\phi}D/U$
to be of the order of thousands of hours or more for a typical aquifer (
 $U={\rm\Delta}{\it\rho}gk/{\it\mu}$
is the characteristic velocity, where
$U={\rm\Delta}{\it\rho}gk/{\it\mu}$
is the characteristic velocity, where
 $k=10^{-13}~\text{m}^{2}$
,
$k=10^{-13}~\text{m}^{2}$
,
 $D=10^{-9}~\text{m}^{2}~\text{s}^{-1}$
,
$D=10^{-9}~\text{m}^{2}~\text{s}^{-1}$
,
 ${\rm\Delta}{\it\rho}=10~\text{kg}~\text{m}^{-3}$
,
${\rm\Delta}{\it\rho}=10~\text{kg}~\text{m}^{-3}$
,
 ${\it\mu}=0.8\times 10^{-3}~\text{kg}~\text{m}^{-1}~\text{s}^{-1}$
). We obtain the coefficient of 120 in
${\it\mu}=0.8\times 10^{-3}~\text{kg}~\text{m}^{-1}~\text{s}^{-1}$
). We obtain the coefficient of 120 in
 $L_{diff}$
by directly measuring the boundary-layer thickness from 3D simulations. To quantify the boundary-layer thickness, we sample the vertical concentration profile, at
$L_{diff}$
by directly measuring the boundary-layer thickness from 3D simulations. To quantify the boundary-layer thickness, we sample the vertical concentration profile, at
 $t=5$
, and at five different horizontal locations; we repeat the sampling for different Rayleigh numbers (figure 10
a). We then define the boundary-layer thickness as the depth below which the concentration is smaller than
$t=5$
, and at five different horizontal locations; we repeat the sampling for different Rayleigh numbers (figure 10
a). We then define the boundary-layer thickness as the depth below which the concentration is smaller than
 $c=0.3$
. With this, we calculate the boundary-layer thickness for each sample and obtain the average thickness for each Rayleigh number (figure 10
b). The fitted straight line in figure 10(b) suggests that
$c=0.3$
. With this, we calculate the boundary-layer thickness for each sample and obtain the average thickness for each Rayleigh number (figure 10
b). The fitted straight line in figure 10(b) suggests that
 $$\begin{eqnarray}\log _{10}\left(\frac{L_{diff}^{\ast }}{\mathit{Ra}}\right)=-\log _{10}(\mathit{Ra})+2.08,\end{eqnarray}$$
which yields
 $L_{diff}^{\ast }\approx 120$
or
$L_{diff}^{\ast }\approx 120$
or
 $L_{diff}\approx 120{\it\phi}D/U$
.
$L_{diff}\approx 120{\it\phi}D/U$
.

Figure 10. (a) Vertical concentration profiles at
 $t=5$
for different Rayleigh numbers. We only show one sample of each Rayleigh number here while the analysis is done using ensemble of five samples for each Rayleigh number. Here
$t=5$
for different Rayleigh numbers. We only show one sample of each Rayleigh number here while the analysis is done using ensemble of five samples for each Rayleigh number. Here
 $z^{\ast }=z/L$
, where
$z^{\ast }=z/L$
, where
 $L$
is the natural length scale. (b) Average thickness of boundary layer,
$L$
is the natural length scale. (b) Average thickness of boundary layer,
 $L_{diff}^{\ast }=L_{diff}/L$
, as a function of Rayleigh numbers.
$L_{diff}^{\ast }=L_{diff}/L$
, as a function of Rayleigh numbers.

Figure 11. Speciation curve
 $F({\it\alpha})$
obtained from PHREEQC. The dashed line (inset) is the calcium molality (
$F({\it\alpha})$
obtained from PHREEQC. The dashed line (inset) is the calcium molality (
 $[\text{Ca}^{2+}]$
) versus
$[\text{Ca}^{2+}]$
) versus
 ${\it\alpha}$
. The solid line (main plot) is the second derivative, computed numerically, of the dashed line.
${\it\alpha}$
. The solid line (main plot) is the second derivative, computed numerically, of the dashed line.
Appendix B. Geochemical speciation curve
We use PHREEQC (Parkhurst Reference Parkhurst1995) to obtain the speciation curve corresponding to the chemical system in (2.4)–(2.7). To do so, we first define the composition of solution 1 and solution 2, which are the two fluids that participate in the mixing. To obtain solution 1, the equilibrated
 $\text{CO}_{2}$
-rich brine, we subject pure water at
$\text{CO}_{2}$
-rich brine, we subject pure water at
 $\text{pH}=7$
and
$\text{pH}=7$
and
 $T=60\,^{\circ }\text{C}$
to equilibrium with gaseous
$T=60\,^{\circ }\text{C}$
to equilibrium with gaseous
 $\text{CO}_{2}$
at
$\text{CO}_{2}$
at
 $\text{pCO}_{2}=10^{2}$
atm and with calcite. To obtain solution 2, the equilibrated aquifer-brine, we subject also pure water at
$\text{pCO}_{2}=10^{2}$
atm and with calcite. To obtain solution 2, the equilibrated aquifer-brine, we subject also pure water at
 $\text{pH}=7$
and
$\text{pH}=7$
and
 $T=60\,^{\circ }\text{C}$
to equilibrium with gaseous
$T=60\,^{\circ }\text{C}$
to equilibrium with gaseous
 $\text{CO}_{2}$
at
$\text{CO}_{2}$
at
 $\text{pCO}_{2}=10^{-1}$
atm and with calcite. Then, for 1000, preselected and equally-spaced values of
$\text{pCO}_{2}=10^{-1}$
atm and with calcite. Then, for 1000, preselected and equally-spaced values of
 ${\it\alpha}$
, PHREEQC performs the speciation calculation by first mixing solutions 1 and 2 at volume fraction
${\it\alpha}$
, PHREEQC performs the speciation calculation by first mixing solutions 1 and 2 at volume fraction
 ${\it\alpha}$
and then re-equilibrating the mixed solution with respect to
${\it\alpha}$
and then re-equilibrating the mixed solution with respect to
 $\text{CaCO}_{3}$
. At the end of each calculation, we obtain the value of calcium molality (
$\text{CaCO}_{3}$
. At the end of each calculation, we obtain the value of calcium molality (
 $[\text{Ca}^{2+}]$
) in the final mixed-and-equilibrated solution corresponding to that given mixing ratio (figure 11, inset). Finally, we calculate the speciation curve by taking the second derivative of the molality curve numerically (figure 11, solid curve).
$[\text{Ca}^{2+}]$
) in the final mixed-and-equilibrated solution corresponding to that given mixing ratio (figure 11, inset). Finally, we calculate the speciation curve by taking the second derivative of the molality curve numerically (figure 11, solid curve).
The equilibrium constants of reactions in (2.4)–(2.7) are
 $K_{1}=10^{6.3447}$
,
$K_{1}=10^{6.3447}$
,
 $K_{2}=10^{16.6735}$
,
$K_{2}=10^{16.6735}$
,
 $K_{3}=10^{-8.1934}$
and
$K_{3}=10^{-8.1934}$
and
 $K_{4}=10^{13.9951}$
, respectively (Parkhurst Reference Parkhurst1995). These equilibrium constants are corrected by the species activities
$K_{4}=10^{13.9951}$
, respectively (Parkhurst Reference Parkhurst1995). These equilibrium constants are corrected by the species activities
 ${\it\gamma}_{i}$
, modeled using the extended Debye–Hückel equation (Helgerson & Kirkham Reference Helgerson and Kirkham1974):
${\it\gamma}_{i}$
, modeled using the extended Debye–Hückel equation (Helgerson & Kirkham Reference Helgerson and Kirkham1974):
 $$\begin{eqnarray}\log {\it\gamma}_{i}=\frac{Az_{i}^{2}\sqrt{I_{s}}}{1+{a\unicode[STIX]{x030A}}_{i}B\sqrt{I_{s}}}+{b\unicode[STIX]{x030A}}I_{s},\end{eqnarray}$$
where
 $I_{s}$
is the ionic strength of the mixture characterized by
$I_{s}$
is the ionic strength of the mixture characterized by
 ${\it\alpha},z_{i}$
and
${\it\alpha},z_{i}$
and
 ${a\unicode[STIX]{x030A}}_{i}$
are the valence and the ionic radius of species
${a\unicode[STIX]{x030A}}_{i}$
are the valence and the ionic radius of species
 $i$
, respectively, and
$i$
, respectively, and
 ${b\unicode[STIX]{x030A}}$
,
${b\unicode[STIX]{x030A}}$
,
 $A$
and
$A$
and
 $B$
are constants set by PHREEQC.
$B$
are constants set by PHREEQC.


