Introduction
Soil microorganisms are the most sensitive and rapid indicators of perturbations and land use changes. The composition of microbial communities, in particular the proportion of bacteria and fungi, may influence carbon (C) and nitrogen (N) turnover of paddy soils. The quantitative description of microbial community structure and diversity is therefore of great interest as a potential tool for soil quality evaluation (García-Orenes et al., Reference García-Orenes, Morugan-Coronado, Zornoza and Scow2013). The cell membranes of organisms, including soil organisms such as fungi and bacteria, are composed mainly of phospholipids. Cell membranes can be extracted and decomposed into their constituent fatty acids (phospholipid-derived fatty acids or PLFAs) for analysis. These are good indicators of living organisms and can be used to detect rapid changes in soil microbial communities because they are essential components of the membranes of all living microbes, and they degrade rapidly as cells die (White et al., Reference White, Davis, Nickels, King and Bobbie1979). Furthermore, different PLFAs can be used as biomarkers for major microbial groups, e.g. fungi and bacteria (Hao et al., Reference Hao, Liu, Wu, Hu, Tong and Su2008).
In recent years, research has reported that many environmental factors influence soil microbial communities, including soil texture (Chodak and Niklińska, Reference Chodak and Niklińska2010), nutrient availability (Bowles et al., Reference Bowles, Acosta-Martinez, Calderon and Jackson2014), land use (Kong et al., Reference Kong, Zhang, Wei, Xu and Hui2006), water content (Moche et al., Reference Moche, Gutknecht, Schulz, Langer and Rinklebe2015) and temperature (Wang et al., Reference Wang, Yang, Yang, Yang and Lv2014). It is generally recognized that soil microbial communities and diversity are related closely to different fertilization practices (Williams et al., Reference Williams, Börjesson and Hedlund2013; Zhang et al., Reference Zhang, Gao, Xu, Ma and Tian2016; Hu et al., Reference Hu, Liu, Wei, Zhu, Cui, Zhou, Chen, Jin, Liu and Wang2017). It has been reported that long-term application of chemical N fertilizer to a fluvo-aquic soil in Northern China increased fungal abundance but decreased bacterial abundance (Ai et al., Reference Ai, Liang, Sun, Wang and Zhou2012). Some studies have demonstrated that mineral fertilizers increased soil microbial biomass and diversity (Zhong et al., Reference Zhong, Gu, Wang, Zhang, Lin, Huang and Shen2010). However, some other studies found that fungal and bacteria communities were decreased by long-term application of N and P fertilization (Demoling et al., Reference Demoling, Nilsson and Bååth2008; Zhou et al., Reference Zhou, Jiang, Zhou, Zhao, Ma, Guan, Li, Chen, Cao, Shen and Qin2016). Williams et al. (Reference Williams, Börjesson and Hedlund2013) pointed out that soil microbial community composition was decreased under long-term mineral fertilization. Yevdokimov et al. (Reference Yevdokimov, Gattinger, Buegger, Schloter and Munch2012) reported that the ratio between PLFAs of Gram-positive bacteria (G+ bacteria) and Gram-negative bacteria (G− bacteria) decreased under the application of N fertilizer at a rate of 2000 mg N/kg soil. Organic fertilizers, including plant residues, animal manure and composted organic matter, are usually found to increase soil microbial activity and diversity (Islam et al., Reference Islam, Chauhan, Kim, Kim and Sa2011), but the extent of the increase depends on the type and quantity of amendments. Zhang et al. (Reference Zhang, Gao, Xu, Ma and Tian2016) found that soil microbial communities were influenced directly by residue return and further reported that the ratio of fungi to bacteria decreased when the amount of residue application increased. It has been reported that organic manure application could significantly alter soil microbial community structure and enhance microbial diversity (Dong et al., Reference Dong, Zhang, Dai, Fu, Yang, Liu, Sun, Wen and Schaeffer2014; Li et al., Reference Li, Cooper, Lin, Li, Yang and Zhao2015; Sun et al., Reference Sun, Dsouza, Gilbert, Guo, Wang, Guo, Ni and Chu2016; Hu et al., Reference Hu, Liu, Wei, Zhu, Cui, Zhou, Chen, Jin, Liu and Wang2017). Tian et al. (Reference Tian, Lou, Gao, Fang, Liu, Xu, Blagodatskaya and Kuzyakov2017) also found that abundance of soil PLFAs, bacteria, G+ bacteria and actinomycetes was higher with manure than the combined application of manure with mineral fertilizer. Ai et al. (Reference Ai, Liang, Sun, Wang and Zhou2012) reported that ratios of total PLFAs and G+ bacteria to G− bacteria in fluvo-aquic soil were increased by application of organic fertilizer.
Many studies have demonstrated that soil microbial community structure was changed under different agricultural management practices, such as crop rotation (Kong et al., Reference Kong, Zhang, Wei, Xu and Hui2006), land management (Yu et al., Reference Yu, Bi, Xu, Zhou, Ma and Jiang2013), soil type (Demoling et al., Reference Demoling, Nilsson and Bååth2008), soil tillage (Bossio et al., Reference Bossio, Scow, Gunapala and Graham1998) and residue return (Zhang et al., Reference Zhang, Gao, Xu, Ma and Tian2016), and there have been several studies on the effects of different fertilizer regimes on soil microbial community structure in paddy fields (Islam et al., Reference Islam, Chauhan, Kim, Kim and Sa2011; Dong et al., Reference Dong, Zhang, Dai, Fu, Yang, Liu, Sun, Wen and Schaeffer2014). However, information about the effects of long-term fertilization practices on soil microbial community structure is limited in double-cropped paddy fields in Southern China. Therefore, the aim of the current study was to investigate how the soil microbial community structure varies with different fertilization treatments after 31 years of continuous cropping in double-cropped paddy fields in Southern China. The microbial community structure was analysed using the PLFA profiling method.
Materials and methods
Site description
The long-term experiment, established in 1986, is located in Ning Xiang County (28°07′N, 112°18′E, 36 m asl) of Hunan Province, China, under a continental monsoon climate. Annual mean precipitation is 1553 mm and potential evapotranspiration is 1354 mm. The monthly mean temperature is 17.2 °C. Soil texture in the plough layer (0–20 cm) is silt clay loam with 13.7% sand and 57.7% silt. At the beginning of the study, the surface soil characteristics (0–20 cm) were as follows: soil organic carbon (SOC) 29.4 g/kg, total N 2.0 g/kg, available N 144.1 mg/kg, total phosphorous (P) 0.59 g/kg, available P 12.87 mg/kg, total potassium (K) 20.6 g/kg and available K 33.0 mg/kg. There were three crops in each year: barley (Hordeum vulgare L.), early rice and late rice (Oryza sativa L.). Barley was sown in the middle of November and harvested in early May of the following year. Early rice was then transplanted and harvested in the middle of July. The growing season of late-transplanted rice lasted from late July to the end of October.
Experimental design
The current experiment was conducted in 2015–2016, using the long-term experiment described above. The experiment had five treatments: control (without fertilizer input, CK), chemical fertilizer alone (MF), rice straw residue and chemical fertilizer (RF), low manure rate and chemical fertilizer (LOM), and high manure rate and chemical fertilizer (HOM). The design ensured all fertilized treatments received the same amount of N, phosphorus pentoxide (P2O5), potassium oxide (K2O) (the amount of N in chemical fertilizer plus that from rice straw residue or manure) during the early and late rice growing season, respectively. The chemical fertilizers included urea, ordinary superphosphate and potassium chloride. Details of the fertilization managements are listed in Table 1. Before barley sowing and transplanting rice seedlings, organic manure and air-dried rice straw residue was spread manually onto the soil surface and incorporated into the soil at a cultivation depth of 20 cm. Then 0.60 of the chemical N fertilizer was applied at soil tillage before sowing of barley and the remaining N fertilizer was applied by top dressing during tillering (50–55 days after sowing, growth stage [GS] 21–29 according to Zadoks et al., Reference Zadoks, Chang and Konzak1974). For rice, 0.70 and 0.60 of the chemical N fertilizer was applied at soil tillage before transplanting of early and late rice, respectively, and the remaining N fertilizer was applied by top dressing during rice growth (7–10 days after transplanting). All P and K fertilizers were applied at soil tillage before sowing of barley or transplantation of rice. There were three replications and each plot size was 66.7 m2 (10 × 6.67 m). The barley variety Ningmai 8 was used in 2015–2016, sown at 250.0 kg/hm2. The early rice variety Xiangzaoxian 45 and late rice variety Yueyou 9113 were used in 2016. One-month-old rice seedlings were transplanted with a density of 1 50 000 plants/ha and 2–3 plants per hill.
Table 1. Nutrient supply from rice straw, chicken manure and chemical fertilizer under different fertilization treatments

N, nitrogen; P2O5, phosphorus pentoxide; K2O, potassium oxide.
a MF: chemical fertilizer alone; RF: rice straw residues and chemical fertilizer; LOM: 0.30 organic matter and 0.70 chemical fertilizer; HOM: 0.60 organic matter and 0.40 chemical fertilizer; CK: without fertilizer input.
b Input from chemical fertilizer + input from rice straw residue or organic manure. The numbers are in kg/hm2. The N, P and K content of air-dry early rice straw was 6.5, 1.3 and 8.9 g/kg, N, P and K content of air-dry late rice straw was 6.8, 1.5 and 9.1 g/kg, respectively, and N, P and K content of decomposed chicken manure was 17.7, 8.0 and 11.2 g/kg, respectively.
c For the RF treatment, rice straw return rate (air dry) was 2780, 3600 kg/hm2 for early and late rice.
d For the LOM treatment, chicken manure application rate (decomposed) was 2625.0, 2670.0 kg/hm2 for early and late rice.
e For the HOM treatment, chicken manure application rate (decomposed) was 5250.0, 5340.0 kg/hm2 for early and late rice.
Soil sampling
Soil samples were collected from the plough layer (0–20 cm) at the late rice harvest in 2016. Three soil samples were taken randomly from each plot. The samples from each plot were mixed and transported in a plastic bag to the laboratory on the same day. After removal of the plant straw residue and visible organisms by hand, the soil samples were air-dried at room temperature till the soil moisture (w/w basis) was in the range of 25–30%. Each sample was sieved through a 2 mm sieve, and then divided into two sub-samples. Half of these sub-samples were maintained at −80 °C until phospholipid extraction, and the other half analysed for other soil properties.
Phospholipid fatty acid analysis
Lipid extraction and PLFA analysis were performed using the method described by Bossio et al. (Reference Bossio, Scow, Gunapala and Graham1998). Briefly, 2.0 g (dry equivalent weight) was extracted with a chlorofom-methanolcitrate buffer mixture (1:2:0.8) and the phospholipids were separated from other lipids on a silicic acid column. Phospholipids were isolated from the crude lipid extracts by solid phase extraction in silica gel columns, using 19:0 nonadecanoic acid as internal standard. Neutral lipid, glycolipid and phospholipid fractions were eluted by sequential leaching with dichloromethane, acetone and methanol, respectively. The neutral lipid and glycolipid fractions were discarded and the phospholipid fraction retained for methylation (conversion to fatty acid methyl esters or FAMEs) through mild acid methanolysis, i.e. addition of MeOH/H2SO4 (25:1 v/v) and hexane. The FAMEs were analysed by gas chromatography on a GC fitted with a 30 m 5% phenyl and 95% methylpolysiloxane column. The GC running conditions were 80 °C for 1 min, increasing at 20 °C/min to 160 °C, and then increasing at 5 °C/min to the final temperature of 270 °C, which was held for 5 min (Yao et al., Reference Yao, He, Wilson and Campbell2000). Peaks were identified by comparison of retention times to known standards. The abundance of individual PLFAs was expressed as ng/g dry soil as follows (Yao et al., Reference Yao, He, Wilson and Campbell2000):
where C x = concentration of the PLFAs studied; A x = peak area of the PLFAs studied; A i = peak area of the internal standard (19:0 nonadecanoic acid); c i = absolute amount of internal standard in the vial (ng); f = response factors of different PLFAs (peak area to concentration ratio compared with internal standard; if not known, then 1); W = weight of soil (g); and M = molecular weight of the fatty acid (ng/μmol).
Phospholipid fatty acid community structure analysis
The PLFA patterns of microbial communities in the soil of different fertilization treatments were compared with respect to the species and total amount of PLFAs, the contents of specific PLFAs, e.g. 16:0, 18:1ω9c and 10Me17:0 indicative of bacteria (Hill et al., Reference Hill, Mitkowski, Aldrich-Wolfe, Emele, Jurkonie, Ficke, Maldonado-Ramirez, Lynch and Nelson2000), and fungi (Kourtev et al., Reference Kourtev, Ehrenfeld and Häggblom2002), as well as 10Me16:0 and 16:1ω5c indicative of sulphate-reducing bacteria and actinomycetes (Hill et al., Reference Hill, Mitkowski, Aldrich-Wolfe, Emele, Jurkonie, Ficke, Maldonado-Ramirez, Lynch and Nelson2000; Kourtev et al., Reference Kourtev, Ehrenfeld and Häggblom2002), respectively. The content (μg/g dry weight soil) of PLFAs and richness indices, Shannon indices and McIntosh indices were used for evaluating the diversity of PLFA composition. The indices were calculated according to Schutter and Dick (Reference Schutter and Dick2000).
Other measurements
Standard techniques were used to measure the soil total C, total N, total P, total K, available N, available P and available K (Olsen and Sommers, Reference Olsen, Sommers, Page, Miller and Keeney1982). Grain yield was determined from a 1 m2 sampling area at late rice harvest and was expressed as rough (unhulled) rice at 14% moisture content.
Statistical analysis
Phospholipid fatty acid data were analysed using principal components analysis (PCA) to elucidate major variation and covariation for individual PLFAs employing varimax rotation. This was performed on log10 transformed mole percentages of individual PLFAs. The PCA scores were subsequently analysed by analysis of variance with correlation matrix using SPSS Version 3.11. Cluster analysis was performed by SPSS software.
Results
Composition and concentrations of phospholipid fatty acids
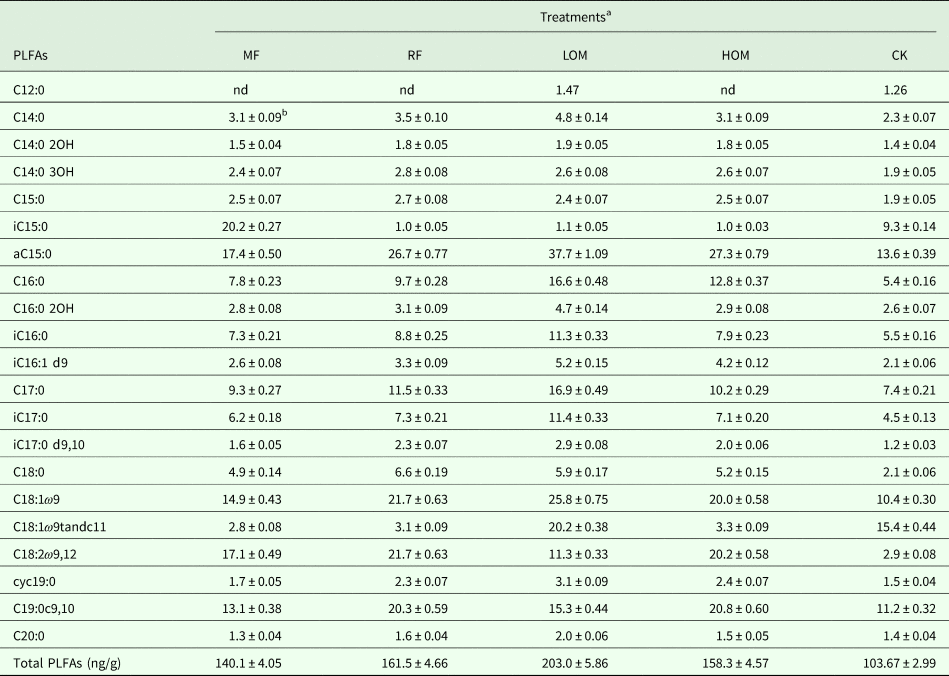
The soil under each treatment contained various PLFAs composed of saturated, unsaturated, methyl-branched and cyclopropane fatty acids (Table 2). Twenty-one PLFAs with chain lengths ranging from C12 to C20 were identified in different fertilization treatments. Compared with the control (CK, no fertilizer input) treatment, the application of chemical fertilizer alone (MF), rice straw residue and chemical fertilizer (RF), low manure rate and chemical fertilizer (LOM), and high manure rate and chemical fertilizer (HOM) treatments increased the content of total PLFAs significantly (P < 0.05). The microbial community containing C12:0 could not be detected, and the C14:0 3OH, aC15:0, iC15:0, C18:0, C18:1ω9, C18:2ω9, 12 in the community were increased significantly (P < 0.05), but the C18:1ω9tandc11 in the community was reduced significantly (P < 0.05) with MF treatment. The iC15:0 and C18:1ω9tandc11 in the community were reduced significantly (P < 0.05) with the RF treatment. The iC15:0 in the community were reduced significantly (P < 0.05) by combined application of organic manure with chemical fertilizer (LOM and HOM). Meanwhile, the C18:1ω9tandc11 in the community were reduced significantly (P < 0.05) with HOM treatment.
Table 2. Concentrations of PLFAs (ng/g) in different fertilization treatments
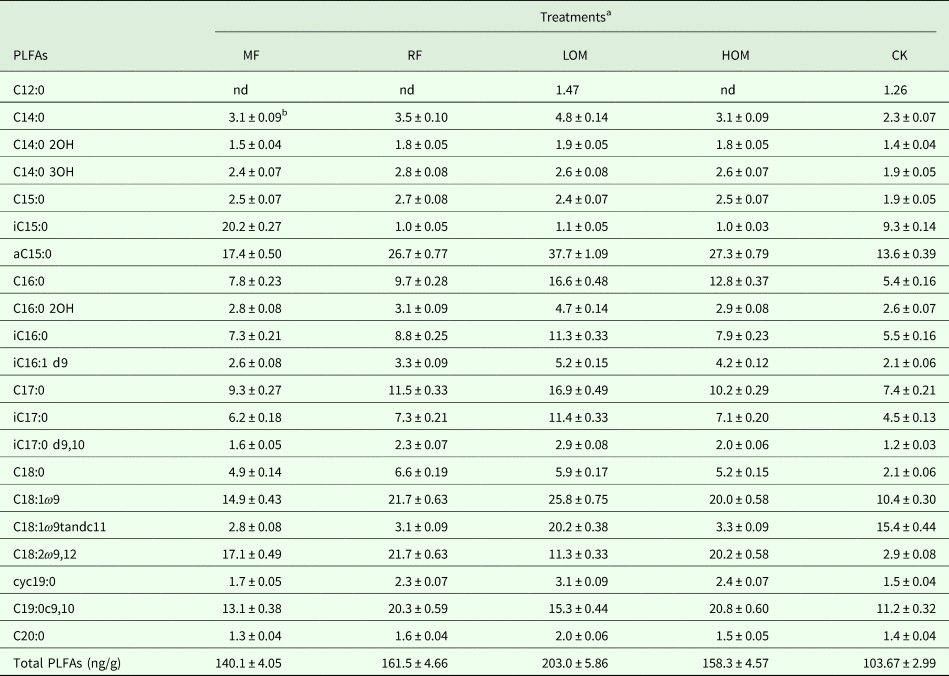
nd, Not detected.
a MF: chemical fertilizer alone; RF: rice straw residues and chemical fertilizer; LOM: 0.30 organic matter and 0.70 chemical fertilizer; HOM: 0.60 organic matter and 0.40 chemical fertilizer; CK: without fertilizer input. The same as below.
b Values are presented as mean ± s.e. (n = 3).
Soil microbial community structure
The microbial community structure expressed as the relative abundance of G+ bacteria, G− bacteria and fungi by PLFAs proportion is presented in Table 3. The LOM treatment had the highest content of G+ bacteria, G− bacteria PLFAs with 70.46 and 41.18 µg/g, respectively. The MF treatment had the highest value of G+ bacteria/G− bacteria PLFAs with 2.02, and the value of G+ bacteria/G− bacteria PLFAs with MF treatment was significantly (P < 0.05) higher than that of with RF, LOM, HOM and CK treatments. The RF treatment had the highest content of fungi PLFAs (22.68 µg/g), and the value of fungi PLFA content in the RF treatment was significantly (P < 0.05) higher than that in the MF, LOM, HOM and CK treatments. The RF and HOM treatments had the highest value of fungi/G+ bacteria + G− bacteria (0.28 and 0.27, respectively), and the value of fungi/G+ bacteria + G− bacteria with RF and HOM treatments was significantly (P < 0.05) higher than that of the MF, LOM and CK treatments.
Table 3. PLFAs (μg/g) in Gram-positive bacteria (G+ bacteria), Gram-negative bacteria (G− bacteria), fungi and the ratio among them in different fertilization treatments

a MF: chemical fertilizer alone; RF: rice straw residues and chemical fertilizer; LOM: 0.30 organic matter and 0.70 chemical fertilizer; HOM: 0.60 organic matter and 0.40 chemical fertilizer; CK: without fertilizer input. The same as below.
b Values are presented as mean ± S.E. (n = 3).
Diversity of soil microbial communities
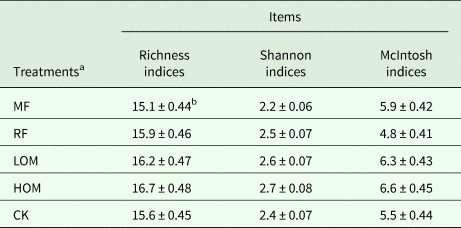
The HOM treatment had the highest value of richness indices and the value decreased in the order HOM>LOM>RF>CK>MF. The value of Shannon indices for HOM and LOM treatments was significantly (P < 0.05) higher than that in the MF and CK treatments, and the value decreased in the order HOM≈LOM>RF>CK>MF. Meanwhile, the value of McIntosh indices in the HOM treatment was significantly (P < 0.05) higher than that of the RF and CK treatments, with the value decreasing in the order HOM>LOM>MF>CK>RF (Table 4).
Table 4. Diversity of microbial communities in soil at late rice harvest under different the fertilization treatments

a MF: chemical fertilizer alone; RF: rice straw residues and chemical fertilizer; LOM: 0.30 organic matter and 0.70 chemical fertilizer; HOM: 0.60 organic matter and 0.40 chemical fertilizer; CK: without fertilizer input. The same as below.
b Values are presented as mean ± s.e. (n = 3).
Soil microbial phospholipid fatty acid and principal component analysis
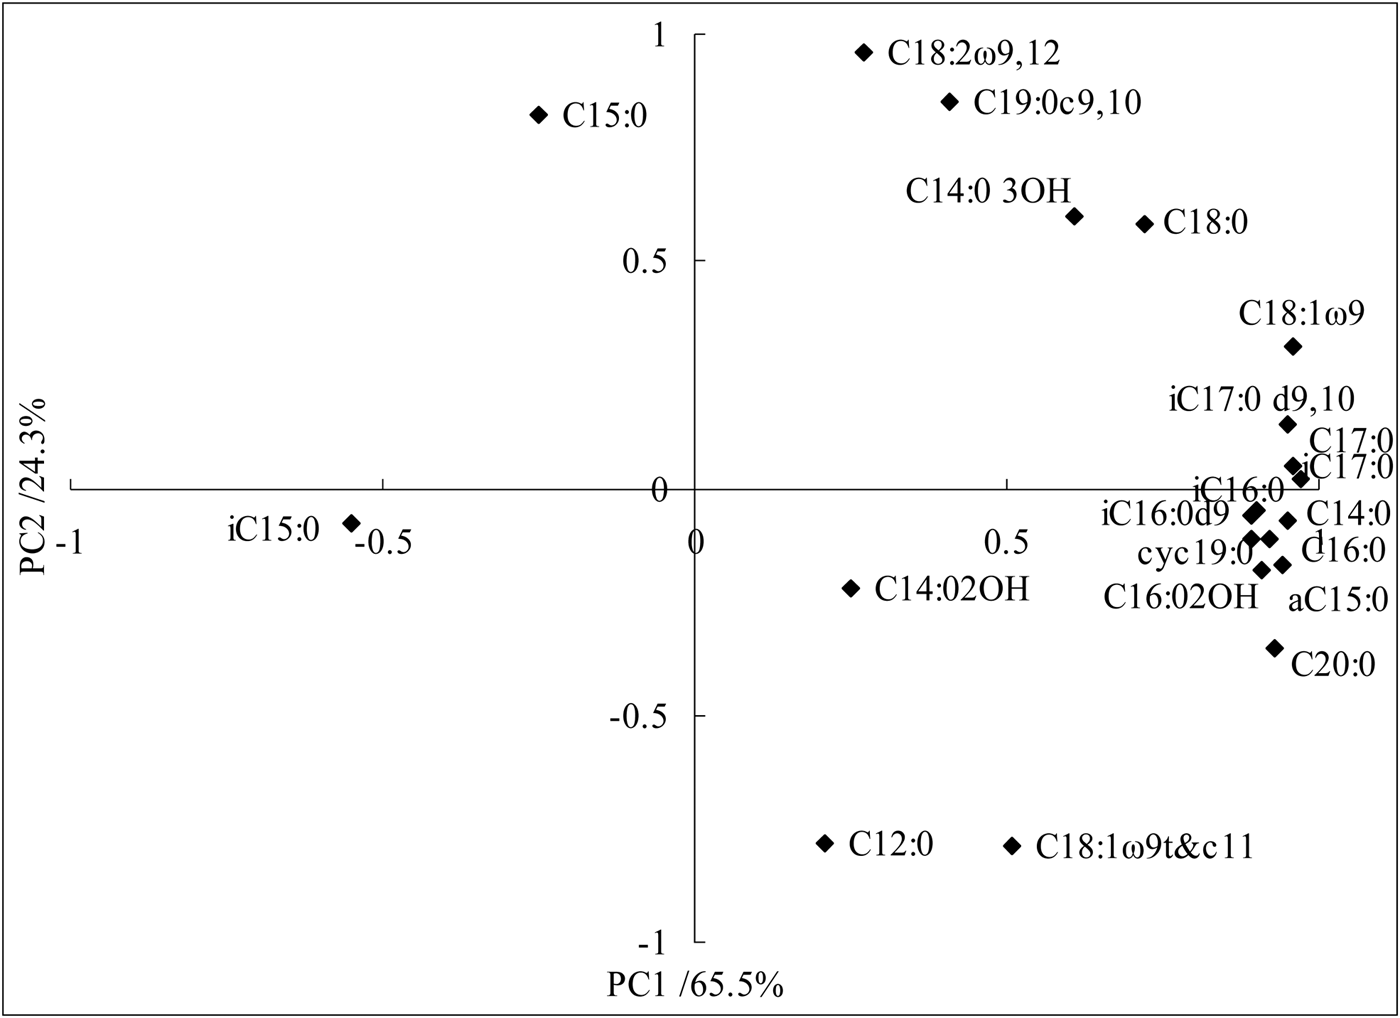
Principal components analysis also identified fatty acids that were important in explaining the variability in PLFA profiles (Fig. 1). The ordination plot in Fig. 1 illustrates the difference in PLFA composition of the five fertilization treatments, where PC1 and PC2 account for 65.5 and 24.3% of the variation, respectively. In addition to C14:0 3OH and C18:0 included in PC1 and PC2, most of the unsaturated fatty acids and cyclic fatty acids were reflected in PC1 and the fungus and fatty acids were reflected in PC2.
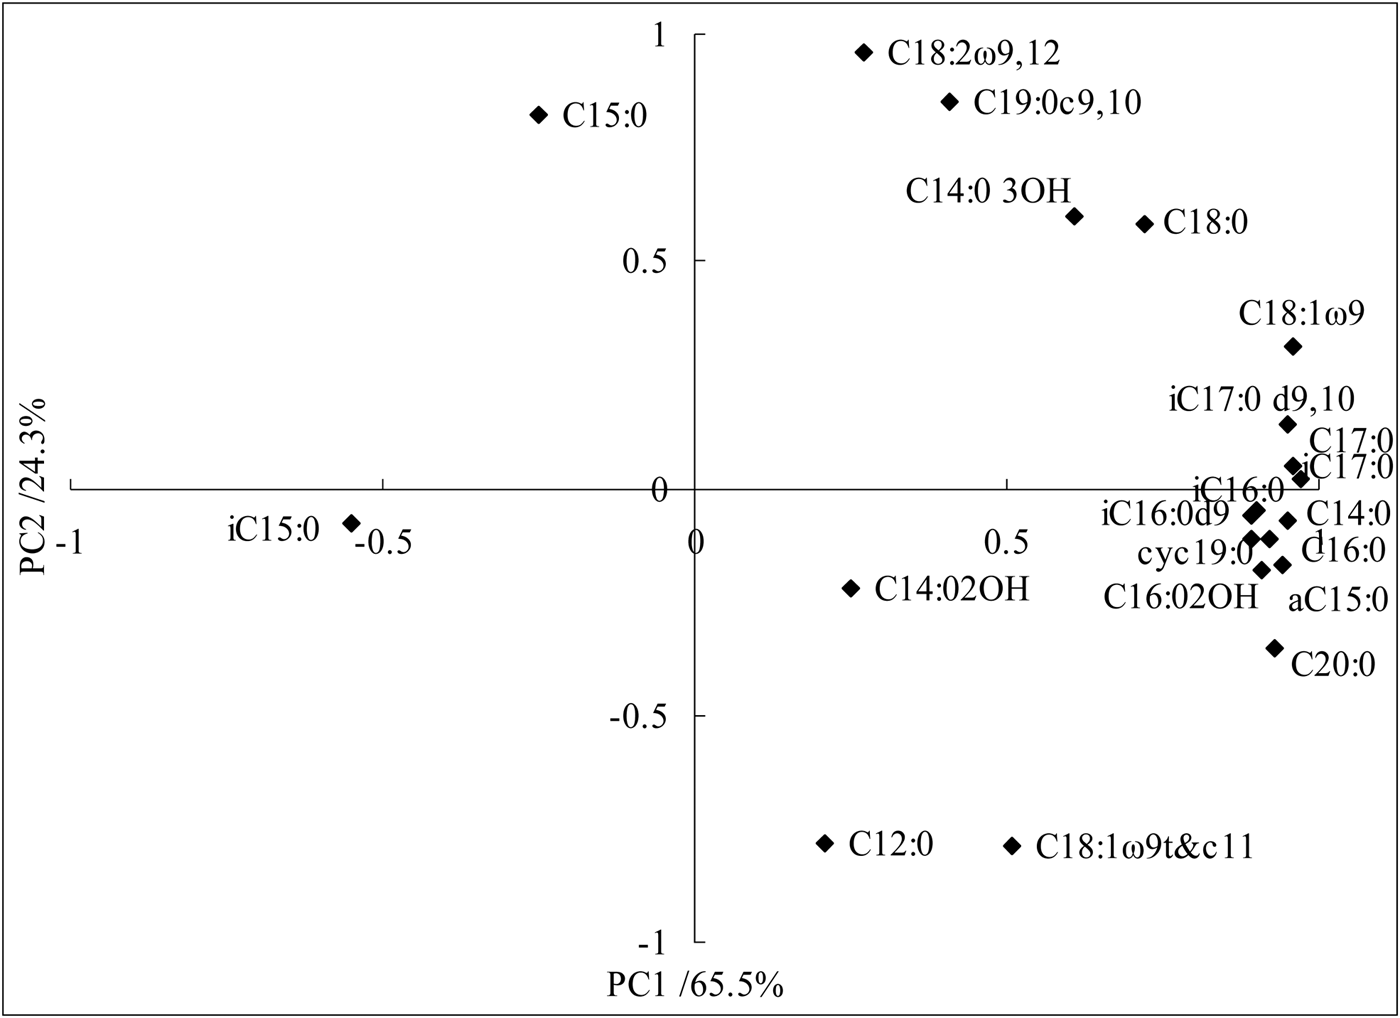
Fig. 1. Principal component analysis showing loading values for individual phospholipid fatty acids.
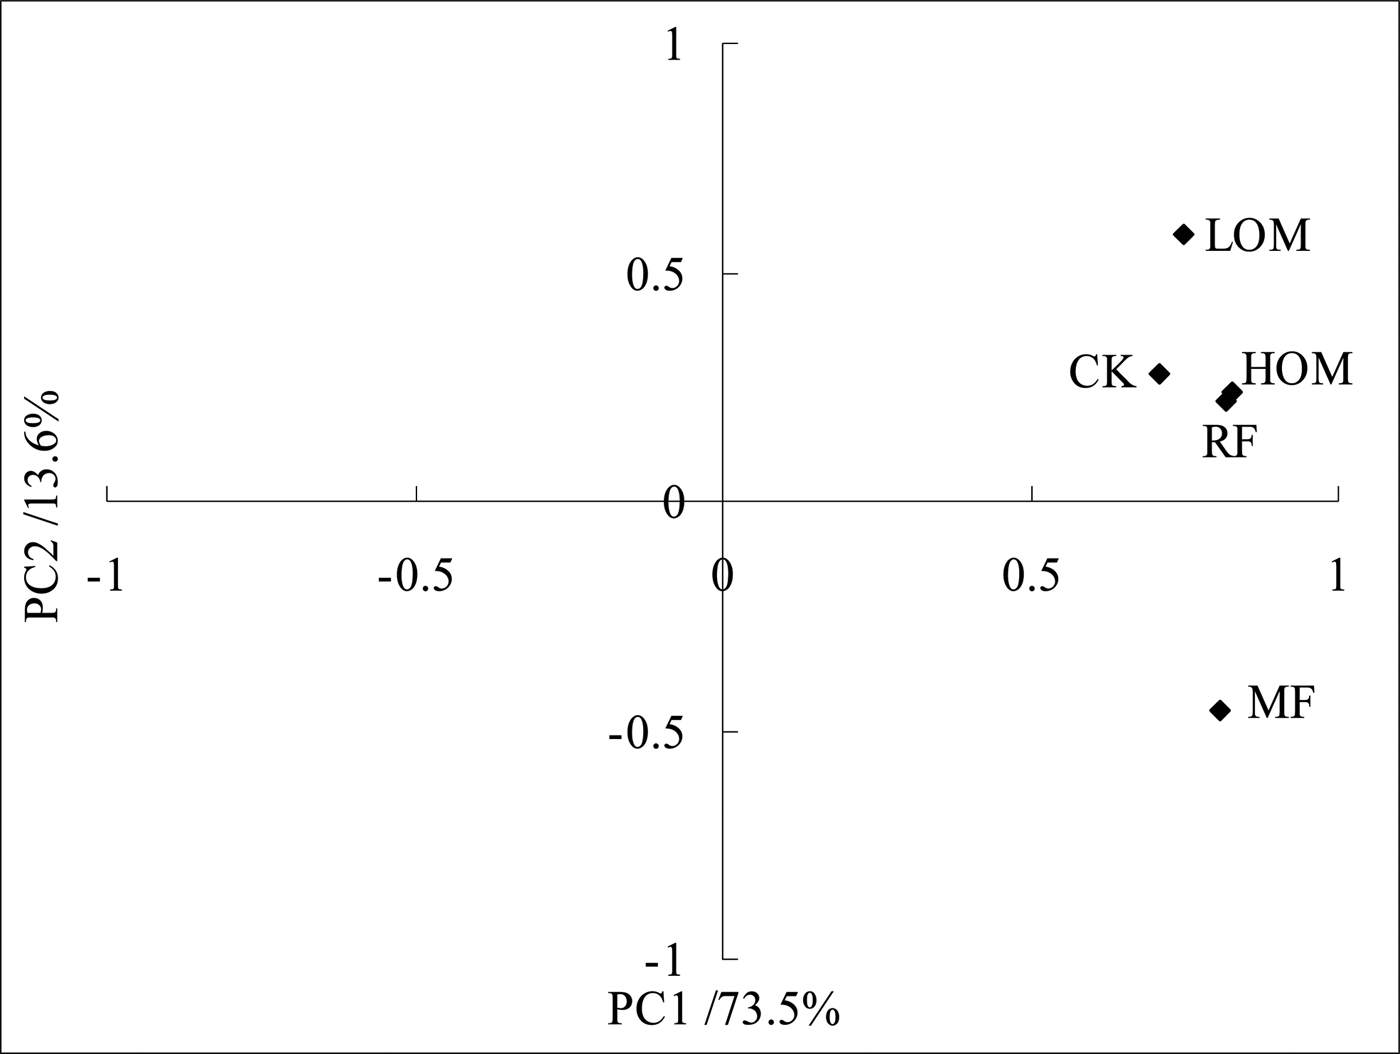
The ordination plot in Fig. 2 illustrates the difference in PLFA composition of the five fertilization treatments, where PC1 and PC2 account for 73.5 and 13.6% of the variation, respectively. The five fertilization treatments are found on the right-hand side of the plot, and the RF, LOM, HOM and CK treatments are found in the first quadrant, whereas the MF treatment are found in the second quadrant. The ordination plot shows that the RF and HOM treatments data formed a cluster, with positive scores for PC1 and PC2, whereas data points for MF treatment clusters were away from the RF, LOM, HOM and CK treatments and had negative scores for PC2. In addition, there are differences in PLFA composition between the LOM treatment and MF, RF, HOM and CK treatments. It is suggested that microbial community composition might be dissimilar under different fertilization treatments except under the MF treatment.

Fig. 2. Principal component analysis showing variations in phospholipid fatty acid patterns with different fertilization treatments. MF: chemical fertilizer alone; RF: rice straw residues and chemical fertilizer; LOM: 0.30 organic matter and 0.70 chemical fertilizer; HOM: 0.60 organic matter and 0.40 chemical fertilizer; CK: without fertilizer input.
Correlation between microbial characteristics and microbial diversity
The richness and Shannon indices had significant (P < 0.05) positive correlation with the content of PLFAs, G+ bacteria, G− bacteria and fungi. The value of fungi/G+ bacteria + G− bacteria had a significant (P < 0.05) positive correlation with the content of PLFAs, G+ bacteria, G− bacteria, available N and available K, while the value of fungi/G+ bacteria + G− bacteria had significant (P < 0.01) positive correlation with fungi, total C, total N and grain yield. On the other hand, the value of G+ bacteria/G− bacteria had significant (P < 0.01) negative correlation with the content of PLFAs, G+ bacteria, G− bacteria and fungi. McIntosh indices had significant (P < 0.05) positive correlation with the content of G+ bacteria, G− bacteria and fungi (Table 5). The richness, Shannon and McIntosh indices were not significantly related to soil nutrient variables and grain yield of rice, whereas the fungi/G+ bacteria + G− bacteria had significantly (P < 0.01) positive correlation with soil total C, total N and grain yield of rice (Table 5).
Table 5. Correlation of soil microbial characteristics, microbial diversity indices to soil nutrients and grain yield of rice

a Significant at P 0.01, 0.05, respectively.
Discussion
Soil microbial community structure and fertilization practices
Many studies have demonstrated that agricultural management practices influence soil physical and chemical characteristics, causing changes in the soil microbial community (Kong et al., Reference Kong, Zhang, Wei, Xu and Hui2006; Williams et al., Reference Williams, Börjesson and Hedlund2013). Microbial communities include viruses, eubacteria, archaebacteria, fungi, protozoa, micrometazoa and algae (Vestal and White, Reference Vestal and White1989). Despite their small volume, soil microorganisms are key players in the global cycling of organic matter, recycling organic residues or mineralizing them to CO2, H2O, N, P, sulphur (S) and other nutrients (Wieland et al., Reference Wieland, Neumann and Backhaus2001). The PLFA profile method is acknowledged as a good technique with sufficient resolution to study the changes in microbial community structure in response to environmental perturbations (Yao et al., Reference Yao, He, Wilson and Campbell2000). In the current study, the soil microbial community under different fertilization practices was investigated using the PLFA method. The results showed that total content of PLFAs was increased significantly by application of straw residue and organic manure (RF, LOM and HOM). Total PLFA biomass in RF, LOM and HOM treatments increased significantly in comparison with the control soil. The reasons for the current results may be that application of straw residue and manure provided a substrate for soil microbial growth (Ai et al., Reference Ai, Liang, Sun, Wang and Zhou2012; Zhang et al., Reference Zhang, Gao, Xu, Ma and Tian2016). The change in soil pH may also have contributed to the differences observed because soil pH is known as an important factor affecting soil microbial biomass (Aciego Pietri and Brookes, Reference Aciego Pietri and Brookes2009). Similar results were reported by Clegg (Reference Clegg2006), who found that long-term manure treatment increased microbial PLFAs. In addition, applications of chemical fertilizer promoted growth of microbial communities that were limited by mineral nutrients, which also caused a shift in the factors that were limiting microbial growth, and resulted in total PLFA biomass under MF treatment lower than that with RF, LOM and HOM treatments.
Data from the current study revealed that branched fatty acids were used as indicators of G+ bacteria biomass, and the contents of fatty acids 18:1ω7, 16:lω7, cy17:0 and cy19:0 were used as indicators of G− bacteria (Frostegård and Bååth, Reference Frostegård and Bååth1996). In the current study, the PCA indicated that RF and LOM treatments increased the percentage of cyclopropane fatty acids (cy17:0, cy19:0), whereas they decreased the percentage of unsaturated fatty acids; the reason may be that G− bacteria microbial biomarkers were more reactive to the straw residue and organic manure (Tian et al., Reference Tian, Lou, Gao, Fang, Liu, Xu, Blagodatskaya and Kuzyakov2017). Furthermore, the lower percentage of unsaturated fatty acids with RF and LOM treatments may be related to the low organic manure application rates and the high mineral fertilizer application rates (Dong et al., Reference Dong, Zhang, Dai, Fu, Yang, Liu, Sun, Wen and Schaeffer2014). For bacteria, the ratio of cy19:0 to 18:1ω7 has been proposed as an indicator of stress conditions, as it increases under situations such as no growth, acidic conditions, low oxygen and high temperature (Guckert et al., Reference Guckert, Hood and White1986). In the current study, a significant decrease in this ratio occurred under the MF treatment compared with RF, LOM and HOM treatments, perhaps because bacteria growth was inhibited by mineral fertilizer and facilitated by straw residue and organic manure, suggesting the bacteria in paddy soils may be related to combined application of straw residue and organic manure with mineral fertilizer. However, the cause leading to this decrease requires further research.
In the current study, some soil microbial community characteristics were responsive to fertilization practices. The fungi/G+ bacteria + G− bacteria had a significant, positive correlation with soil total C, total N and grain yield of rice. It might be presumed that microbial community structure was affected by fertilization practices (Yu et al., Reference Yu, Bi, Xu, Zhou, Ma and Jiang2013; Tang et al., Reference Tang, Xiao, Wang, Li, Liu and Sun2016). The nature of nutrient inputs affects the availability of soil nutrients and substrates as well as the growth of rice plants, affecting the characteristics of microbial habitats in soil (Ai et al., Reference Ai, Liang, Sun, Wang and Zhou2012; Williams et al., Reference Williams, Börjesson and Hedlund2013; Li et al., Reference Li, Cooper, Lin, Li, Yang and Zhao2015). Zhang et al. (Reference Zhang, Ding, He, Yu, Fan and Liu2014) also reported that fungi were positively correlated with soil organic C, possibly because fungi were distributed mainly in macroaggregates. Interestingly, the soil microbial diversity indices calculated based on PLFA community fingerprinting technique in the current study did not correlate significantly with the measured soil nutrient variables and grain yield of rice. This may be partly because of the limitations with respect to generating diversity information by the PLFA technique, such as difficulty in linking signature molecules with specific groups of microorganisms, and in not being able to reveal information at a species level (Hill et al., Reference Hill, Mitkowski, Aldrich-Wolfe, Emele, Jurkonie, Ficke, Maldonado-Ramirez, Lynch and Nelson2000).
Microbial characteristics and fertilization practices
In nature, microbial communities play an important role in the biosphere, primarily in recycling biologically important elements (Wieland et al., Reference Wieland, Neumann and Backhaus2001). High proportions of G+ bacteria, relatively to G− bacteria, are usually associated with soils low in SOC such as arable soils (Herman et al., Reference Herman, Firestone, Nuccio and Hodge2012). Therefore, G+ bacteria, G− bacteria and fungi were detected in paddy soils in the current experiment using PLFAs as specific biomarkers. In the current study, the results indicated that G+ bacteria, G− bacteria PLFAs with LOM treatment were higher than that of other treatments. This may be because low organic manure application rates and high mineral fertilizer application rates provide a large amount of readily available substrates for sustained microbial biomass for a long period and organic manure has a significant effect on the content of G+ and G− bacteria (Rinnan et al., Reference Rinnan, Michelsen and Jonasson2008). The MF treatment had the highest value of G+ bacteria/G− bacteria PLFAs: possible reasons for this include: (1) the fungal PLFA C18:2ω9,12 was detected, but many kinds of fungi from the soil were not really measured (Calderón et al., Reference Calderón, Jackson, Scow and Rolston2001); (2) it is probably related to soil pH (Zhang et al., Reference Zhang, Gao, Xu, Ma and Tian2016). However, the value of G+ bacteria/G− bacteria PLFAs was decreased by application of organic fertilization, possibly because G− bacteria, which are sensitive to copiotrophic conditions (Kieft et al., Reference Kieft, Ringelberg and White1994), are often stimulated by added straw residue and organic matter, resulting in a low ratio of G+ bacteria/G− bacteria (Larkin et al., Reference Larkin, Honeycutt and Griffin2006).
The value of soil fungi/bacteria was used as a measure of their responses to environmental change and changes in soil microbial communities (Strickland and Rousk, Reference Strickland and Rousk2010). Some studies have found that a higher value of soil fungi/bacteria was indicative of a sustainable agro-ecosystem with lower environmental impact (De Vries et al., Reference De Vries, Hoffland, van Eekeren, Brussaard and Bloem2006; Sun et al., Reference Sun, Dsouza, Gilbert, Guo, Wang, Guo, Ni and Chu2016). In the current study, it was indicated that the content of fungi PLFAs and value of fungi/G+ bacteria + G− bacteria were higher in the RF treatment than the other treatments, indicating that combined application of straw residue with chemical fertilizer also provides a large amount of readily available substrate for sustained microbial biomass over a long period, and that straw residue with high C/N ratio stimulates fungal growth and thus increases the value of fungi/G+ bacteria + G− bacteria (Dong et al., Reference Dong, Zhang, Dai, Fu, Yang, Liu, Sun, Wen and Schaeffer2014). It has been suggested that application of straw residue is a better way to improve the sustainable ecosystem of paddy fields with improved tolerance to environmental impact.
In addition, there were significant correlations between soil microbial characteristics and microbial diversity. These results suggest that soil microbial community is strongly driven by the different type of fertilizers (Yu et al., Reference Yu, Bi, Xu, Zhou, Ma and Jiang2013). Meanwhile, the richness, Shannon and McIntosh indices were the highest with organic manure practices (LOM and HOM). Reasons for this may include: (1) the addition of nutrients in the field allows better growth of soil microbes (Williams et al., Reference Williams, Börjesson and Hedlund2013; Li et al., Reference Li, Cooper, Lin, Li, Yang and Zhao2015); (2) higher extracellular enzyme activities in the rhizosphere contribute to maintenance of high microbial diversity in the soils (Ai et al., Reference Ai, Liang, Sun, Wang and Zhou2012), in agreement with the results of Yu et al. (Reference Yu, Bi, Xu, Zhou, Ma and Jiang2013).
Conclusions
Long-term fertilization practices have a great impact on the soil microbial community. The current results showed that the content of total PLFAs, fungal PLFAs and value of fungi/G+ bacteria + G− bacteria were increased by long-term combined application of straw residue and organic manure with chemical fertilizer. The proportion of G+ bacteria was higher than that of G− bacteria in different fertilization practices soils. Principal component analyses showed that the content of most PLFA biomarkers increased in response to the RF, LOM and HOM treatments, which indicates that the diversity of microbial communities in paddy soils was increased by combined application of straw residue and organic manure with chemical fertilizer. As a result, it is beneficial to improve the soil microbial community structure in double-cropped paddy fields in Southern China by long-term combined application of straw residue or organic manure with chemical fertilizer practices.
Financial support
This study was supported by the Hunan Provincial Natural Science Foundation of China (2017JJ1018), the National Natural Science Foundation of China (31872851) and the Public Research Funds Projects of Agriculture, Ministry of Agriculture of the P.R. China (201503123).
Conflict of interest
None.
Ethical standards
Not applicable.


