I. INTRODUCTION
Bretylium tosylate (brand name Bretylol) is used to treat and suppress ventricular arrhythmias, particularly ventricular fibrillation and ventricular tachycardia. The IUPAC name (CAS Registry number 61-75-6) is (2-bromophenyl)methyl-ethyl-dimethylazanium;4-methylbenzenesulfonate. A two-dimensional molecular diagram is shown in Figure 1. Limited X-ray powder diffraction data for bretylium tosylate has been reported by Carter et al. (Reference Carter, Amann and Baaske1980).

Figure 1. The molecular structure of bretylium tosylate.
This work was carried out as part of a project (Kaduk et al., Reference Kaduk, Crowder, Zhong, Fawcett and Suchomel2014) to determine the crystal structures of large-volume commercial pharmaceuticals, and include high-quality powder diffraction data for these pharmaceuticals in the Powder Diffraction File (Fawcett et al., Reference Fawcett, Kabekkodu, Blanton and Blanton2017).
II. EXPERIMENTAL
Bretylium tosylate was a commercial reagent, purchased from the US Pharmacopeia (USP), Lot # G0I231, and was used as-received. The white powder was packed into a 1.5 mm diameter Kapton capillary, and rotated during the measurement at ~50 cycles s−1. The powder pattern was measured at 295 K at beam line 11-BM (Lee et al., Reference Lee, Shu, Ramanathan, Preissner, Wang, Beno, Von Dreele, Ribaud, Kurtz, Antao, Jiao and Toby2008; Wang et al., Reference Wang, Toby, Lee, Ribaud, Antao, Kurtz, Ramanathan, Von Dreele and Beno2008) of the Advanced Photon Source at Argonne National Laboratory using a wavelength of 0.412708 Å from 0.5 to 50° 2θ with a step size of 0.001° and a counting time of 0.1 s step−1. The beamline staff indicated that the sample showed significant beam exposure effects both visually (darkened) and by diffraction.
The powder pattern was indexed on a body centered monoclinic unit cell with a = 9.934, b = 12.406, c = 32.173, β = 96.20, V = 3941.6, Z = 8 using N-TREOR as incorporated into EXPO2014 (Altomare et al., Reference Altomare, Cuocci, Giacovazzo, Moliterni, Rizzi, Corriero and Falcicchio2013). Analysis of the systematic absences suggested the space group I2/a. The unit cell was transformed to the C2/c setting using Materials Studio (Dassault, 2018). The transformation matrix was [−1 0 1/0 1 0/−1 0 0]. A reduced cell search in the Cambridge Structural Database (Groom et al., Reference Groom, Bruno, Lightfoot and Ward2016) combined with the chemistry “C H Br N O S only” yielded no hits.
The structures of the bretylium and tosylate molecules were built and their conformations were optimized using Spartan ‘16 (Wavefunction, 2017). The resulting mol2 files were converted into Fenske-Hall Z-matrix files using OpenBabel (O'Boyle et al., Reference O'Boyle, Banck, James, Morley, Vandermeersch and Hutchison2011). The structure was solved with DASH (David et al., Reference David, Shankland, van de Streek, Pidcock, Motherwell and Cole2006) using the 1–13° portion of the diffraction pattern including {2 0 0} preferred orientation and Mogul Distribution Bias. Several of the 25 trials terminated early. The same solution was obtained using FOX (Favre-Nicolin and Černý, Reference Favre-Nicolin and Černý2002). The maximum sinθ/λ used in the structure solution was 0.3 Å−1. The structure solution ran overnight at one million trials/run. The structure could also be solved in space group Cc, but refinement of this more-complex model yielded unreasonable geometries for the tosylate anions (bent). A few very weak peaks are not indexed by this C-centered monoclinic cell, but can be indexed on primitive monoclinic cells having twice the cell volume. Since these cells increase the size of the problem by at least a factor of 4, we did not pursue these models, and chose the current model as the best model for the long-range average structure of this decomposing sample.
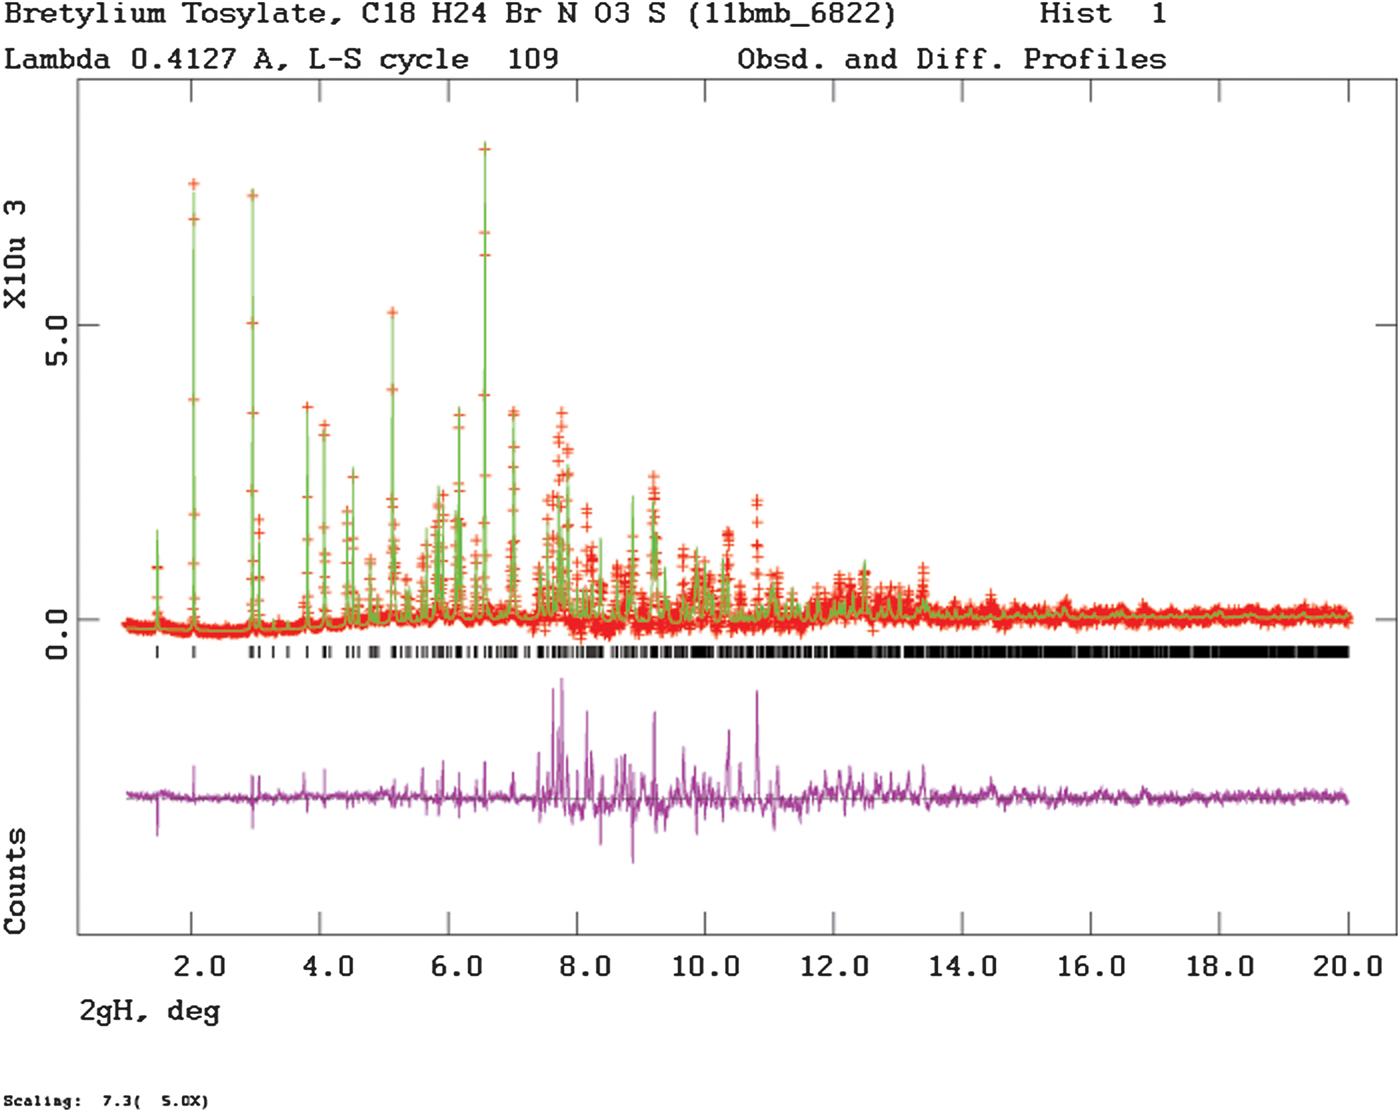
Rietveld refinement was carried out using GSAS (Toby, Reference Toby2001; Larson and Von Dreele, Reference Larson and Von Dreele2004). Only the 1.0–25.0° portion of the pattern was included in the refinement (d min = 0.953 Å). All non-H bond distances and angles were subjected to restraints, based on a Mercury/Mogul Geometry Check (Bruno et al., Reference Bruno, Cole, Kessler, Luo, Motherwell, Purkis, Smith, Taylor, Cooper, Harris and Orpen2004; Sykes et al., Reference Sykes, McCabe, Allen, Battle, Bruno and Wood2011) of the molecule. The Mogul average and standard deviation for each quantity were used as the restraint parameters. The two benzene rings were restrained to be planar. The restraints contributed 10.5% to the final χ2. The hydrogen atoms were included in calculated positions, which were recalculated during the refinement using Materials Studio (Dassault, 2018). A common U iso was refined for the carbon atoms of the benzene ring of the bretylium, another U iso for the non-H substituent atoms, another for the carbon atoms of the tosylate, and another for the oxygen atoms of the tosylate. The bromine was refined anisotropically. The U iso for each hydrogen atom was constrained to be 1.3× that of the heavy atom to which it is attached. The peak profiles were described using profile function #4 (Thompson et al., Reference Thompson, Cox and Hastings1987; Finger et al., Reference Finger, Cox and Jephcoat1994), which includes the Stephens (Reference Stephens1999) anisotropic strain broadening model. The background was modeled using a three-term shifted Chebyshev polynomial, with a five-term diffuse scattering function to model the Kapton capillary and any amorphous component. The final refinement of 115 variables using 24102 observations (24038 data points and 64 restraints) yielded the residuals R wp = 0.1207, R p = 0.0927, and χ 2 = 4.455. The largest peak (0.73 Å from C6) and hole (0.60 Å from C12) in the difference Fourier map were 1.54 and −1.03 eÅ−3, respectively. The Rietveld plot is included as Figure 2. The largest errors in the fit are in the shapes of some of the strong peaks.

Figure 2. (Color online) The Rietveld plot for the refinement of bretylium tosylate. The black crosses represent the observed data points, and the red line is the calculated pattern. The blue curve is the difference pattern, plotted at the same vertical scale as the other patterns. The vertical scale has been multiplied by a factor of 5 for 2θ>7.3°.
A density functional geometry optimization (fixed experimental unit cell) was carried out using CRYSTAL14 (Dovesi et al., Reference Dovesi, Orlando, Erba, Zicovich-Wilson, Civalleri, Casassa, Maschio, Ferrabone, De La Pierre, D-Arco, Noël, Causà and Kirtman2014). The basis sets for the H, C, and O atoms were those of Gatti et al. (Reference Gatti, Saunders and Roetti1994), and the basis sets for sulfur and bromine were those of Peintinger et al. (Reference Peintinger, Vilela Oliveira and Bredow2013). The calculation was run on eight 2.1 GHz Xeon cores (each with 6 Gb RAM) of a 304-core Dell Linux cluster at IIT, using 8 k-points and the B3LYP functional, and took ~85 h.
III. RESULTS AND DISCUSSION
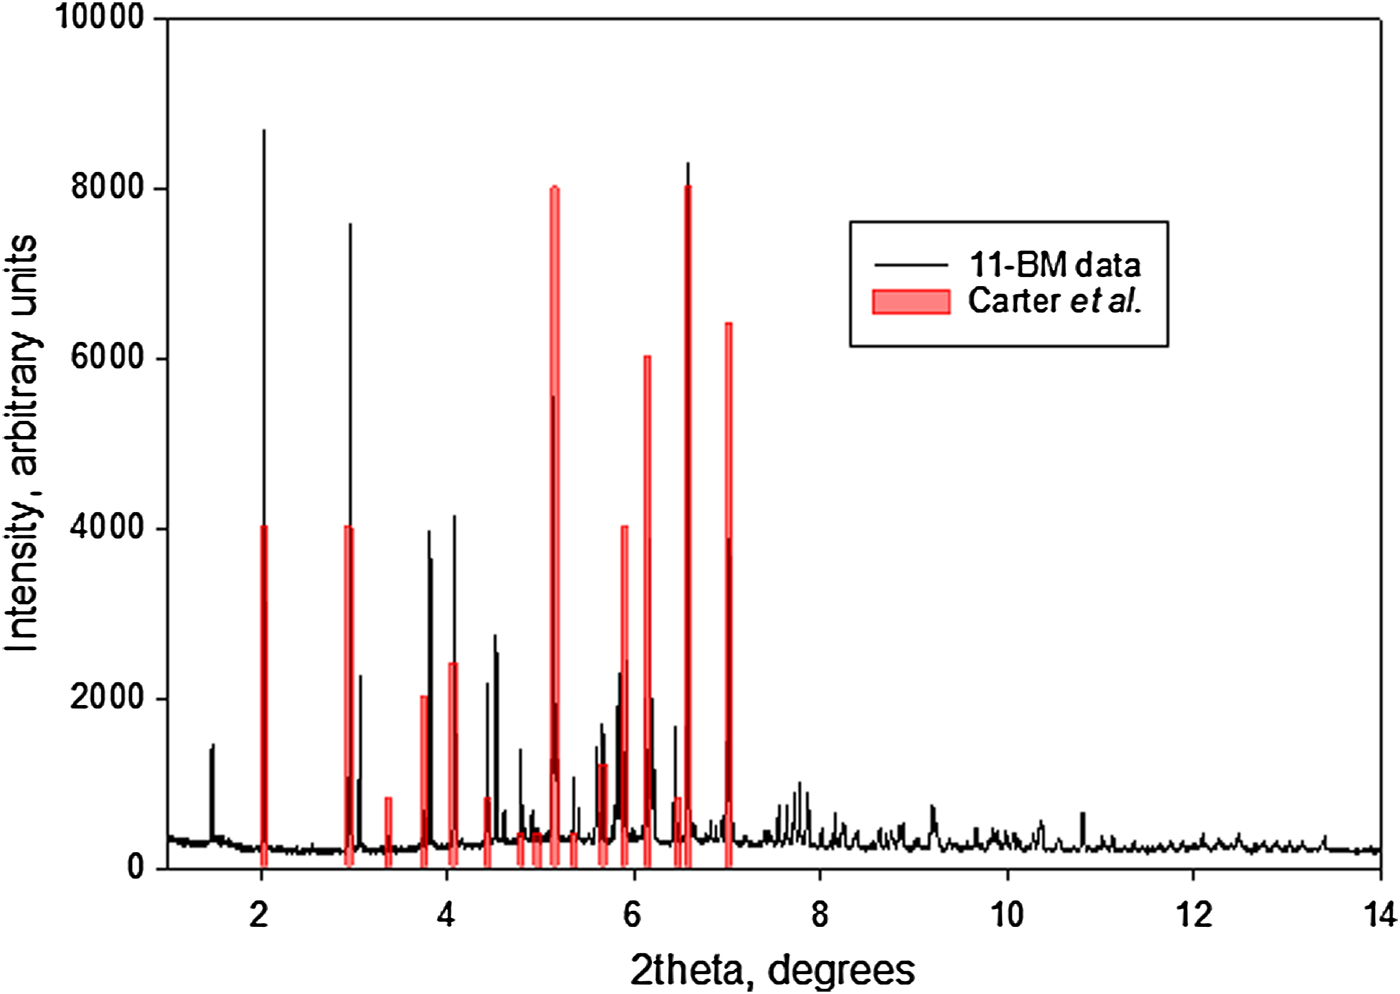
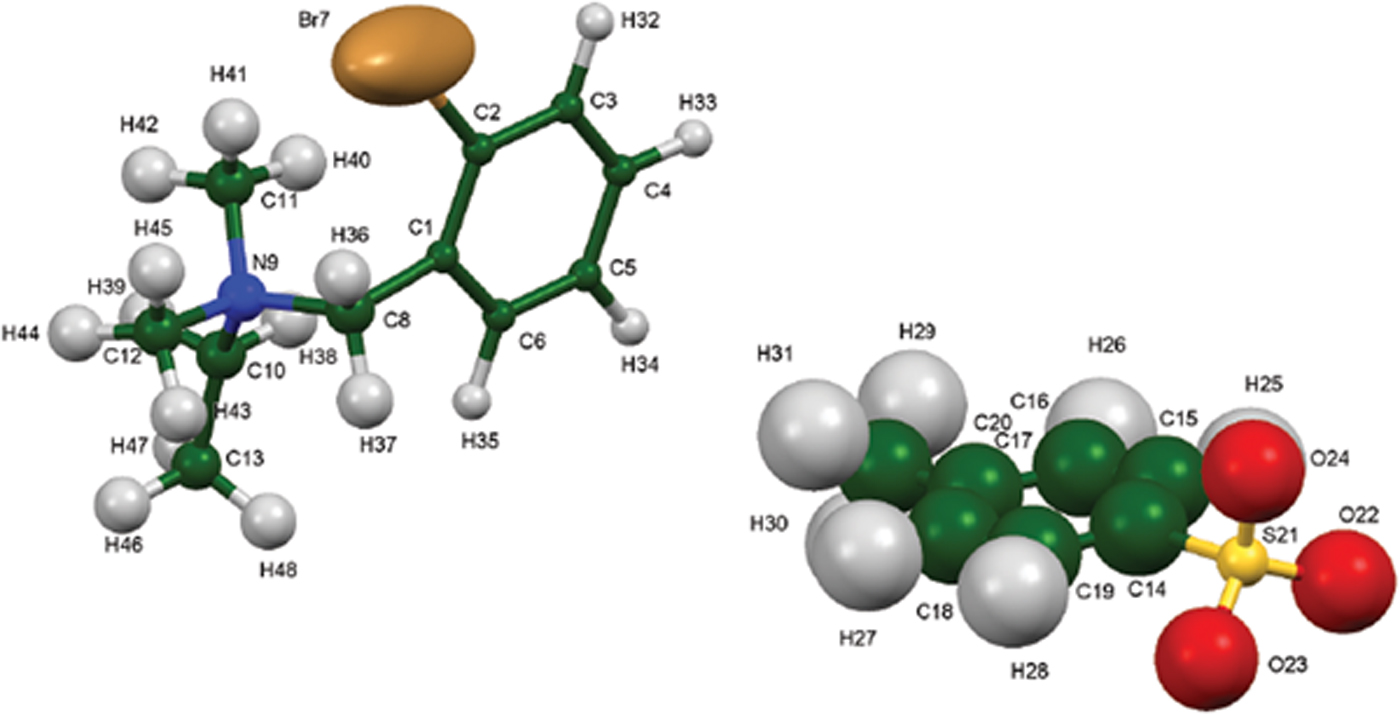
The synchrotron pattern of bretylium tosylate matches that of Carter et al. (Reference Carter, Amann and Baaske1980) well enough to conclude that they represent the same material (Figure 3). The refined atom coordinates of bretylium tosylate and the coordinates from the DFT optimization are reported in the CIFs attached as Supplementary Material. The root-mean-square Cartesian displacement of the non-hydrogen atoms in the bretylium cation is 0.383 Å (Figure 4). The largest deviation is 0.957 Å at C13 in the bretylium cation; the orientation of the ethyl group differs in the experimental and optimized structures. The root-mean-square deviation for the tosylate is 0.210 Å and the maximum deviation is 0.294 Å at O22 in the tosylate anion. The agreement of the refined and optimized cations is outside the normal threshold of 0.35 Å for correct powder structures (van de Streek and Neumann, Reference van de Streek and Neumann2014). The overall acceptable agreement between the refined and optimized structures is evidence that the experimental structure is correct, especially given the decomposition in the beam. This discussion uses the DFT-optimized structure. The asymmetric unit (with atom numbering) is illustrated in Figure 5, and the crystal structure is presented in Figure 6. The displacement ellipsoid of the Br is elongated, but not in a chemically reasonable direction. The unusual ellipsoid probably indicates that the decomposition in the X-ray beams involves the Br atom.

Figure 3. (Color online) Comparison of the synchrotron pattern of bretylium tosylate to the peak list reported by Carter et al. The positions of the reference pattern have been adjusted to match the synchrotron wavelength of 0.412708 Å.
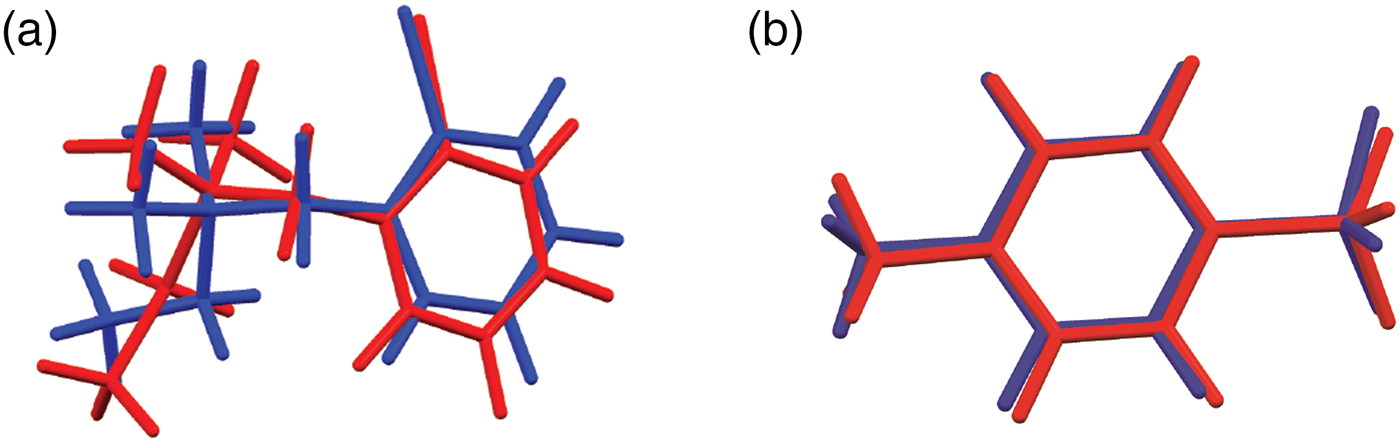
Figure 4. (Color online) (a) Comparison of the refined and optimized structures of the bretylium cation in bretylium tosylate. The Rietveld refined structure is in red, and the DFT-optimized structure is in blue. (b) Comparison of the refined and optimized structures of the tosylate anion in bretylium tosylate. The Rietveld refined structure is in red, and the DFT-optimized structure is in blue.

Figure 5. (Color online) The asymmetric unit of bretylium tosylate, with the atom numbering. The atoms are represented by 50% probability spheroids/ellipsoids.

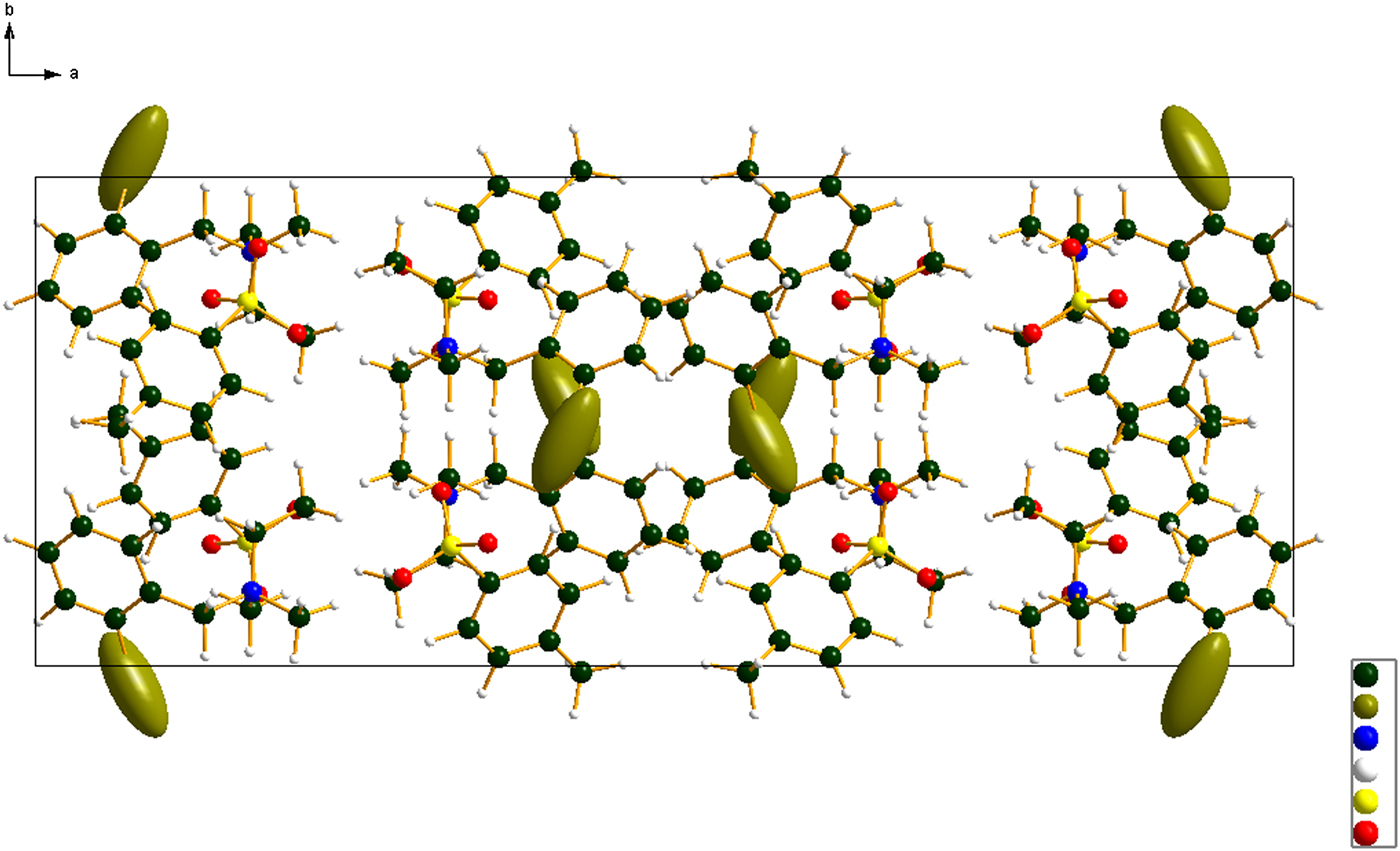
Figure 6. (Color online) The crystal structure of bretylium tosylate, viewed down the c-axis.
All of the bond distances, bond angles, and torsion angles fall within the normal ranges indicated by a Mercury Mogul Geometry check (Macrae et al., Reference Macrae, Bruno, Chisholm, Edington, McCabe, Pidcock, Rodriguez-Monge, Taylor, van de Streek and Wood2008). Quantum chemical geometry optimizations (DFT/6-31G*/water) using Spartan ‘16 (Wavefunction, 2017) indicated that the observed conformation of the bretylium cation is 1.8 kcal mol−1 higher than a local minimum. Similar calculation on the tosylate anion indicated that the observed conformation was 16.2 kcal mol−1 higher in energy than a local minimum. Molecular mechanics conformational analysis indicated that the tosylate anion and the bretylium cation were very close to the global minimum energy conformations.
Analysis of the contributions to the total crystal energy using the Forcite module of Materials Studio (Dassault, 2018) suggests that angle distortion terms are significant in the intramolecular deformation energy. Distortion is mainly in the ethyl group of the bretylium cation. The intermolecular energy contains significant contributions from van der Waals and electrostatic attractions, which in this force-field-based analysis include hydrogen bonds. The hydrogen bonds are better analyzed using the results of the DFT calculation.
The crystal structure can be viewed as layered parallel to the bc plane. The layers are double, the center consisting of the cation/anion polar interactions and the outer surface of the double layers consists of hydrocarbon interactions. In the absence of normal hydrogen bond donors, the only hydrogen bonds in the bretylium tosylate structure are C–H…O hydrogen bonds (Table I). Methyl, methylene, and phenyl hydrogens act as donors to oxygen atoms of the tosylate anion.
Table I. Hydrogen bonds (CRYSTAL14) in bretylium tosylate.

The volume enclosed by the Hirshfeld surface (Figure 7; Hirshfeld, Reference Hirshfeld1977; McKinnon et al., Reference McKinnon, Spackman and Mitchell2004; Spackman and Jayatilaka, Reference Spackman and Jayatilaka2009; Wolff et al., Reference Wolff, Grimwood, McKinnon, Turner, Jayatilaka and Spackman2012) is 492.67 Å3, 97.83% of 1/8 the unit-cell volume. The molecules are thus not tightly packed. All of the significant close contacts (red in Figure 7) involve the hydrogen bonds.
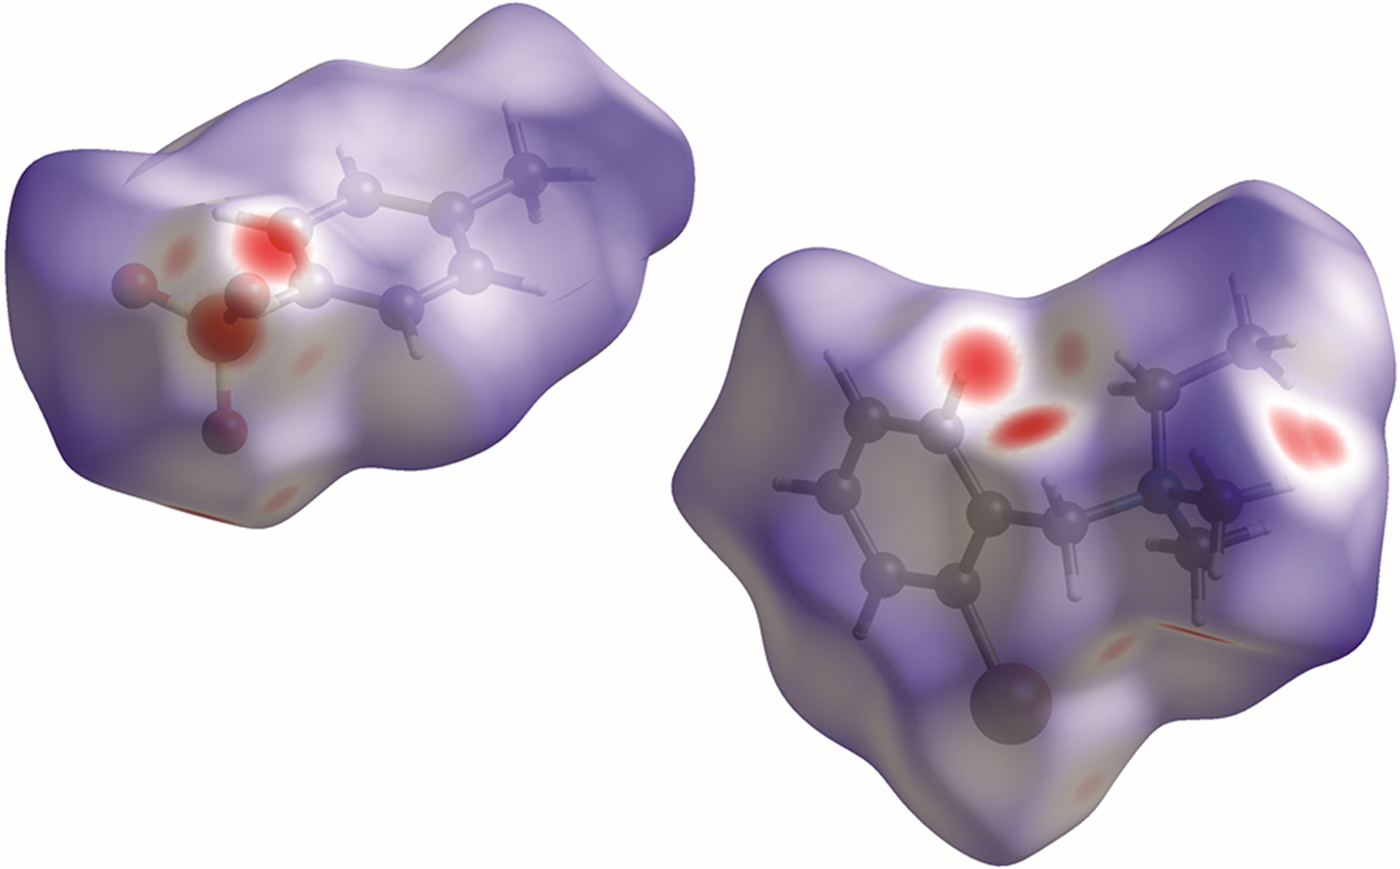
Figure 7. (Color online) The Hirshfeld surface of bretylium tosylate. Intermolecular contacts longer than the sums of the van der Waals radii are colored blue, and contacts shorter than the sums of the radii are colored red. Contacts equal to the sums of radii are white.
The Bravais–Friedel–Donnay–Harker (Bravais, Reference Bravais1866; Friedel, Reference Friedel1907; Donnay and Harker, Reference Donnay and Harker1937) morphology suggests that we might expect platy morphology for bretylium tosylate, with {100} as the principal faces. A fourth-order spherical harmonic preferred orientation model was included in the refinement; the texture index was 1.0589, indicating that preferred orientation was present in this rotated capillary specimen. The powder pattern of bretylium tosylate from this synchrotron data set has been submitted to ICDD for inclusion in the Powder Diffraction File.
SUPPLEMENTARY MATERIAL
The supplementary material for this article can be found at https://doi.org/10.1017/S088571561800060X.
ACKNOWLEDGEMENTS
Use of the Advanced Photon Source at Argonne National Laboratory was supported by the US Department of Energy, Office of Science, Office of Basic Energy Sciences, under Contract No. DE-AC02-06CH11357. This work was partially supported by the International Centre for Diffraction Data. The authors thank Lynn Ribaud and Saul Lapidus for their assistance in the data collection, and Andrey Rogachev for the use of computing resources at IIT.