


Introduction
Schizophrenia is a severe mental illness accompanied by clinical deterioration (Lieberman et al., Reference Lieberman2001), neurocognitive deficits (Kremen et al., Reference Kremen2001) and progressive structural brain changes (Olabi et al., Reference Olabi2011). Growing evidence suggest that progressive cortical thinning in schizophrenia predominantly occurs in the frontal and temporal cortices (van Haren et al., Reference van Haren2011). Antipsychotic medication has been shown to directly alter brain structure in both preclinical studies (Dorph-Petersen et al., Reference Dorph-Petersen2005) as well as in schizophrenia patients (Fusar-Poli et al., Reference Fusar-Poli2013). Furthermore, higher level of symptoms and lower levels of functioning have been associated with more pronounced structural changes (Cahn et al., Reference Cahn2006), and low intelligence has been found to be associated with lower brain volume in a combined sample of antipsychotic-naïve schizophrenia patients and healthy controls (HCs) (Rais et al., Reference Rais2012). However, confounding factors such as substance use, chronicity and previous exposure to antipsychotic medication complicate the disentangling of specific disease-related structural brain changes (Ho et al., Reference Ho2011; Andreasen et al., Reference Andreasen2013).
Assessment of cortical structures has shifted from measures such as cortical volume to a more detailed description of the cortical structures, such as the cortical thickness, surface area and the cortical curvature. These measurements may be more sensitive to detect variability in brain structure associated with genetic and neurodevelopmental factors (White et al., Reference White2003; Panizzon et al., Reference Panizzon2009; Palaniyappan and Liddle, Reference Palaniyappan and Liddle2012). FreeSurfer uses an automated surface-based approach, and has been widely used to provide these refined cortical measurements (Dale et al., Reference Dale, Fischl and Sereno1999; Fischl et al., Reference Fischl, Sereno and Dale1999).
In antipsychotic-naïve schizophrenia patients, cortical thinning has been observed in multiple cortical regions within frontal, temporal, parietal and occipital lobes (Plitman et al., Reference Plitman2016). Alterations in surface area have been less frequently investigated, but reductions in frontal, temporal regions and insula have been reported (Crespo-Facorro et al., Reference Crespo-Facorro2000b; Rais et al., Reference Rais2012). Findings regarding both cortical thickness and surface are with conflicting results (Rais et al., Reference Rais2012; Goghari et al., Reference Goghari2013; Xiao et al., Reference Xiao2015). Only few studies have investigated the cortical mean curvature and only in medicated schizophrenia patients. These studies report higher curvature in parahippocampal, lingual and visual cortices of patients (Schultz et al., Reference Schultz2010, Reference Schultz2013). To our knowledge, studies of mean curvature in antipsychotic-naive patients are absent.
The specific effect of antipsychotic medication on cortical structures is debated. A recent prospective study found risperidone and quetiapine to increase the thickness of the middle frontal cortex (Goghari et al., Reference Goghari2013). In contrast, a more naturalistic study has observed progressive cortical thinning after long-term antipsychotic treatment (van Haren et al., Reference van Haren2011), but this finding has not been consistent (Roiz-Santianez et al., Reference Roiz-Santianez, Suarez-Pinilla and Crespo-Facorro2015).
In antipsychotic-naïve schizophrenia patients, previous studies of cortical structures and associations with clinical symptoms have shown equivocal results. Cortical thinning in the insular cortex may be associated with more positive symptoms (Xiao et al., Reference Xiao2015), whereas cortical thinning within the frontal lobe has been associated with more negative symptoms (Venkatasubramanian et al., Reference Venkatasubramanian2008). However, negative findings have also been reported (Plitman et al., Reference Plitman2016). To our knowledge, only two studies have reported on the relation between cortical surface area and clinical severity. These studies reported that a thinner insular cortex was associated with more positive symptoms (Crespo-Facorro et al., Reference Crespo-Facorro2000a), but no associations between surface area of the frontal lobe and symptoms were found (Crespo-Facorro et al., Reference Crespo-Facorro2000b). In addition to symptoms, schizophrenia has been widely associated with impairment of general cognitive ability, lower current intelligence (Mesholam-Gately et al., Reference Mesholam-Gately2009), as well as lower premorbid intelligence (Gilvarry et al., Reference Gilvarry2000). Surface area may be associated with current intelligence in general and possibly also to premorbid intelligence in patients (Gutiérrez-Galve et al., Reference Gutiérrez-Galve2010). However, another study reported no associations between surface area, cortical thickness and current intelligence in patients or in HCs (Rais et al., Reference Rais2012).
Many factors may influence cortical structures including tobacco smoking (Jørgensen et al., Reference Jørgensen2015), alcohol consumption (Lange et al., Reference Lange2017) and cannabis (Rais et al., Reference Rais2010). Careful assessment of these potential confounders may therefore reduce variability between studies.
In a sample of initially antipsychotic-naïve schizophrenia patients and matched HCs, we here investigated three measures of cortical structure namely mean cortical thickness, total cortical surface area and mean cortical curvature. Patients were re-examined after 6 weeks of treatment with a relatively selective dopamine D2/3 receptor antagonist (amisulpride). The cortical measures were associated with clinical characteristics, cognition and amisulpride dose. We hypothesized that before treatment, patients compared with HCs would exhibit lower cortical thickness and surface area, but higher cortical curvature. After treatment, we expected cortical thickness to further decrease, but surface area and curvature were expected to remain relatively stable.
Methods
Subjects
Antipsychotic-naïve patients experiencing their first episode of psychosis were recruited from in- and outpatient clinics in the Capital Region of Copenhagen, Denmark. Several studies using other modalities have been published on this cohort (full publication list provided in Supplementary Material and Methods), and the subjects included in the current analyses presented here partially overlap with the subjects first described in (Nielsen et al., Reference Nielsen2012).
Patients between 18 and 45 years of age fulfilling the Classification of Mental and Behavioural Disorders (ICD-10) criteria of either schizophrenia or schizoaffective disorder were included in the study. The diagnosis was assessed by the Schedule of Clinical Assessment in Neuropsychiatry (SCAN). Exclusion criteria were: previous treatment with antipsychotics or methylphenidate, antidepressant treatment within 1 month prior to baseline examinations, previous unconsciousness for more than 5 min, current drug dependency and serious physical disease. Recent recreational drug intake was assessed by a urine test (Rapid Response, Jepsen HealthCare, Tune, Denmark).
The HCs were recruited from the Capital Region of Denmark through online advertisement, and matched with patients on gender, age and parental socioeconomic status. HCs were excluded if they had current or previous psychiatric illness, drug abuse or psychiatric illness in first-degree relatives. All patients had a normal physical and neurological examination at baseline. To rule out overt pathology, a trained radiologist assessed all magnetic resonance (MR) scans (see online Supplementary Fig. S1 for Consort diagram).
Clinical measures
The severity of psychopathology was assessed with the Positive and Negative Syndrome Scale (PANSS), and level of functioning was assessed with the Global Assessment of Functioning (GAF). Duration of untreated illness (DUI) was defined as the time patients experienced a deterioration of functioning due to psychosis-related symptoms. Handedness was assessed with the Edinburg Handedness Inventory (EHI). Subjects’ lifetime use of tobacco, alcohol, cannabis, stimulants, hallucinogens and opioids were categorized according to an ordinal five-item scale for each recreational drug (0 = never tried/1 = tried few times/2 = use regularly/3 = harmful use/4 = dependency).
Cognitive measures
The Danish Adult Reading Test (DART) was used to estimate premorbid intelligence, and the Wechsler Adult Intelligence Test version 3 (WAIS-III) was used to estimate current intelligence based on four sub-tests: vocabulary, similarities, block design and matrix reasoning.
Medication
All patients were antipsychotic-naïve during the baseline investigations. After baseline examinations, patients commenced treatment with amisulpride, which is a relatively selective D2/3 receptor antagonist monotherapy (used as ‘tool compound’) for 6 weeks. Amisulpride dose was adjusted individually aiming at minimizing clinical symptoms as well as adverse effects. Medication adherence was not formally assessed, but close, weekly clinical contact with research staff reduced the risk of non-adherence. Anticholinergic medication was not allowed. Benzodiazepines or sleeping medication were allowed but not on days of examination. During the 6-week follow-up period, patients’ use of benzodiazepines (oxazepam) and sleep medication (zopliclone) was registered.
MRI acquisition and processing
Structural MR imaging (MRI) scans were obtained from a Philips Achieva 3T whole body MRI scanner (Philips Healthcare, Best, The Netherlands) with an eight-channel SENSE head coil (Invivo, Orlando, Florida). The three-dimensional high-resolution T1-weighted images were acquired with the following parameters: repetition time 10 ms, echo time 4.6 ms, flip angle 8° and voxel size 0.79 mm × 0.79 mm × 0.80 mm.
The acquired T1-weighted images were processed in FreeSurfer version 5.3.0 using methods described in detail elsewhere (Dale et al., Reference Dale, Fischl and Sereno1999; Fischl et al., Reference Fischl, Sereno and Dale1999). Images were processed in the longitudinal processing stream (Reuter et al., Reference Reuter2012) creating an unbiased within-subject template using robust, inverse consistent registration (Reuter et al., Reference Reuter, Rosas and Fischl2010). A non-standard, 3T specific option was used for Talairach alignment (i.e. Schwartz atlas) (FreeSurfer Previous Release Notes, 2013) and intensity normalization (Zheng et al., Reference Zheng, Chee and Zagorodnov2009) for all processing steps.
It is controversial whether manual editing of cortical structures is needed, and despite general recommendations of editing procedures, a great variability in manual editing techniques has been used (McCarthy et al., Reference McCarthy2015). The absence of uniform procedures leaves room for subjective interpretation, which in turn may affect reproducibility. McCarthy et al. reported lower effect sizes after manual editing in approximately half of the cortical regions in FreeSurfer (McCarthy et al., Reference McCarthy2015). This finding is comparable to our own pilot study indicating both significant decreases and increases in precision after manual editing (Jessen et al., Reference Jessen2016). For these reasons, a fully automatic approach was chosen in the current study. For completeness, the data were also processed with manual editing and these results are provided in Supplementary Material and Methods.
The cortical measures for each hemisphere (including cortical thickness, surface area and curvature) were obtained and extracted automatically from the Desikan atlas (Desikan et al., Reference Desikan2006). The mean curvature for each hemisphere was calculated by weighting the curvature of each region of interest (ROI) by its surface area. The mean curvature (H) is an extrinsic measure of curvature and is calculated as the average of two principle curvatures [i.e. maximum (k 1) and minimum (k 2)] on each point of the surface (Pienaar et al., Reference Pienaar2008):
 $H = \displaystyle{1 \over 2}\left( {k_1 + k_2} \right).$
The maximum principle curvature (k 1) approximately represents the gyral/sulcal banks and k 1 is by definition larger than the minimum principle curvature (k 2), which represents smaller local curvatures. A negative value of k 1 is suggestive of variations in the gyrus, and positive values are suggestive of variations in the sulcus. Thus, mean curvature is dominated by k 1. However, as the mean curvature is unsigned, it cannot be determined whether the alteration is driven by alterations in the sulcus or the gyrus. A higher mean curvature is indicative of a more ‘sharp’ curvature, and mean curvature approaching zero is indicative of a less ‘sharp’ curvature. See Fig. 1 for a description of the different cortical measures.
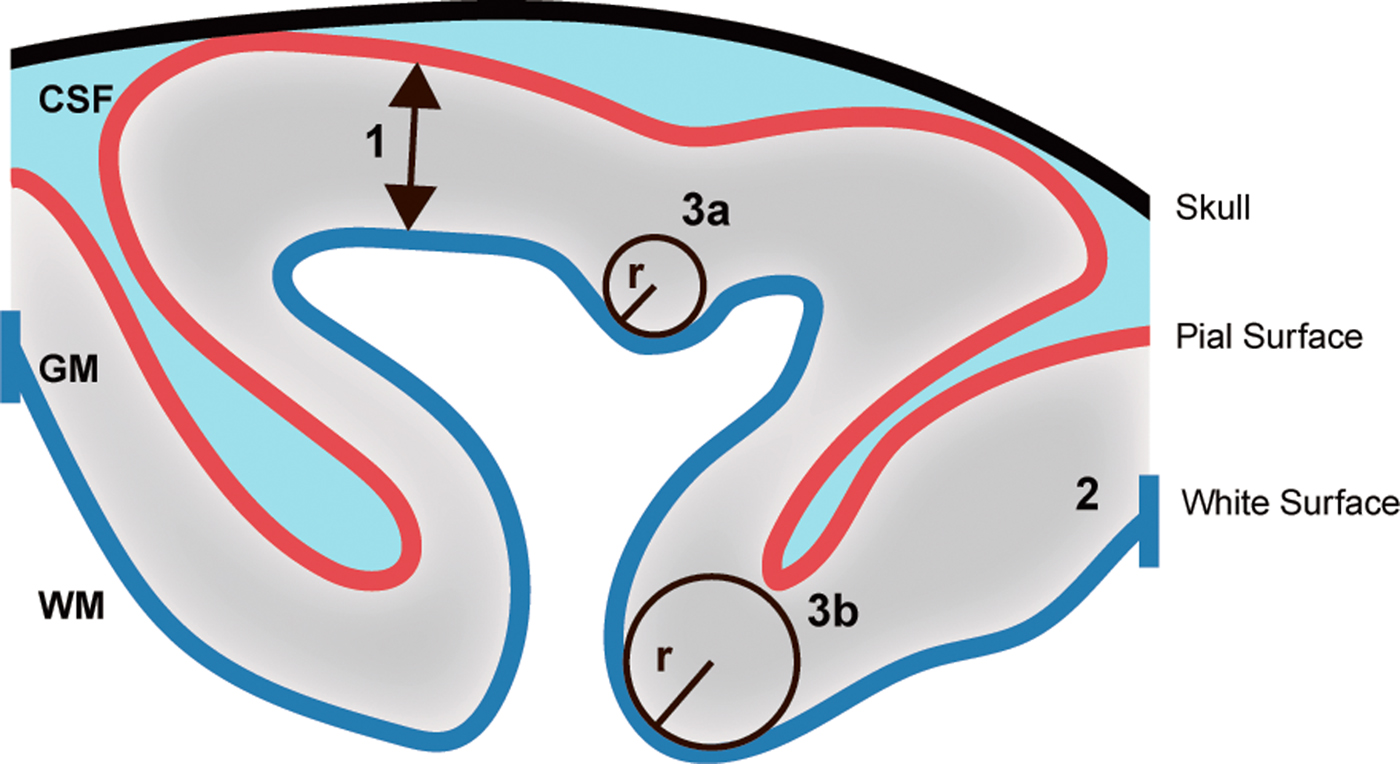
Fig. 1. Measurements of cortical structures. The figure illustrates the principles behind the measurements of cortical thickness, surface area and mean cortical curvature. (1) Cortical thickness is calculated as the distance (mm) between the pial and white surface. (2) Cortical surface area is the area (mm2) of the white surface. (3) Cortical curvature is measured as 1/radius(r) and the mean curvature is the average of two principal curvatures. Thus, a small radius indicates a ‘sharp’ curvature (3a), and a large radius indicates a less ‘sharp’ curvature (3b). GM, grey matter; WM, white matter; CSF, cerebrospinal fluid.
Statistical analysis
To test for normality, the Shapiro–Wilk test was used and supplemented with a visual inspection of the histograms. Outliers and extreme measures in the cortical structures and their corresponding hemisphere were visually inspected in Freeview (part of the FreeSurfer package) and excluded if image quality was judged poor (e.g. due to motion artefacts, inadequate contrast or unusual segmentations). If the measures deviated from normality, either the values were transformed or a non-parametric test was used.
Age, handedness, body weight, DUI, amisulpride dose and current intelligence were not normally distributed, and statistical analyses were performed with a Mann–Whitney U test. Estimated premorbid intelligence was tested with an independent group's t test. Gender distributions and parental socioeconomic status were tested with a Pearson's χ2 test. Differences in PANSS and GAF between baseline and 6-week follow-up scores were tested with a Wilcoxon signed-ranks test.
As the values of lifetime substance use was considered an ordinal value with more than two levels, group differences were tested with a Kruskal–Wallis test. To obtain one operational measure of ‘accumulated lifetime substance use’, the values of alcohol, tobacco, cannabis, opioids, stimulants and hallucinogens for each participant were summed into one score.
For both baseline and follow-up measures of both global cortical structures and for the individual ROIs, univariate analyses [analysis of variance (ANOVA)] with age, gender and ‘accumulated lifetime substance use’ as covariates were used to test group differences. In a planned post-hoc analysis, the covariate ‘accumulated lifetime substance use’ was replaced with the individual recreational drugs (alcohol, tobacco, cannabis, opioids, stimulants, hallucinogens) if a significant effect was found. In addition, the inter-correlation was tested between the three measures cortical structure.
To express the rate of change per week, the symmetrized percentage change (SPC) was used and calculated as followed:
 $$\eqalign{{\rm SPC} & = 100 \times \displaystyle{{M_2 - M_1} \over {t_2 - t_1}} \times \displaystyle{1 \over {0.5(M_1 + M_2)}} \cr & = 100 \times \displaystyle{{{\rm Rate}} \over {{\rm Temporal}\;{\rm Average}}}}$$
M 1 and M 2 are the cortical measurements and t 1 and t 2 are time at baseline and follow-up, respectively. The SPC was analysed using an ANOVA with the same covariates as in the cross-sectional analysis. As a post-hoc test, the use of oxazepam and zopiclone during the 6-week follow-up period was added separately to the ANOVA model.
We supplemented the regular statistical analysis with the reliable change index (RC) (Jacobson and Truax, Reference Jacobson and Truax1991), and to account for multiple comparisons in the association analyses (each cortical structure separately) with cognitive and clinical variables, we applied false discovery rate (FDR) correction (Benjamini and Hochberg, Reference Benjamini and Hochberg1995). RC provides an estimate of the extent to which an observed change may reflect a random variability in the re-assessment of a given measurement. If the absolute RC value is >1.96, a subject's post-test score can be considered to reflect a reliable change in the cortical structure (see Supplementary Material and Methods).
Within patients, a Spearman's rank-correlation coefficient was applied to test for associations between cortical structures and clinical characteristics at baseline and at 6 weeks’ follow-up. In baseline analyses, we calculated the correlation between cortical structures and DUI and in follow-up analyses with dose of amisulpride. The SPC of cortical structures was correlated with the percentage change in PANSS and GAF; and also amisulpride dose received at 6 weeks’ follow-up. Only ROIs that survived FDR correction were correlated with clinical characteristics and amisulpride dose.
Prior to analyses of the cognitive data, the raw scores of DART and WAIS-III subdomains (i.e. vocabularies, similarities, block design and matrix reasoning) were transformed into Z-scores. The average of the four subdomains of WAIS-III was used as an estimate of current intelligence. In the previous described ANOVA model, the interaction between group and the cognitive measures was tested with the cortical measure as the dependent variable. A Spearman's rank-correlation coefficient was applied to test for associations between cortical structures and premorbid and current intelligence. As a post-hoc test, the effect of current intelligence on the cortical structures was tested by adding current intelligence to the ANOVA model as a covariate. IBM SPSS Statistics (IBM Corp. Released 2013. IBM SPSS Statistics for Windows, Version 22.0. Armonk, NY, USA: IBM Corp.) was used for the statistical analyses. For all the analyses, the significance levels were set to 0.05 (two-tailed).
Results
Demographics
Sixty-nine patients and 67 HCs were included in the study. At baseline, 13 patients and eight HCs were not included in the analysis (online Supplementary Fig. S1), thus baseline data were available on 56 patients and 59 HCs. Fifteen patients and eight HCs were not included at follow-up yielding a total follow-up sample of 41 patients and 51 HCs (online Supplementary Fig. S1). At baseline, patients had a significantly higher lifetime use of tobacco, cannabis, stimulants and opioids than HCs. Groups did not differ in age, gender, parental socioeconomic status, handedness, body weight or in use of alcohol and hallucinogens (Table 1).
Table 1. Demographic and clinical characteristics

The table shows demographics and clinical characteristics. s.d., standard deviation; DUI, duration of untreated illness and baseline; PANSS, Positive and Negative Syndrome Scale; GAF, Global Assessment of Functioning; P-SES, parental socioeconomic status; lifetime substance use was assessed on an ordinal scale (i.e. never tried, tried a few times, use regularly, harmful use or dependency); DART, the Danish Adult Reading Test; WAIS-III, the Wechsler Adult Intelligence Test, version 3.
a Mann–Whitney U test.
b Wilcoxon signed-ranks test was performed within patients based on patients, which also have a baseline measurement.
c Kruskal–Wallis test.
d Use of oxazepam or zopliclone on ‘per-needed’ basis during the 6-week follow-up
Cortical structure and clinical characteristics before treatment
Patients and HCs did not differ in cortical thickness or surface area (Table 2), but patients had a higher curvature in the left hemisphere (p = 0.015), and this finding survived FDR correction (Fig. 2). However, none of the individual ROIs survived FDR correction (online Supplementary Table S1–S3). To ensure the significant finding was not driven by outliers, we performed a post-hoc analysis excluding the four patients and three HCs, who had standardized values (±2) of the left hemisphere curvature, and remained significantly higher (F = 6.82; p = 0.01).

Fig. 2. Plots of mean curvature. The figure shows plots of mean curvature (/mm) of each hemisphere in antipsychotic-naïve schizophrenia patients and in healthy controls. ANOVA showed a significant group difference (*) (p = 0.015) in the mean curvature of left hemisphere (i.e. a higher mean curvature in patients) (a). No group difference (p = 0.31) was found in the mean curvature of right hemisphere (b). Please note that the y-axis does not start in point 0, as showed by dashed lines. Mean values are shown by horizontal black lines.
Table 2. Cortical structures

The table shows the means of the structural measures at baseline, 6 weeks and the change in the symmetrized percentage change (SPC) after 6 weeks. The baseline measurements comprised 55 patients and 56 healthy controls (one patient and three healthy controls had missing data on substance use). SPC was calculated for subjects with both a baseline and follow-up measurement. The follow-up data comprised 41 patients and 48 healthy controls. p values are presented in the group, age, gender and substance use columns. s.d., standard deviation. p values shown in bold with an asterisk (*) survived FDR correction.
The three measures of cortical structures did not significantly inter-correlate (p > 0.19). Psychopathology and DUI did not correlate with the cortical measures (Table 3). Accumulated lifetime substance use was associated with thinner total cortex [t = −2.05, p = 0.04, 95% CI (−0.015 to −0.0003)] and thinner right hemisphere cortex [t = −2.28, p = 0.03, 95% CI (−0.017 to −0.001)] across groups.
Table 3. Cortical structures in relation to clinical characteristics and amisulpride

The table shows the associations between cortical structures and clinical patient characteristics at baseline and follow-up. Baseline: PANSS (n = 55); GAF (n = 52); DUI (n = 54). Additionally, the table shows the symmetrized percentage change (SPC) in cortical structure and is associated with the percentage change in the clinical patient characteristics. Six-week follow-up and percentage change: PANSS (n = 41); GAF (n = 36); amisulpride (n = 37). PANSS, Positive and Negative Syndrome Scale; GAF, Global Assessment of Functioning; DUI, duration of untreated illness. Spearman rank correlations; ρ; p value. p values shown in bold with an asterisk (*) survived FDR correction.
Patients and HCs did not differ on estimated premorbid IQ, but patients’ current intelligence was significantly lower (Table 1). In both patients and HCs, lower surface area was correlated with lower estimated premorbid intelligence (p = 0.017) (Table S4). Also, higher curvature correlated to lower estimated premorbid intelligence (p = 0.009) as well as current intelligence (p < 0.001). These associations with cognition survived FDR correction. Cortical thickness did not correlate with cognitive measures. No significant interaction was found between group and estimated premorbid (p > 0.2) or current intelligence (p > 0.4) on the cortical measures. When controlling for current intelligence, no group differences in left hemisphere mean curvature was found (F = 0.94; p = 0.34). However, due to missing data on current intelligence in 12 subjects, the sample was reduced to 48 patients and 51 controls.
Cortical structure and clinical characteristics after 6 weeks treatment
The average amisulpride dose was 275.0 ± 162.6 mg/day. During the 6-week treatment period, patients improved in PANSS-positive and general symptoms, as well as in GAF, but no significant improvement in negative symptoms was observed (Table 1).
No group differences in SPC were found in any of the cortical measures using ANOVA (Table 2). The majority (>80%) of subjects had an RC absolute value below 1.96, and therefore did not have a change in cortical measures beyond the variability of the measurement. Those subjects, with an RC absolute value above 1.96, equally showed increases and decreases in the measurement (online Supplementary Table S5). The amisulpride dose was not associated with any cortical measures at 6 weeks or SPC (Table 3). Adding the use of oxazepam or zopiclone to the ANOVA model resulted in a significant effect of group in left hemisphere mean curvature at 6 weeks, but this effect did not survive FDR correction. A decrease in SPC (i.e. cortical thinning) was correlated with less improvement in general (expect for the left hemisphere) and total PANSS symptoms (Table 3).
Discussion
In this longitudinal study of initially antipsychotic-naïve patients, we investigated cortical structures and their clinical correlates before and after 6 weeks of antipsychotic monotherapy with the relatively selective D2/3 receptor compound, amisulpride. The cortical thickness and surface area did not differ from HCs at baseline, which is in accordance with several other studies reporting no baseline differences in these measurements (Rais et al., Reference Rais2012; Goghari et al., Reference Goghari2013; Xiao et al., Reference Xiao2015). However, at baseline, the patients displayed a sharper curvature in the left hemisphere (Fig. 1). The cortical gyrification, or the degree of cortical folding, has been found to be altered in schizophrenia and is suggested to reflect an aberrant underlying connectivity (White and Hilgetag, Reference White and Hilgetag2011). Interestingly, a sharper gyral curvature has also been observed in children and adolescent patients with schizophrenia (White et al., Reference White2003). The neuronal mechanisms behind the cortical curvature has not been clarified (Bayly et al., Reference Bayly, Taber and Kroenke2014). It has been hypothesized that the cortical folding pattern is driven by an axonal tension, which pulls related cortical regions closer together (Van Essen, Reference Van Essen1997; Hilgetag and Barbas, Reference Hilgetag and Barbas2006). Alternatively, differential growth patterns between outer and inner layers of the cortex may result in cortical buckling (Richman et al., Reference Richman1975). Regardless of the underlying mechanism, the cortical folding primarily occurs during early neurodevelopment (White et al., Reference White2010). As such, it could be speculated that these observations of altered cortical curvature in the early stages of schizophrenia could arise from aberrations in neurodevelopment.
In our study, we rigidly accounted for recreational substance use in both patients and HCs. We observed that ‘accumulated lifetime substance use’ was associated with cortical thinning, but not with surface area or curvature. Our findings are in line with previous studies, which have reported cortical thinning in both cannabis (Habets et al., Reference Habets2011) and alcohol (Lange et al., Reference Lange2017) users.
As described above, we have presented the unedited data because of the potential risk of introducing subjective effects during the manual editing process. Nevertheless, the results of the manually edited data generally agree with the unedited data (see Supplementary Material and Methods). In the manually edited data, we did, however, observe a subtle but significant group difference in SPC for the curvature in the right hemisphere (p = 0.036). In the unedited data, this finding only reached trend-level significance (p = 0.08). However, as more than 80% of all the subjects (both in the manual edited and unedited data) have an absolute RC value below 1.96, these results should be interpreted with caution (online Supplementary Table S5 and Table S6). Thus, our overall results do not support the need of manual editing of the cortical structures from FreeSurfer. We note, however, that in this study, the quality of the unedited automatic segmentations is probably higher than in standard cross-sectional studies, the reason being that our longitudinal setup allowed us to combine scans from multiple time points into one within-subject template.
We found that improvements in symptoms were associated with a thickening of the cortex after 6 weeks. Chronic schizophrenia with poor functional and clinical outcome has been associated with cortical volume reductions (Cahn et al., Reference Cahn2006), and cortical thickness may therefore comprise early proxy measures for clinical improvement.
Recent studies in twins suggest that surface area, rather than thickness (Vuoksimaa et al., Reference Vuoksimaa2015) or folding (Docherty et al., Reference Docherty2015), is associated with cognitive abilities. Similarly, we found that reduced surface area in both patients and HCs is associated with a lower estimated premorbid intelligence. Intriguingly, we also find that a sharper curvature is associated with both a lower premorbid and current intelligence. Since we did not observe any group differences between the association of cortical structures and premorbid and current intelligence, these associations appear non-specific for schizophrenia. Likewise, a previous study found current intelligence to be positively associated with whole brain volume in a combined sample of antipsychotic-naïve schizophrenia patients and HCs (Rais et al., Reference Rais2012).
It has been vividly debated if antipsychotic treatment is associated with neuroprotective or neurotoxic effects on the human brain (Ansell et al., Reference Ansell2015). Since the dose of amisulpride in the current study did not correlate to cortical thickness, surface area and mean curvature, we do not find support for cortical effects of 6 weeks of low-dose treatment with a relatively specific D2/3 receptor blocker. The absence of cortical effects after treatment is in accordance with the previous data from our group based on a comparable, but independent cohort of initially antipsychotic-naïve patients. In that study, we did not find associations between grey matter volume and extrastriatal dopamine D2/3 binding potentials nor blockade after 3 months of treatment with either risperidone (3.6 mg/day) or zuclopenthixol (9.6 mg/day) (Nørbak-Emig et al., Reference Nørbak-Emig2017). If anything, the latter study suggested that higher D2/3 receptor occupancy was associated with an increase in frontal grey matter volume. Furthermore, data from another group of investigators showed that 8 weeks of treatment with low doses of either quetiapine (178.8 mg/day) or risperidone (1.4 mg/day) increased cortical thickness (Goghari et al., Reference Goghari2013). Collectively, these studies do not indicate that short-term and low-dose antipsychotic treatment is neurotoxic. In this regard, it is important to recognize that the dose of amisulpride used in the present study is lower than the doses typically required for chronic schizophrenia patients. In accordance with other studies in antipsychotic-naïve schizophrenia patients with similar DUI, e.g. (Xiao et al., Reference Xiao2015), we did not observe an association between a DUI and cortical measures. In contrast, longer duration of illness and longer treatment periods and/or higher antipsychotic doses have been suggested to induce deteriorating effects on brain tissue (Ho et al., Reference Ho2011). Due to multiple confounding comorbid factors associated with chronicity, interpretations of clinical studies in this field are generally difficult.
Strengths of the present study comprise the longitudinal design with inclusion of 56 initially antipsychotic-naïve schizophrenia patients exposed to 6 weeks of monotherapy with a relative specific dopamine D2/3 receptor antagonist as well as the investigation of three cortical structures (cortical thickness, surface area and mean curvature). Some limitations should be considered. First, the underlying cellular mechanisms behind the structural changes cannot be inferred from the current data. Second, despite our results of a higher mean curvature of the left hemisphere in patients, it is important to recognize that this association may be driven by group differences in current intelligence, and current intelligence should be taken into consideration when investigating cortical structures. The effect of specific cognitive deficits on individual cortical structures may be optimally addressed by the application of multivariate analyses in larger samples of antipsychotic-naïve schizophrenia patients. Third, as the mean curvature values obtained are unsigned, it cannot be determined whether the alterations in the curvature are occurring in the sulcus or gyrus. Finally, the potential long-term effects of dopamine D2/3 receptor blockade on cortical structures cannot be inferred from this 6-week observational study.
We conclude that schizophrenia is associated with subtle aberrations in cortical structures and that these changes appear clinically relevant. For schizophrenia patients, who have not been affected by factors of illness chronicity, mean cortical curvature holds promise as a sensitive supplement to detect complex structural abnormalities.
Supplementary material
The supplementary material for this article can be found at https://doi.org/10.1017/S0033291718001198
Acknowledgements
The authors wish to thank all patients and healthy controls, who participated in the study. They further wish to acknowledge research nurse Gitte Saltoft Andersen and research secretary Lisbeth Jensen. The authors are thankful for the assistance of medical student Olivia Nielsson for assisting the manual editing process and clinical trial coordinator Mikkel Erlang Sørensen for assisting with the design of illustrations.
Financial support
This work was supported by a Ph.D. grant from the Research Fund of the Mental Health Services – Capital Region of Denmark and by the Lundbeck Foundation (R13-A1349), (R25-A2701) and (R155-2013-16337).
Conflict of interest
Dr Ebdrup is part of the Advisory Board of Eli Lilly Denmark A/S, Janssen-Cilag and Takeda Pharmaceutical Company Ltd, and has received lecture fees from Bristol-Myers Squibb, Otsuka Pharma Scandinavia AB and Eli Lilly Company. The other authors declare no conflicts of interest.
Ethical standards
The authors assert that all procedures contributing the Pan European Collaboration Antipsychotic-Naïve Study (PECANS) comply with the Danish National Committee on Biomedical Research Ethics (H-D-2008-088) and the Danish Data Protection Agency (2008-41-2701) and with the Helsinki Declaration of 1975, as revised in 2008. PECANS was registered at Clinicaltrials.gov (NCT01154829).


