Introduction
Cystic echinococcosis (CE) is a widespread zoonotic disease listed amongst the most severe parasitic diseases of humans (WHO, 2015; FAO/WHO, 2014). CE is caused by the larval stage of the tapeworms belonging to the species complex Echinococcus granulosus sensu lato (s.l.). The tapeworms utilize two mammalian hosts to complete their lifecycle: a definitive host (most commonly canids) and an intermediate host (a wide range of herbivorous and omnivorous mammals) (Eckert et al. Reference Eckert2001; Moro and Schantz, Reference Moro and Schantz2009). The definitive host harbours the adult worm in the small intestine while the larval stage develops in intermediate hosts, causing CE. The intermediate hosts acquire the infection by the ingestion of eggs that have been shed into the environment with the feces of the definitive host. Humans can also become infected, either by direct contact with definitive hosts or by contaminated fruits, vegetables or drinking water (Possenti et al. Reference Possenti2016). As the general life-cycle relies on a predator–prey relationship, humans are considered aberrant hosts and usually do not play a role in the natural life-cycle of the parasite. Nevertheless, the disease is severe in intermediate hosts (including humans), while the infection in definitive hosts does not cause morbidity (Eckert et al. Reference Eckert2001; Eckert and Deplazes, Reference Eckert and Deplazes2004; Moro and Schantz, Reference Moro and Schantz2009).
The E. granulosus s.l. complex consists of mitochondrial genotypes G1, G3–G8, G10 and Echinococcus felidis (see Bowles et al. Reference Bowles, Blair and McManus1992, Reference Bowles, Blair and McManus1994; Lavikainen et al. Reference Lavikainen2003; Hüttner et al. Reference Hüttner2008; Kinkar et al. Reference Kinkar2017). Some of these genotypes are now regarded as distinct species: E. granulosus sensu stricto (s.s.; genotypes G1 and G3; Kinkar et al. Reference Kinkar2017), Echinococcus equinus (G4), Echinococcus ortleppi (G5) (Thompson and McManus, Reference Thompson and McManus2002), whereas the status of genotypes G6–G10 is under dispute (Moks et al. Reference Moks2008; Thompson, Reference Thompson2008; Saarma et al. Reference Saarma2009; Knapp et al. Reference Knapp2011, Reference Knapp2015; Lymbery et al. Reference Lymbery2015; Nakao et al. Reference Nakao, Lavikainen and Hoberg2015). A recent study by Yanagida et al. (Reference Yanagida2017) that is based on two nuclear loci suggested nuclear allele sharing between genotypic groups G6/G7 and G8/G10, whereas data from six nuclear loci suggests that G6/G7 and G8/G10 are two distinct species (Laurimäe et al., unpublished data). Although three genotypes were originally characterized within E. granulosus s.s. (G1–G3) (Bowles et al. Reference Bowles, Blair and McManus1992), G2 is now considered to be a microvariant of G3 (Kinkar et al. Reference Kinkar2017). Recently, phylogenetically highly divergent isolates were revealed that were difficult to assign to any of the classical E. granulosus s.l. genotypes: isolate Gomo was discovered in Ethiopia, which was tentatively retained in E. granulosus s.s. but its taxonomic status is not yet clear (Wassermann et al. Reference Wassermann2016), and another genotype (Gmon) was described from Mongolia, which belongs to the G6/G7 cluster, but was challenging to allocate to either genotype (Laurimäe et al. unpublished data).
Echinococcus granulosus s.s. (genotypes G1 and G3) is the most widespread species of the complex (Deplazes et al. Reference Deplazes2017) and also the most frequent causative agent of human CE worldwide (Alvarez Rojas et al. Reference Alvarez Rojas, Romig and Lightowlers2014). Rural livestock-raising areas are particularly affected while some of the main factors contributing to the persistence of the disease in these areas include the frequent illegal and home slaughtering of animals for food, feeding raw offal to dogs, low public awareness of the disease, large populations of stray dogs and poor hygiene conditions (Eckert et al. Reference Eckert2001; Torgerson and Budke, Reference Torgerson and Budke2003; Varcasia et al. Reference Varcasia2011; Possenti et al. Reference Possenti2016).
Genotypes G1 and G3 were first defined based on short fragments of the mitochondrial DNA (mtDNA) cox1 and nad1 genes (Bowles et al. Reference Bowles, Blair and McManus1992; Bowles and McManus, Reference Bowles and McManus1993). Genotype G3 was originally described from two buffalo samples originating from India (Bowles et al. Reference Bowles, Blair and McManus1992). After decades of research, G3 has now been identified from a significantly wider geographic range (Australia, North Africa, the Middle East, South America, Southern Europe and parts of Asia). While relatively few cases of G3 have been reported in South America, Australia and North Africa (M'rad et al. Reference M'rad2010; de la Rue et al. Reference de la Rue2011; Espinoza et al. Reference Espinoza2014; Alvarez Rojas et al. Reference Alvarez Rojas2016; Zait et al. Reference Zait2016), significantly higher prevalence is characteristic to Iran, Italy, Pakistan, Serbia and especially India (Capuano et al. Reference Capuano2006; Busi et al. Reference Busi2007; Pednekar et al. Reference Pednekar2009; Latif et al. Reference Latif2010; Sharbatkhori et al. Reference Sharbatkhori2011; Sharma et al. Reference Sharma2013a, Reference Sharmab; Debeljak et al. Reference Debeljak2016; Ehsan et al. Reference Ehsan2017). Genotype G1 is globally the most prevalent genotype, whereas G3 is generally less frequent (e.g. Varcasia et al. Reference Varcasia2007; Šnábel et al. Reference Šnábel2009; Nakao et al. Reference Nakao2010; Casulli et al. Reference Casulli2012; Adwan et al. Reference Adwan2013; Pezeshki et al. Reference Pezeshki2013; Alvarez Rojas et al. Reference Alvarez Rojas2017) but dominates in certain countries (e.g. India). The buffalo is no longer regarded as the only intermediate host for G3 as the genotype has now also been identified in sheep, cattle, goat, camel and pig, while dogs serve as definitive hosts (e.g. Maillard et al. Reference Maillard2009; Latif et al. Reference Latif2010; de la Rue et al. Reference de la Rue2011; Sharbatkhori et al. Reference Sharbatkhori2011; Calderini et al. Reference Calderini, Gabrielli and Cancrini2012). The transmission of G3 seems to occur primarily in a domestic lifecycle; however, a single case of an infected Nile Lechwe (Kobus megaceros) has been reported from the Zoological Garden of Rome (Busi et al. Reference Busi2007), indicating the capability of G3 to also infect wild ungulates. As reported from several geographic regions, the genotype is also infectious to humans (Busi et al. Reference Busi2007; M'rad et al. Reference M'rad2010; de la Rue et al. Reference de la Rue2011; Simsek et al. Reference Simsek, Kaplan and Ozercan2011; Sharma et al. Reference Sharma2013b; Rostami et al. Reference Rostami2015; Zait et al. Reference Zait2016).
The full extent of the distribution and host range of genotype G3 is likely to be much wider than described to date. Not only is data lacking from many parts of the world, the correct identification of this genotype has also been challenging. The relatively short mtDNA sequences commonly used so far (mostly the cox1 and nad1 genes) do not guarantee consistent assignment of isolates into genotypes G1 or G3 (e.g. Andresiuk et al. Reference Andresiuk2013; Romig et al. Reference Romig, Ebi and Wassermann2015). For a long time, the assignment has also been compromised by the former genotype G2, now regarded as a microvariant of G3 (Kinkar et al. Reference Kinkar2017). Thus, samples identified previously as G2 most likely belong to G3.
Although the former studies exploring the distribution and host range of G3 have been highly informative, the ambiguity in the definition of the genotype has hindered further research and thus the genetic diversity and phylogeographic patterns of G3 have remained largely unexplored. However, several recent publications on E. granulosus s.s. have outlined the advantages of using long sequences of mtDNA in the analysis, providing a reliable method to discriminate G1 and G3 from each other with confidence and yielding detailed insight into the genetic variability and phylogeography of genotype G1 (Kinkar et al. Reference Kinkar2016, Reference Kinkar2017, Reference Kinkar2018; Laurimäe et al. Reference Laurimäe2016).
The objectives of the current study were to investigate the genetic diversity and phylogeography of E. granulosus s.s. genotype G3 based on near-complete mtDNA sequences, covering most of the known distribution range and host spectra of the genotype. This information can provide valuable insight into the intragenotypic variation of G3, possible origin of the genotype and fill the gaps in our knowledge regarding the evolution of E. granulosus s.s. – the species within the E. granulosus s.l. complex most commonly associated with human infections.
Materials and methods
Parasite material
We sequenced a total of 39 E. granulosus s.s. G3 samples of which 27 were newly sequenced and 12 were from Kinkar et al. (Reference Kinkar2017) (Table S1). Note that ~240 additional basepairs (146 bp of the cox3 gene; 8 bp tRNA-His and 86 bp nad6) were sequenced for the 12 samples in Kinkar et al. (Reference Kinkar2017), totalling 11 675 bp. The samples were obtained during routine meat inspections or from hospital cases and were ethanol-preserved at −20 °C until further use. The origin and host species of the G3 samples are shown in Fig. 1 and Table 1 and Table S2. To the best of our knowledge, all human G3 samples used in the analysis were autochthonic cases of CE, except for a Finnish sample, which most likely originated from an Eastern European patient who resided in Finland.
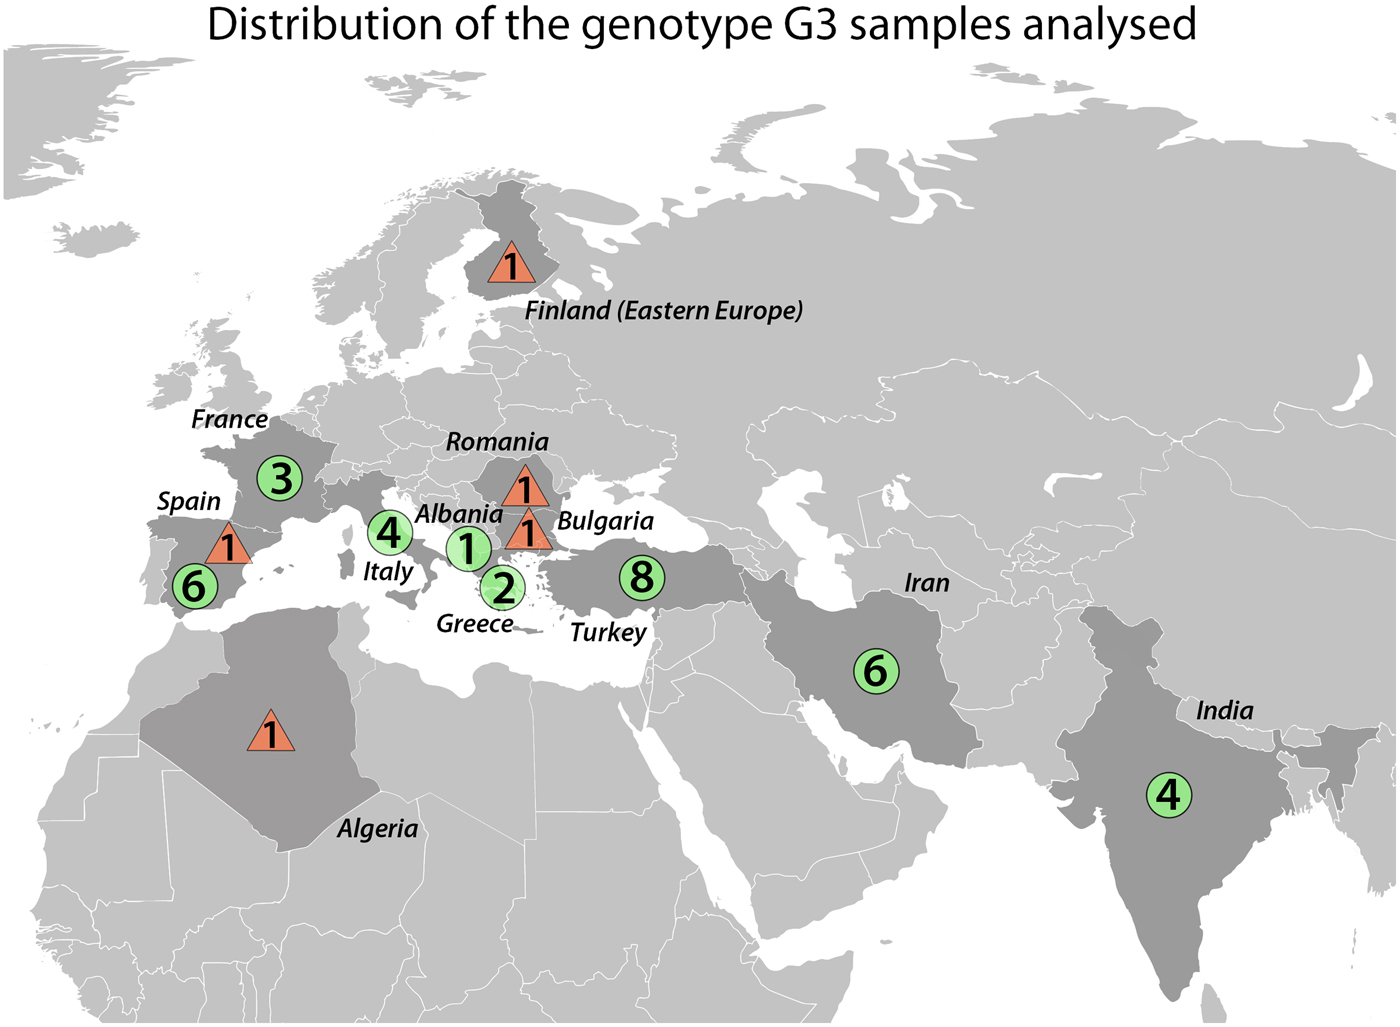
Fig. 1. Geographic locations of Echinococcus granulosus sensu stricto genotype G3 samples (n = 39) analysed in this study. Circles represent samples from livestock and triangles are samples of human origin.
Table 1. Data for the 39 Echinococcus granulosus sensu stricto G3 isolates analysed in this study
DNA extraction, PCR amplification, sequencing and assembly
The High Pure PCR Template Preparation Kit (Roche Diagnostics, Mannheim, Germany) was used to extract total genomic DNA from protoscoleces or cyst membranes. We used 12 primer pairs described in Kinkar et al. (Reference Kinkar2017) for PCR amplification. PCR reactions were carried out in a total volume of 20 µl, using 1 × BD Advantage-2 PCR buffer (BD Biosciences, Franklin Lakes, NJ, USA), 0.2 mm dNTP (Fermentas, Vilnius, Lithuania), 0.25 µ m of each primer, 1 U of Advantage-2 Polymerase mix (BD Biosciences) and 5–10 ng of purified genomic DNA. A touch-down protocol was used for PCR, as described in Kinkar et al. (Reference Kinkar2016). Of the amplified PCR products, 10 µl were examined on 1.2% agarose gel electrophoresis. The remaining 10 µl were purified with 1 U of FastAP Thermosensitive Alkaline Phosphatase and Exonuclease I (Thermo Fisher Scientific). The mixture was subsequently incubated at 37°C for 30 min and then heated 80°C for 15 min to inactivate the enzymes.
Sequencing was performed using the same primers as for the initial PCR amplification with BigDye Terminator v3.1 Cycle Sequencing Kit (Applied Biosystems, Foster City, CA, USA), following the manufacturer's protocols. Cycle parameters for sequencing were as described in Kinkar et al. (Reference Kinkar2016). Sequences were resolved on the ABI 3130xl sequencer (Applied Biosystems), their quality were assessed, then assembled and manually curated using the programs CodonCode v6.0.2 and BioEdit v7.2.5 (Hall, Reference Hall1999).
Phylogenetic analyses
We calculated phylogenetic networks for three sequence datasets. To assess the genetic distinction between G1 and G3, dataset A comprised 251 E. granulosus s.s. G1 and G3 sequences: in addition to the 39 G3 sequences in this study, 211 G1 sequences from Kinkar et al. (Reference Kinkar2018) (GenBank accession nos. MG672124–MG672293) and a single G1 sequence from Nakao et al. (Reference Nakao2013) (GenBank accession no. AB786664) were included. To analyse the intragenotypic variability and phylogeny of G3, dataset B represented samples belonging to genotype G3 only (n = 39). An additional dataset C included human samples of G1 (n = 41) and G3 (n = 5), of which the G1 sequences were also from Kinkar et al. (Reference Kinkar2018). Phylogenetic networks were calculated using Network v4.6.1.5 (Bandelt et al. Reference Bandelt, Forster and Rohl1999; http://www.fluxus-engineering.com, Fluxus Technology Ltd., 2004). Networks were constructed considering both indels and point mutations.
The Tamura–Nei nucleotide substitution model with gamma-distributed rate variation (TRN + G) (Tamura and Nei, Reference Tamura and Nei1993; Yang, Reference Yang1994) was determined as the best-fit model of sequence evolution using the program PartitionFinder 2.1.1 (Guindon et al. Reference Guindon2010; Lanfear et al. Reference Lanfear2012, Reference Lanfear2016). The Bayesian phylogenetic analysis for the G3 dataset was performed using the programs BEAST 1.8.4 and BEAUti v1.8.4 (Drummond et al. Reference Drummond2012). Exponential growth coalescent prior (Griffiths and Tavaré, Reference Griffiths and Tavaré1994) was chosen for the tree, and a strict molecular clock was assumed owing to the intraspecific nature of the data (Drummond and Bouckaert, Reference Drummond and Bouckaert2015). The posterior distribution of parameters was estimated by Markov Chain Monte Carlo (MCMC) sampling. MCMC chains were run for 10 million states, sampled every 1000 states with 10% burn-in. Log files were analysed using the program Tracer v1.6 (Rambaut et al. Reference Rambaut2014). Three independent runs were combined using LogCombiner 1.8.4 (Drummond et al. Reference Drummond2012). The tree was produced using TreeAnnotator v1.8.4 and displayed in FigTree v.1.4.3 (Rambaut, Reference Rambaut2014).
Population indices
The population diversity indices (number of haplotypes, haplotype diversity and nucleotide diversity) were calculated using the program DnaSP v5.10.01 (Librado and Rozas, Reference Librado and Rozas2009). Neutrality indices Tajima's D (Tajima, Reference Tajima1989) and Fu's Fs (Fu, Reference Fu1997) were calculated using the Arlequin 3.5.2.2 software package (Excoffier et al. Reference Excoffier, Laval and Schneider2005).
Bayesian phylogeographic analysis
We used the Bayesian discrete phylogeographic approach to analyse the phylogeographic diffusion patterns of genotype G3, using a Bayesian factor (BF) test to identify the most parsimonious description of the diffusion process (Lemey et al. Reference Lemey2009). The xml file generated in BEAUti for the Bayesian phylogenetic analysis was edited according to the ’Discrete phylogeographic analysis’ tutorial available on the Beast website (http://beast.bio.ed.ac.uk/tutorials – last access June 2017). The analysis was performed in BEAST 1.8.4 (Drummond et al. Reference Drummond2012) using the BEAGLE library (Ayres et al. Reference Ayres2012). MCMC chains were run for 30 million states, sampled every 3000 states with 10% burn-in. The ESS (effective sampling size) of estimates was assessed using Tracer v1.6 (Rambaut et al. Reference Rambaut2014). The tree was produced using TreeAnnotator v1.8.4 and displayed in FigTree v.1.4.3 (Rambaut, Reference Rambaut2014). The program SpreaD3 v0.9.6 (Bielejec et al. Reference Bielejec2016) was used to visualize the output and to calculate the Bayes Factor supports. Three independent runs were conducted and geographic links that yielded an average value of BF > 10 were displayed.
Results
Near-complete mitogenome sequences for 39 E. granulosus s.s. G3 samples were successfully sequenced and aligned, resulting in an alignment of 11 675 bp. All G3 sequences were deposited in the GenBank database under accession nos. MG682511–MG682544 (Table S2).
The phylogenetic network of E. granulosus s.s.
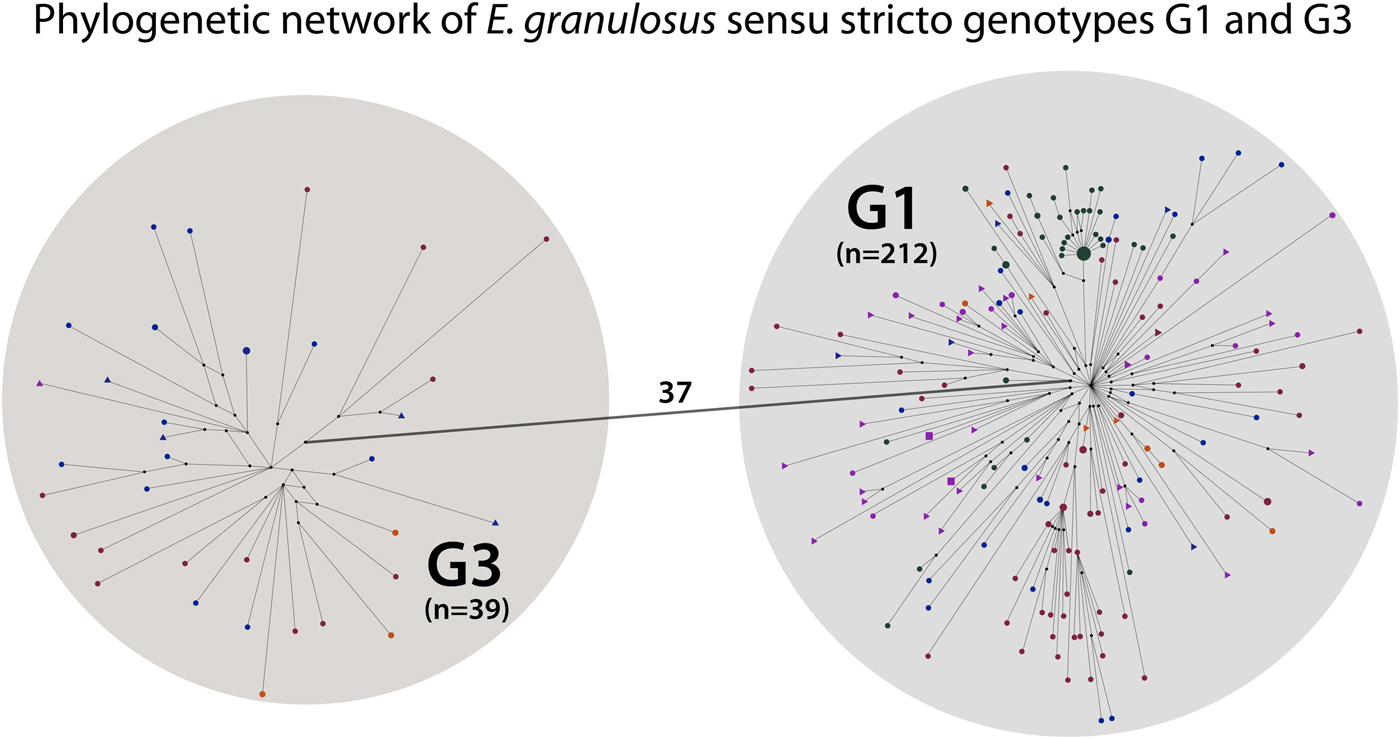
The 251 G1 and G3 sequences were divided into two separate haplogroups, separated by 37 mutations (Fig. 2). Out of the 212 G1 samples, 145 contained the originally described G1 sequence sensu Bowles et al. (1992; 366 bp of the cox1 gene), and 12 out of the 39 G3 samples contained the originally described G3 sequence in Bowles et al. (Reference Bowles, Blair and McManus1992). The phylogenetic network demonstrated that G1 and G3 are clearly distinct genotype groups in the context of mitochondrial data, as no sequences were positioned between G1 and G3. For the phylogenetic network of G1 and G3 human samples (n = 46), see Fig. S1.

Fig. 2. Phylogenetic network of Echinococcus granulosus sensu stricto G1 and G3 samples. Small black circles are median vectors (i.e. hypothetical haplotypes: haplotypes not sampled or extinct). One haplogroup (n = 212) corresponds to the mitochondrial genotype G1 and the other (n = 39) to G3. The small circles and triangles in the haplogroups represent haplotypes. The number on the line connecting the haplogroups indicates the mutational steps between genotypes G1 and G3.
Based on our global datasets of G1 and G3 (n = 251), the prevalence of genotype G3 was 15.6% (39 samples out of a total of 250 E. granulosus s.s. samples, excluding the G1 sample obtained from GenBank) while the prevalence of G1 was 84.4%. We also assessed the ratio of G1 and G3 in the three most numerous host species: sheep, cattle and human. Genotype G3 was identified in 17.9% of the E. granulosus s.s. sheep samples (21/117), 11.1% of the human samples (5/45) and 7.6% of the cattle samples (5/66), and the corresponding values for G1 were 82.1, 88.9 and 92.4%.
Phylogeny of genotype G3
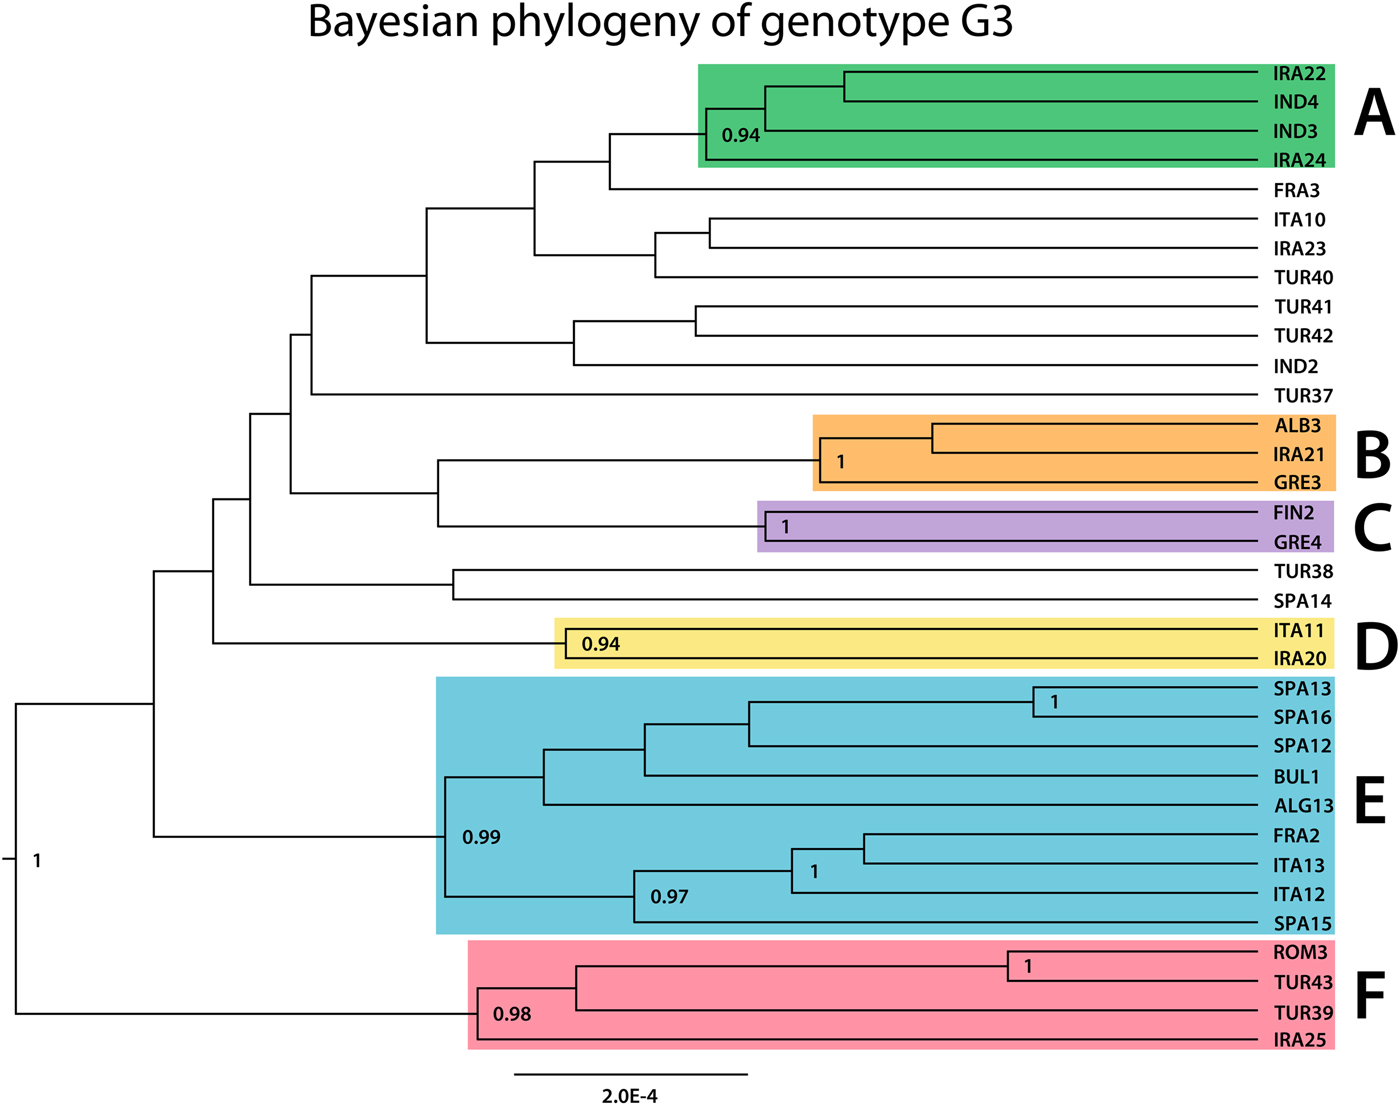
The phylogeny of G3 revealed multiple clades with varying support values, of which six were well resolved and received high posterior probability values (0.9 or more; Fig. 3). Very high genetic variation is characteristic to G3: the 39 samples represented 34 distinct haplotypes (Fig. 4). Among the 34 haplotypes, 30 were represented by a single sample, three haplotypes included two samples (TUR37, IND4 and FRA2) and SPA12 included three samples. The maximum number of mutational steps between different G3 haplotypes was 30 (between IRA20 and IRA25). Six haplogroups (monophyletic groups) which corresponded to the well-supported clusters in the Bayesian phylogenetic tree (Fig. 3) could be distinguished (named A–F, correspondingly) (Fig. 4).

Fig. 3. Bayesian phylogenetic tree inferred from 39 Echinococcus granulosus sensu stricto G3 samples. Posterior probability values >0.90 are indicated at the nodes. Seven clades depicted in green, orange, purple, yellow, blue and red (named A–F, respectively), illustrate clades that received the posterior probability value >0.90.
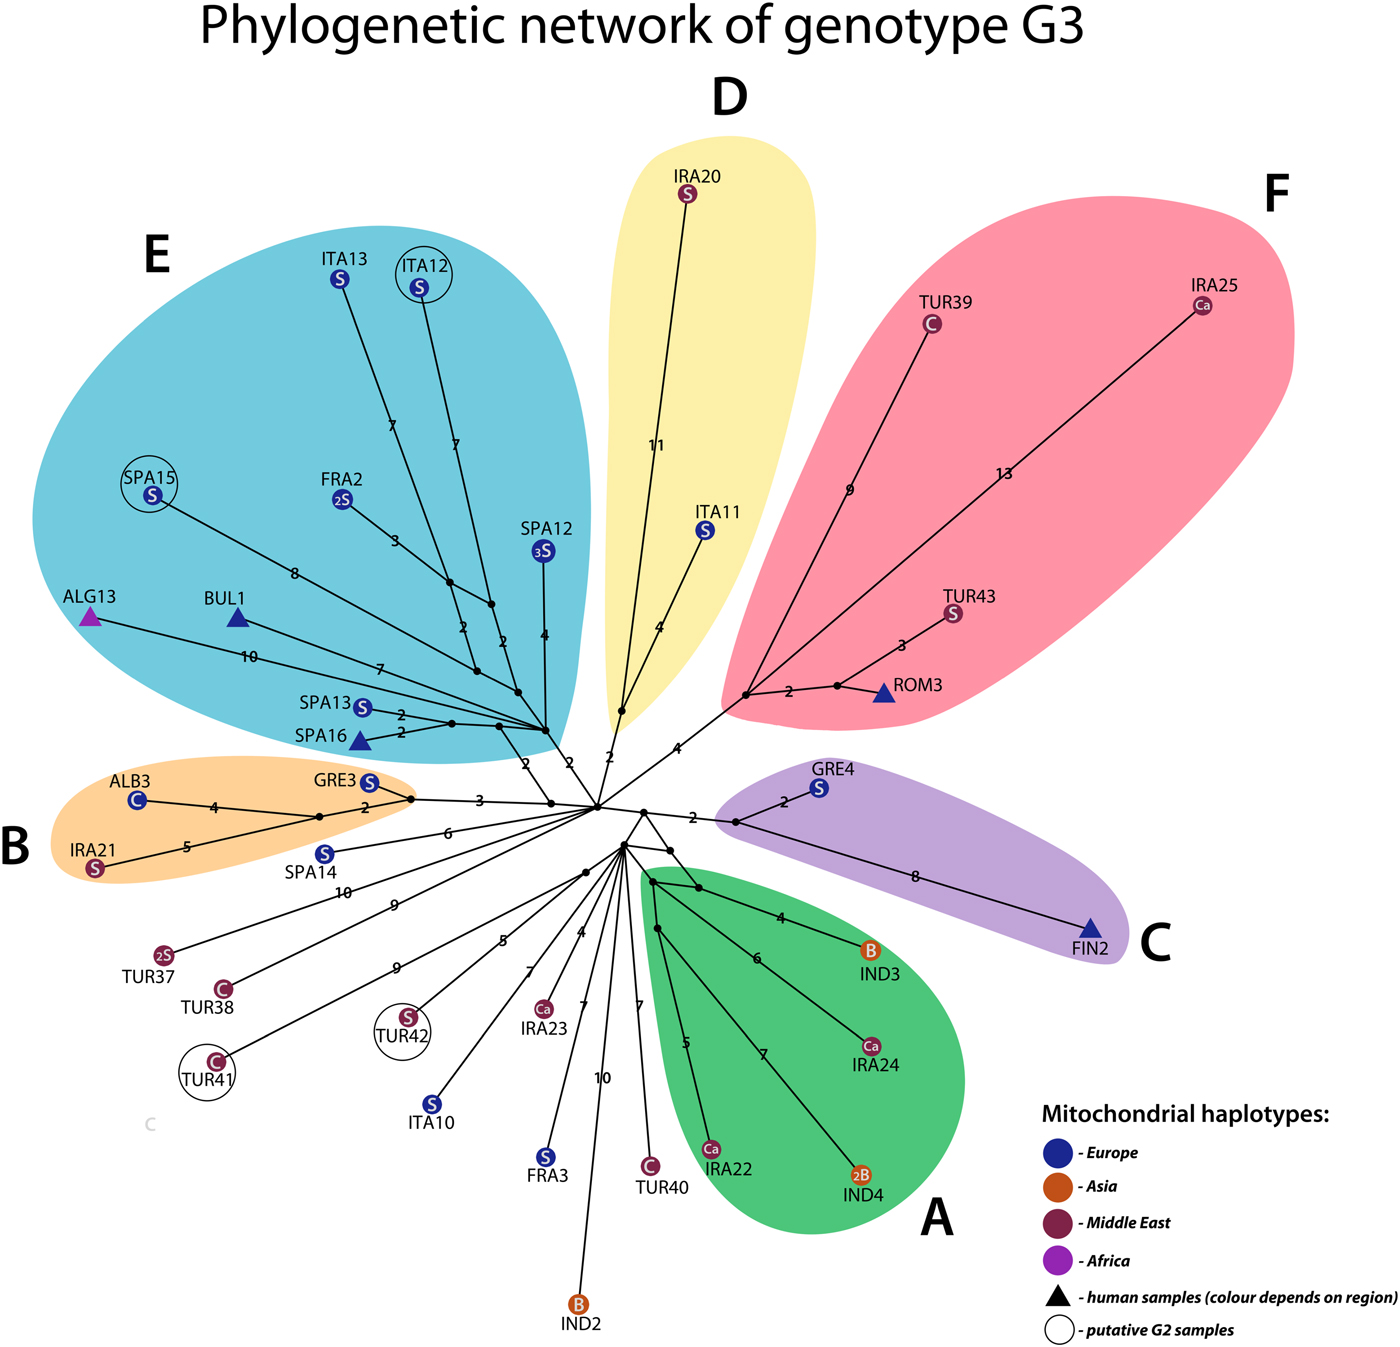
Fig. 4. Phylogenetic network of Echinococcus granulosus sensu stricto G3 samples (n = 39). Circles represent haplotypes obtained from livestock, triangles represent haplotypes of human origin. Haplotype colours represent different geographical regions: purple – Africa, orange – Asia, blue – Europe, dark red – the Middle East (note that colours indicated on the right corner of the figure refer to geographic locations of haplotypes, not haplogroups). Haplotype names represent their geographical origin: ALB – Albania, ALG – Algeria, BUL – Bulgaria, FIN – Finland (patient from Eastern Europe), FRA – France, GRE – Greece, IND – India, IRA – Iran, ITA – Italy, ROM – Romania, SPA – Spain, TUR – Turkey. Host species are indicated with letters inside the haplotypes (Ca – Camel, C – cattle, S – sheep, H – human, B – buffalo). The small number inside haplotypes indicates the frequency of the haplotype. Numbers on the lines represent the number of mutations (single mutations are not marked with a number). Circled haplotypes are putative G2 samples.
Samples of various geographic regions clustered together in the six haplogroups (Fig. 4). In two monophyletic clusters (D and B), Iranian samples grouped together with European samples (IRA20, ITA11 and IRA21, ALB3, GRE3) and in haplogroup F Iranian, Turkish and European samples clustered together (IRA25, TUR39, TUR43 and ROM3). Samples of Iranian and Indian origin comprised haplogroup A (IND3, IND4, IRA24 and IRA22). While the majority of group E was represented by samples of European origin, an Algerian sample ALG13 also clustered into the haplogroup. Four samples (ITA12, SPA15, TUR41 and TUR42) corresponded to genotype G2 according to the 366 bp of cox1 in Bowles et al. (Reference Bowles, Blair and McManus1992) and were not monophyletic.
The majority of the monophyletic clusters included samples from different host species, except for group D which was composed of two sheep samples. The three buffalo haplotypes in this study (IND3, IND4 and IND2) were most closely related to samples from camels (IRA24, IRA22 and IRA23) (see also haplogroup A) while in group F, a relatively divergent camel sample (IRA25) clustered together with samples from cattle (TUR39), sheep (TUR43) and human (ROM3). In haplogroups E and C, human samples of European (FIN2, BUL1 and SPA16) and Algerian (ALG13) origin, clustered together with European sheep samples and in group B, two sheep samples (GRE3 and IRA21) grouped together with a sample from cattle (ALB3).
Diversity and neutrality indices
The overall haplotype diversity index (H d) for genotype G3 was 0.992 (s.d. ± 0.008), while nucleotide diversity (π) was 0.00143 (s.d. ± 0.00007). Neutrality indices Tajima's D and Fu's F s were negative and statistically significant (D = −2.51, P < 0.000001 and F s = −13.54, P < 0.01).
Bayesian phylogeographic analysis
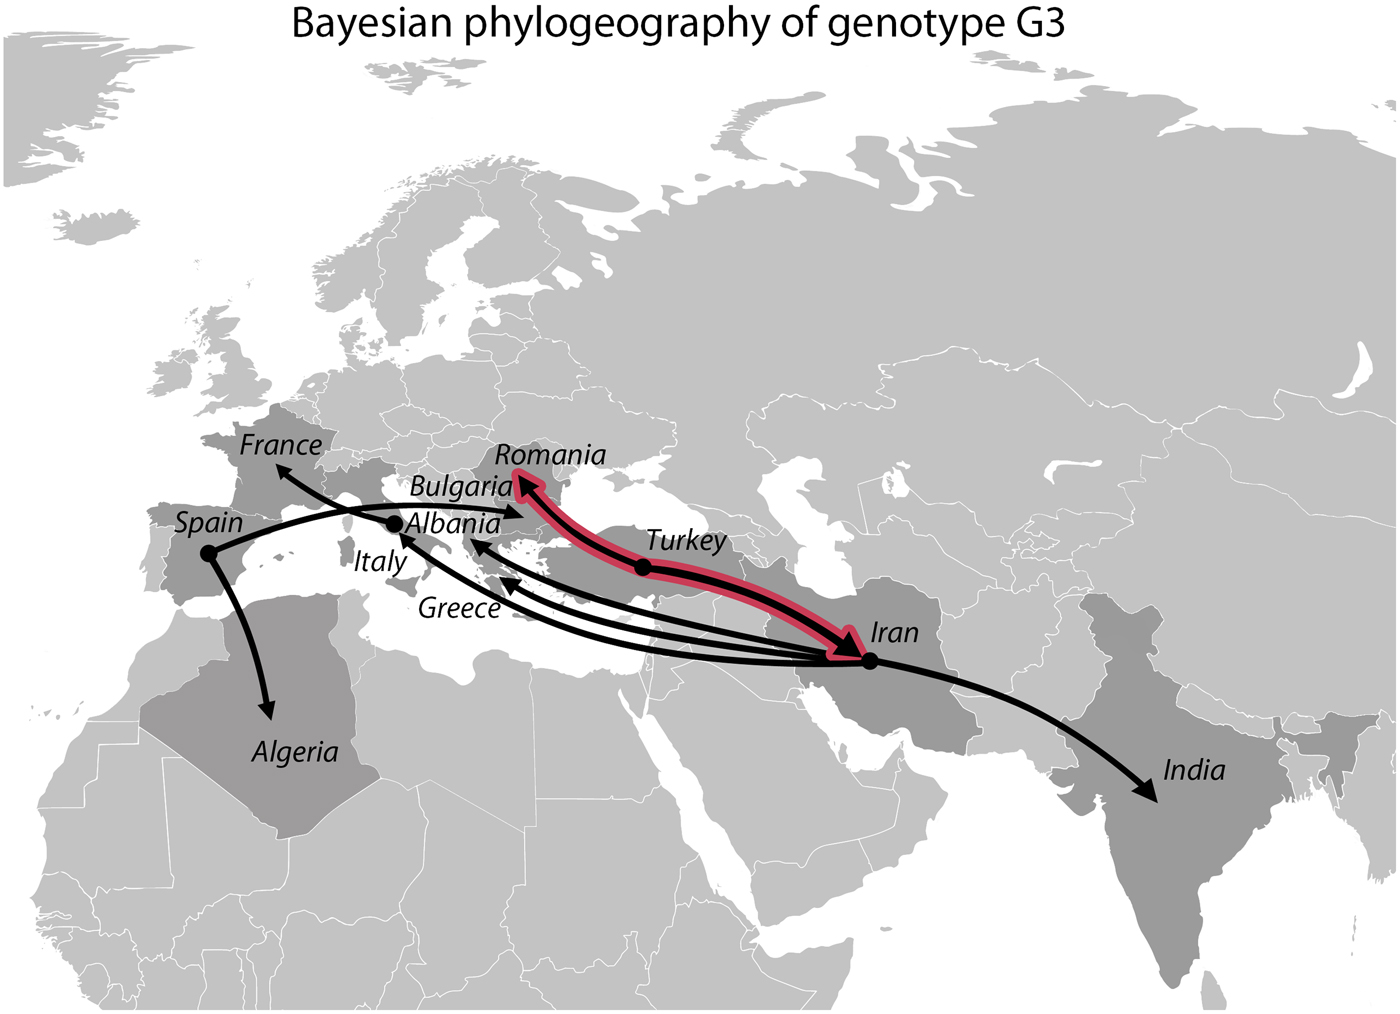
The Bayesian phylogeographic analysis yielded nine well-supported diffusion routes (BF > 10), of which two received the BF value above 100 (Fig. 5). These two strongly supported routes both originated from Turkey, indicating a migration towards Romania and Iran. Iran was the ancestral location to India, Albania, Greece and Italy while Spain was ancestral to Algeria and Bulgaria (BF > 10). A well-supported diffusion route was also identified between Italy and France (BF > 10).

Fig. 5. Well-supported diffusion routes inferred from the Bayesian phylogeographic analysis based on 39 Echinococcus granulosus sensu stricto genotype G3 samples. Black lines represent significant links (BF > 10), whereas black lines with red outlines represent highly significant links (BF > 100).
Discussion
The results of the present study demonstrated very high genetic variation within genotype G3 (Fig. 4): the 39 G3 samples divided into 34 haplotypes. The values of haplotype diversity (H d = 0.992) and nucleotide diversity (π = 0.00143) for G3 were similar to those previously demonstrated for G1 (H d = 0.994; π = 0.00133) in Kinkar et al. (Reference Kinkar2018) using similar mtDNA sequence length. It would appear that while G3 is globally significantly less prevalent than G1, the genetic diversity is equally high for both genotypes.
Several well-supported clusters on the phylogenetic tree comprised samples from various locations (e.g. the Middle Eastern and Southern European samples in groups B, D and F) (Figs 3 and 4). Although one larger haplogroup (E) comprised samples of mostly European origin, the cluster also included a sample from Algeria, indicating that samples of rather diverse geographic regions were often relatively closely related. Similar results have also been described for genotype G1 (Kinkar et al. Reference Kinkar2016, Reference Kinkar2018; Laurimäe et al. Reference Laurimäe2016), for which samples of distant areas frequently clustered together. As proposed for G1 (Kinkar et al. Reference Kinkar2016, Reference Kinkar2018; Laurimäe et al. Reference Laurimäe2016), the phylogeographic patterns for G3 are most likely influenced by large-scale livestock diffusion and trade that has aided the dispersal of the parasite over distant geographic areas. Significant negative values of neutrality indices Tajima's D (−2.51) and Fu's F s (−13.54) suggest rapid demographic expansion, most likely following the recurrent dispersal of the parasite through animal transport. In addition to Kinkar et al. (Reference Kinkar2016, Reference Kinkar2018), Laurimäe et al. (Reference Laurimäe2016), which specifically focused on the genetic diversity of genotype G1, similar conclusions reflecting populations under expansion have been reported for E. granulosus s.s. in previous studies (e.g. Nakao et al. Reference Nakao2010; Casulli et al. Reference Casulli2012; Yanagida et al. Reference Yanagida2012; Hassan et al. Reference Hassan2017).
The Bayesian phylogeographic analysis revealed two well-supported diffusion routes originating from Turkey, indicating a possible migration of genotype G3 from Turkey to Romania and Iran. A larger expansion originating from Iran was also revealed, from where the parasite was further distributed towards India and Southern Europe (Albania, Greece and Italy) (Fig. 5). It is interesting to note that Iran, India and Italy are also among the few countries worldwide in which G3 has been found to be more prevalent than in others (Capuano et al. Reference Capuano2006; Busi et al. Reference Busi2007; Pednekar et al. Reference Pednekar2009; Sharbatkhori et al. Reference Sharbatkhori2011; Sharma et al. Reference Sharma2013a; Reference Sharmab; Sharbatkhori et al. Reference Sharbatkhori2016). This might suggest that large populations of genotype G3 have been transported via domesticated animals from Iran to several other countries. Recent results of a similar analysis for genotype G1 (Kinkar et al. Reference Kinkar2018) indicated Turkey as a possible ancestral location for G1 and the origin of a large-scale expansion of this genotype. Taken together, the results demonstrate that the potential origin of the G1 and G3 is the Middle East, which is one of the earliest centres of livestock domestication for cattle, sheep, pigs and goats (Bruford et al. Reference Bruford, Bradley and Luikart2003; Zeder, Reference Zeder2008; Chessa et al. Reference Chessa2009; Lv et al. Reference Lv2015; Rannamäe et al. Reference Rannamäe2016). The origin of E. granulosus s.s. in the Middle East has been suggested before (e.g. Nakao et al. Reference Nakao2010; Casulli et al. Reference Casulli2012; Yanagida et al. Reference Yanagida2012; Kinkar et al. Reference Kinkar2016, Reference Kinkar2018; Hassan et al. Reference Hassan2017), but had not been explored separately for genotype G3 so far. The significant diffusion routes between several European countries and Algeria most likely reflect the complex trade circuits of animal transport. Although our sampling covers the majority of the known G3 distribution range, it should be noted that the results are based on a relatively limited number of samples, and therefore might not reflect the entire migration history of the genotype. Thus, further research is required to elucidate the phylogeographic history of the parasite.
To evaluate whether shorter sequences are also suitable to investigate the phylogeographic history of the parasite, we carried out the Bayesian phylogeographic analysis using the full cox1 gene (1674 bp). We conducted three independent runs which yielded inconsistent results with low Bayes Factor values. Thus, no significant diffusion routes could be identified based on the cox1 gene, highlighting that significantly longer sequences are required to investigate the phylogeographic history of the parasite using this method.
Although our results point to the Middle East as the origin of G3, India could also be of importance in terms of the expansion of G3. It would be of interest to see if future studies with more samples from India would reveal well-supported diffusion routes originating from there. This scenario is plausible, as it can be speculated that the spread of G3 could be connected to the domestication and subsequent spread of water buffaloes. Two subspecies of the water buffalo, the river and the swamp buffalo, were either both domesticated in the Indian subcontinent (Kierstein et al. Reference Kierstein2004) or in the Indus valley region and China, respectively (Kumar et al. Reference Kumar2007; Yindee et al. Reference Yindee2010). Although G3 is not regarded as a buffalo-specific genotype and both G1 and G3 seem to be well adapted to buffalos (Capuano et al. Reference Capuano2006), the importance of India is highlighted by the fact that India has the highest global prevalence of genotype G3 (Sharma et al. Reference Sharma2013a). Another clue that the distribution of G3 could be linked to the domestication history of buffaloes, lies in the fact that the high prevalence of G3 coincides with the high prevalence of buffaloes in several regions (Italy, India, Iran and Pakistan) (Capuano et al. Reference Capuano2006; Latif et al. Reference Latif2010; Sharbatkhori et al. Reference Sharbatkhori2011; Sharma et al. Reference Sharma2013a). India is the first country in the world for the number of buffaloes, followed by China and Pakistan (Borghese, Reference Borghese2005). Although the abundance of buffaloes is significantly lower in Europe and the Middle East, the highest numbers of buffaloes in these regions can be found in Azerbaijan, Egypt, Italy and Iran (Borghese, Reference Borghese2005). Unfortunately, data on the prevalence of G3 is lacking from several of these countries, which would be of great importance to further evaluate this correlation. The hypothesis that India has played a more important role in the dispersal of G3 than revealed in this study remains to be tested in the future.
The results of this study have also further strengthened the confidence that G1 and G3 are clearly distinct mitochondrial genotypes while G2 is not a separate genotype but belongs to G3. Although this has been previously demonstrated by Kinkar et al. (Reference Kinkar2017, Reference Kinkar2018), we included additional G3 samples in the present study to assess whether any haplotypes would position between the two genotypes. Based on the significantly larger dataset than before, G1 and G3 were separated by 37 mutations while no haplotypes positioned in between (Fig. 2). In addition to the putative G2 samples published by Kinkar et al. (Reference Kinkar2017), an additional sample containing the originally described G2 sequence sensu Bowles et al. (Reference Bowles, Blair and McManus1992) was analysed in this study. This haplotype also clustered together with the G3 samples, providing further evidence that G2 is not a separate genotype but a microvariant of G3.
Due to the lack of fossil records to calibrate molecular clocks, the estimation of the divergence time of G1 and G3 remains speculative. An attempt to calibrate the molecular clock for taeniids has been made based on chronologically distant events such as The Great American Biotic Interchange around 3 million years ago (Knapp et al. Reference Knapp2011). However, deep calibrations often yield erroneous results (Ho et al. Reference Ho2008). One possible explanation to the emergence of the two mitochondrial genotypes could be linked to the Last Glacial Maximum (LGM) (26.5–19 kya), as it has been widely accepted that climatic fluctuations during this period have shaped the distribution, genetic structure and diversity of the present-day species (Hewitt, Reference Hewitt1999; Hofreiter and Stewart, Reference Hofreiter and Stewart2009; Davison et al. Reference Davison2011). As continental ice sheets extended into a large part of the temperate zone of the Northern hemisphere, the survival of most organisms were dependent on more hospitable southern refugia (Hewitt, Reference Hewitt1999), but also more northern refuge areas, such as the Carpathian Mountains (Kotlík et al. Reference Kotlík2006; Saarma et al. Reference Saarma2007; Schmitt and Varga, Reference Schmitt and Varga2012). For numerous species, the isolation of populations in multiple refugia has resulted in the genetic divergence of mitochondrial lineages, still distinguishable in their mitogenome after post-glacial migrations (e.g. Taberlet and Bouvet, Reference Taberlet and Bouvet1994; Santucci et al. Reference Santucci, Emerson and Hewitt1998; Korsten et al. Reference Korsten2009; McDevitt et al. Reference McDevitt2012; Keis et al. Reference Keis2013; Anijalg et al. Reference Anijalg2018). Before E. granulosus s.s. became largely adapted to domestic hosts, it most probably circulated in a strictly sylvatic lifecycle and several mitochondrial groups of E. granulosus s.s. could have emerged due to separate glacial refugia of the host species. Subsequently, two of these lineages (i.e. ancestors of the present-day G1 and G3) could have given rise to the present E. granulosus s.s. populations. Although the present-day mitochondrial lineages of several other species are geographically restricted due to post-glacial migration barriers (e.g. Taberlet and Bouvet, Reference Taberlet and Bouvet1994; Hewitt, Reference Hewitt1999; Korsten et al. Reference Korsten2009; Davison et al. Reference Davison2011; Anijalg et al. Reference Anijalg2018), obligatory parasites infecting domestic animals have no such barriers due to the trade of host animals between different countries, resulting in the lack of geographic differentiation of the mitochondrial lineages, as also observed for G3 in the present study.
Our results are in line with several earlier studies from various locations demonstrating that G3 is significantly less prevalent worldwide than G1 (e.g. Breyer et al. Reference Breyer2004; Bart et al. Reference Bart2006; Nakao et al. Reference Nakao2010; de la Rue et al. Reference de la Rue2011; Casulli et al. Reference Casulli2012; Mitrea et al. Reference Mitrea2014; Nikmanesh et al. Reference Nikmanesh2014). According to our combined E. granulosus s.s. dataset, the prevalence of genotype G3 was 15.6% while all other E. granulosus s.s. samples were designated as G1; however, this might not reflect the global prevalence of G3 precisely as some regions were underrepresented. While G3 is significantly less prevalent worldwide than G1, it is challenging to propose possible scenarios that could have led to this contrast. Assuming that G1 and G3 did indeed diverge during the LGM, it is possible that the refugium of G1 could have been significantly larger than that of G3, which could be reflected in the higher global prevalence of G1 even presently. Alternatively, G3 could have been more adapted to fewer host species initially.
The mitochondrial DNA sequences used in the present study offer several benefits over nuclear DNA in phylogeographical analyses. One of the main advantages is that mitochondrial DNA is present in multiple copies per cell and is therefore of high diagnostic value, particularly when samples are degraded. In addition, the mtDNA has a high mutation rate and undergoes little or no recombination (i.e. mutations accumulate progressively; see also Saarma et al. Reference Saarma2009). However, the evolutionary history of the mtDNA lineage may differ from that of nuclear DNA, which does undergo recombination – although genotypes G1 and G3 represent distinct mitochondrial lineages, they are not separated by nuclear data (see Kinkar et al. Reference Kinkar2017). Thus, although the mtDNA represents an invaluable marker for phylogeographic analyses, a complete understanding of the historical processes shaping the phylogeographical patterns of E. granulosus s.s. could be revealed using the combination of nuclear and mitochondrial data in the future.
To conclude, this is the first study to explore the genetic diversity and phylogeographic patterns of E. granulosus s.s. genotype G3. Near-complete mitogenome sequences for G3 samples were analysed, representing the majority of the known G3 geographic distribution. We demonstrated that while G3 is significantly less prevalent worldwide than G1, the genetic diversity of both of the genotypes is high and that the distribution has most likely been shaped by livestock trade and diffusion. We have also provided additional compelling evidence that G1 and G3 are indeed two separate mitochondrial genotypes.
Supplementary material
The supplementary material for this article can be found at https://doi.org/10.1017/S0031182018000549
Acknowledgement
We would like to thank Antti Lavikainen (University of Helsinki) for his generous help.
Financial support
This work was supported by institutional research funding (IUT20–32) from the Estonian Ministry of Education and Research; Estonian Doctoral School of Ecology and Environmental Sciences; European Community's Seventh Framework Programme under the grant agreement 602051, Project HERACLES (http://www.Heracles-fp7.eu/).
Conflicts of interest
None.
Ethical standards
Not applicable.