


I. INTRODUCTION
Copper is a metal of relevance for a wide range of applications, from medicine to roofing (Delangle and Mintz, Reference Delangle and Mintz2012; Hedberg et al., Reference Hedberg, Goidanich, Herting and Odnevall Wallinder2015; Dalecki et al., Reference Dalecki, Crawford and Wolschendorf2017). In many cases, it is important to understand the chemical environment around the copper atoms, and the oxidation state in materials and during processes. Of interest to the authors is the use of copper in marine anti-biofouling. Conventional marine antifouling coatings are loaded with copper that is slowly released and because of the inherent biocidal activity of copper prevents fouling of the surface by marine organisms (Lifset et al., Reference Lifset, Eckelman, Harper, Hausfather and Urbina2012; Chen et al., Reference Chen, Maki, Rittschof and Teo2013). Unfortunately, the released copper accumulates in marinas and harbours with detrimental effects on the environment (Kiaune and Singhasemanon, Reference Kiaune and Singhasemanon2011).
We are researching an alternative approach to use copper-binding polymer ligands to capture copper present in the sea and release it upon a trigger, creating a cyclic flux of copper across the coating–water interface to prevent fouling, without any net addition of copper to the environment (Lindén et al., Reference Lindén, Larsson, Coad, Skinner and Nydén2014, Reference Lindén, Larsson, Kaur, Skinner, Miklavcic, Nann, Kempson and Nydén2015). We demonstrated that nanothin coatings of glutaraldehyde (GA)-cross-linked polyethyleneimine (PEI) can effectively and selectively accumulate copper from real and artificial seawater and that the copper binding is effective even when polysaccharides adsorb on the surface (Kaur et al., Reference Kaur, Kempson, Lindén, Larsson and Nydén2017).
In the development of these coatings, information on the oxidation state of copper in the coatings has been important and synchrotron X-ray Absorption Near Edge Spectroscopy (XANES) has been used to investigate this (Lindén et al., Reference Lindén, Larsson, Kaur, Skinner, Miklavcic, Nann, Kempson and Nydén2015; Kaur et al., Reference Kaur, Kempson, Lindén, Larsson and Nydén2017). The polymer systems and marine applications are highly complex and as such it is difficult to predict how Cu can be associated. Consequently, we have pursued collection of a broad range of XANES spectra to consider how the local Cu binding environment may be described and to reveal spectral features identifying subtle differences between conditions. The investigations of nanometre-thin coatings and a wide range of standards using XANES have provided us with a valuable source of experimental data from copper association in thin-coatings/films, polymers, organic ligands, and inorganic species. Here we present many of these spectra as a resource for research into Cu association studies with XANES.
II. EXPERIMENTAL
A. Chemicals
Copper(II) oxide (CuO), copper(I) oxide (Cu2O), EDTA tetrapotassium salt, ethylenediamine, ammonia solution, copper(II) nitrate trihydrate [Cu(NO3)2•3H2O], copper(I) chloride (CuCl), copper(II) chloride (CuCl2), branched PEI (50 wt% in H2O, Mn ~ 60 000 and MW ~ 750 000), GA (25 wt% in H2O), dimethyl sulfoxide (DMSO), and microcrystalline cellulose (MCC) (powder, 20 µm) were purchased from Sigma-Aldrich. Copper(II) sulphate pentahydrate (CuSO4•5H2O) was purchased from Chem-Supply Pty Ltd (Gillman, Australia). Sea Salts from Sigma-Aldrich (Castle Hill, Australia) were used to prepare artificial seawater at 38 g l−1. Used water was from a Milli-Q® (MQ) Advantage A10® water purification system and had a resistivity of 18.2 MΩ cm−1.
B. Sample preparation
Nanothin coatings of GA–PEI were prepared on 20 µm thick 1 × 1 cm2 fused silica Corning 7980 of UV grade substrates (Valley Design Corp.), using previously described spin-coating protocol (Lindén et al., Reference Lindén, Larsson, Coad, Skinner and Nydén2014).
Nanoparticles of cross-linked GA–PEI were prepared as follows: a solution of 1 wt.% PEI in MQ water was mixed with an equal volume of GA (1.7, 0.86, 0.43, or 0.21 wt.%) in MQ water. The GA concentrations corresponding with 2:1, 1:1, 1:2, and 1:4 ratios between cross-linking functionalities of the GA and primary and secondary nitrogen of the PEI. The mixtures were treated in an ultrasonication bath (Soniclean, Australia) for 2 h, followed by stirring with a magnetic rod for 1 day. The dispersions were dialysed in 12 kDA MWCO tubing (Sigma Aldrich) for 2 days in 5 l of MQ water, replacing the water two times per day. Finally, a fraction of each solution was dried and the concentration of nanoparticles calculated from the dry weight. The nanoparticles were characterised with dynamic light scattering (DLS), zeta potential analysis, atomic force microscopy (AFM), UV–Vis, and Fourier Transform Infrared (FTIR) spectroscopy. The copper binding of the particles was investigated in MQ water and artificial seawater using UV–Vis spectroscopy and X-ray photoelectron spectroscopy (XPS), where for XPS films of the nanoparticles were prepared on silicon wafers using a spin-coating protocol (Lindén et al., Reference Lindén, Larsson, Coad, Skinner and Nydén2014). Fully cross-linked nanoparticles were used in the analyses.
For ligands and nanoparticles in solution, copper(II) sulphate and ligands were mixed in MQ water, so that the molar excess of ligand to copper was 20× and 10× for ligands with one or more coordinating groups, respectively. For polymers, the repeating unit was considered as one ligand. This ensured that a large majority of the copper was complexed to ligands. Coatings were loaded with copper by submersion in MQ water or artificial seawater containing 200 ppb copper, from copper(II) sulphate. Submersion time was chosen to achieve close-to equilibrium saturation (Lindén et al., Reference Lindén, Larsson, Kaur, Skinner, Miklavcic, Nann, Kempson and Nydén2015). Following the submersion excess water was removed by gently touching the edge against a Kimtech wipe.
C. XANES
XANES was conducted at the X-ray Absorption Beamline at the Australian Synchrotron. Samples were enclosed in a perspex mount and sealed with Kapton foil. Powder samples were prepared by mixing the analyte with MCC (Sigma Aldrich) using an agate pestle and mortar to a copper concentration of about 500 ppm. Copper(I) complexes were extracted from the storage containers, mixed with MCC and sealed for analysis inside a glove box under argon atmosphere. Liquid samples with copper concentration of about 70–1000 ppm were prepared by injecting the solution through the Kapton foil using a syringe and subsequently sealing the hole. Film samples were attached to the perplex mount using Kapton foil. All samples were plunge frozen in liquid nitrogen before being introduced to the analysis chamber and analysed at <10 K. No DMSO was used in solutions other than those explicitly stated. XANES was performed over the Cu-K edge (8979 eV) with the pre-edge region acquired in 10 eV steps before using 0.25 eV steps from 8975 to 9012.5 eV followed by 0.06 steps in K out to 6 K. Data across detector elements were averaged using the ‘Average’ software package and further post-processed with Athena (Ravel and Newville, Reference Ravel and Newville2005).
III. RESULTS AND DISCUSSION
A. Inorganic Cu standards
XANES spectra of Cu inorganic standards are shown in Figure 1. Some samples have been compared in a solid and solution phase. These spectra demonstrate differences in the spectral features based on the solid vs. solution form and is consistent with, although not as pronounced as, data for Cu(I) species (Brugger et al., Reference Brugger, Etschmann, Liu, Testemale, Hazemann, Emerich, van Beek and Proux2007; Etschmann et al., Reference Etschmann, Black, Grundler, Borg, Brewe, McPhail, Spiccia and Brugger2011).

Figure 1. (Colour online) Cu-K edge XANES of a variety of inorganic compounds in solid (S) or solution (L) forms. All samples were analysed at a temperature <10 K.
B. Organic associations
A variety of samples, or solutions containing different organic molecules and Cu, were analysed for Cu association (Figure 2). This included constituents used in the formation of the polymeric thin films. The samples denoted as being additive (i.e. “+”) were samples of Cu(II)SO4 in solution and with the potential organic ligand subsequently added. Based on the position of the absorption edge, all samples appear to be representative of Cu(II) species. It is worthwhile to note that addition of the organic compounds to solutions generated different Cu absorption spectra, indicating the usefulness in Cu XAS distinguishing subtly different organic ligands in solution phase.
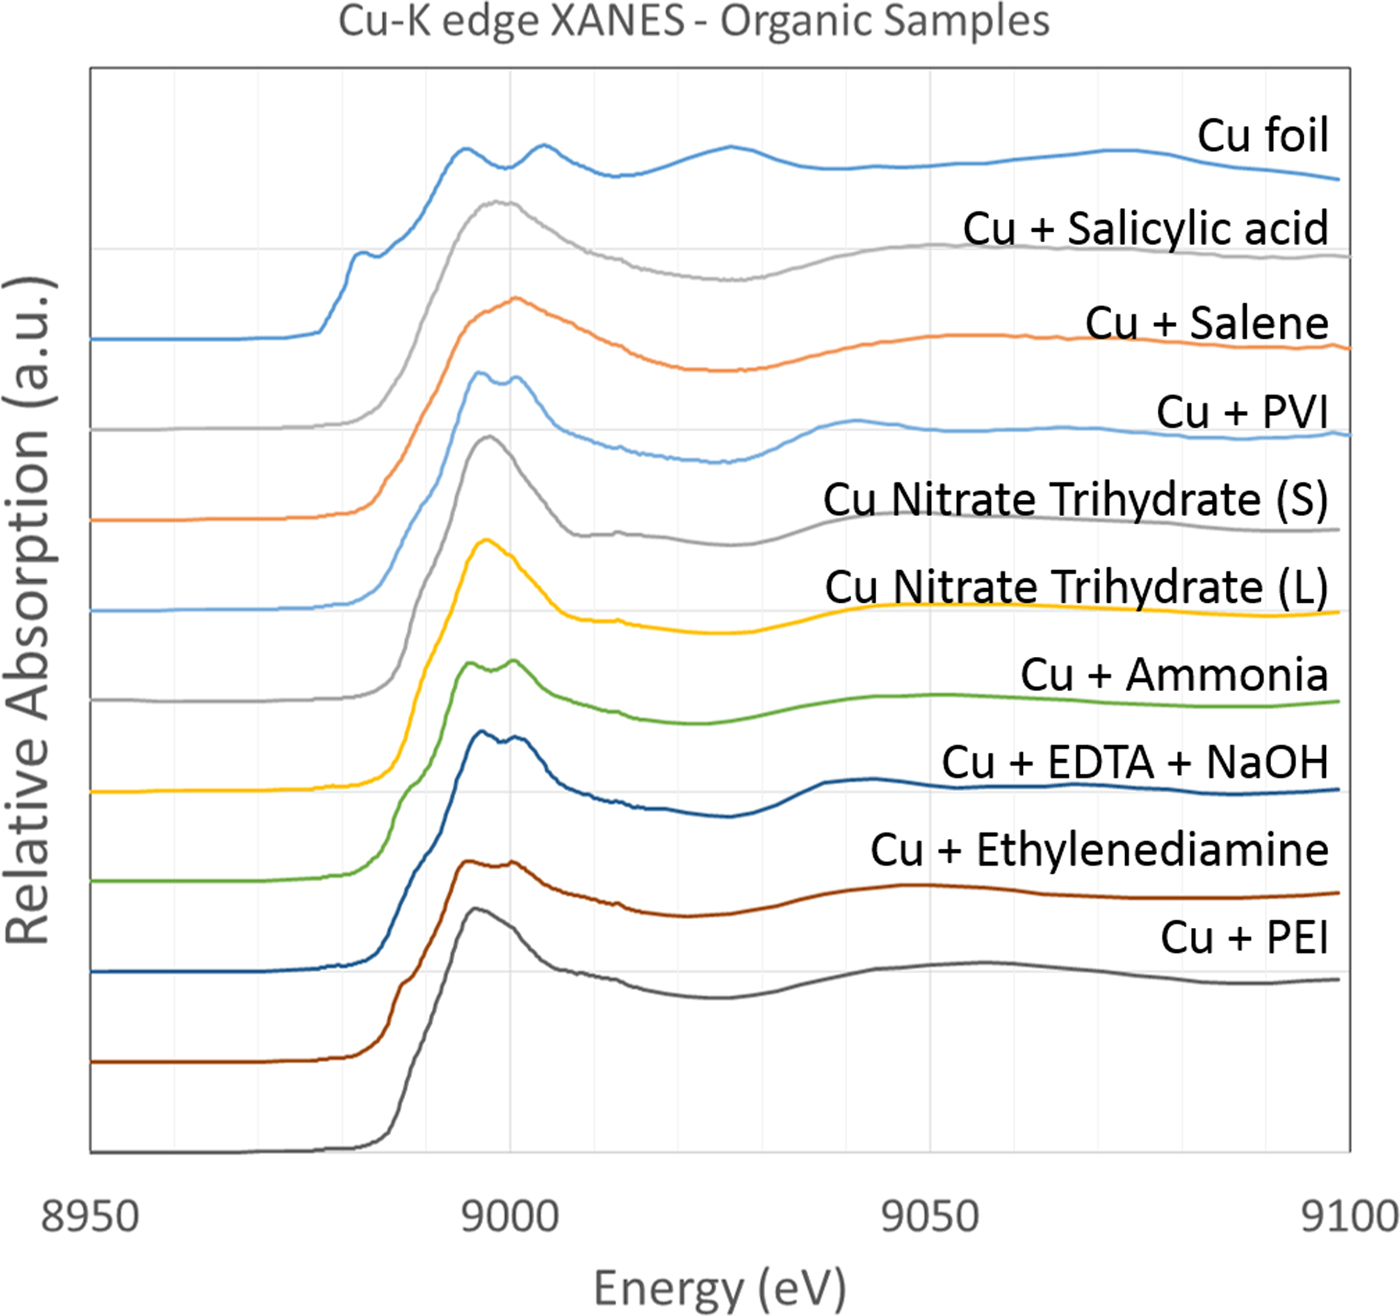
Figure 2. (Colour online) Cu-K edge XANES spectra of Cu in association with a variety of organic ligands or in their presence in solution to test for association. All samples were analysed at a temperature <10 K.
C. Using DMSO for vitrification
Ice crystals can scatter the incident analysing X-rays and produce severely detrimental artefacts in spectra when incident on detectors. To avoid this issue, vitrification of liquid samples is preferable to freeze the sample in an amorphous, rather than crystalline, state. This is assisted by incorporation of DMSO into the sample. We tested inclusion of 40% by weight DMSO into test solutions to gauge any influence on the copper XANES as shown in Figure 3. For these three samples, there was no observable effect on XANES spectra with the inclusion of 40% DMSO. It should be noted however that these are all Cu(II) complexes and similar observations may not extend to Cu(I) complexes. The nanoparticle sample is described in more detail in Section III E.

Figure 3. (Colour online) Inclusion of 40% DMSO by weight into aqueous samples had no apparent effect on XANES spectra for copper sulphate or copper associated to polymer in solution or in nanoparticles form. All samples were analysed at a temperature <10 K.
D. Beam damage tests
Incident X-rays used for XANES can be detrimental to samples, resulting in poorly understood and unpredictable redox chemistry. In the case of arsenic for example, reduction from As(V) to As(III) can occur on the order of seconds (Kempson et al., Reference Kempson, Henry and Francis2009; Kempson and Henry, Reference Kempson and Henry2010).Out of concern for possible beam alteration of the copper species, we ran consecutive scans for some samples and monitored any spectral evolution as a function of beam exposure. Examples shown in Figure 4 represent a series of 3 min scans. Figure 4(a) shows a reduction in Cu in an almost linear fashion for copper (II) chloride while no alteration was observed for copper sulphate pentahydrate [Figure 4(b)]. The spectra for copper nitrate trihydrate shown in Figure 4(c) exhibited a steadily increasing pre-edge feature between each scan. The white line intensity however initially decreased and subsequently varied with either increases or decreases in relative absorption. Some of this is likely to be explained by subtle differences in spectra normalisation. However, it does not appear an adequate explanation because of the spectra reproducibility and consistent trends observed in the evolution of other spectral features. It may thus elude to a more complex balancing of redox chemistry. Overall, very minimal changes between scans were observed.

Figure 4. (Colour online) Testing of beam-induced alteration XANES spectra of Cu in solution. Arrows indicate evolution in features with consecutive scans. All samples were analysed at a temperature <10 K.
E. Surface area effects: films vs. nanoparticles
In our research, we are interested in GA cross-linked thin films on the order of ~8 nm thick. The quantity of material in these films is extremely low, making characterisation very challenging. We aimed to compare spectra from nanoparticles to thin films that could provide similar surface to bulk properties. Nanoparticles could be analysed in much greater quantities for purposes of improving characterisation. Nanoparticles of GA–PEI with varying degree of cross-linking were prepared to: (i) act as a model system to achieve good signal to noise for copper in the XAS experiments, because of the possibility to achieve higher total copper concentration over the beam path compared with the nanothin coatings; and (ii) elucidate if there were differences in the chemical state of copper located at the surface or in the bulk of GA–PEI samples.
The nanoparticles were prepared by mixing GA and PEI at ratios between the molar cross-linking functionality of GA and primary and secondary nitrogen of PEI = 1:4, 1:2, 1:1, and 2:1. Conventional and diffusion Nuclear Magnetic Resonance (NMR) confirmed that an initial cross-linking reaction occurred within minutes where GA reacted with the available cross-linking groups of PEI. Visual observation and UV–Vis spectroscopy revealed that subsequently a slower reaction occurred in the material, causing samples to shift from colourless to increasingly red over a couple of days, indicating a significant change in the molecular structure. Calculations based on the mass of the product and UV–Vis spectroscopy revealed that the nanoparticles were fully cross-linked at a 1:1 ratio between GA cross-linking functionality and primary and secondary nitrogen of PEI (results not shown).
The diameter of the fully cross-linked nanoparticles was determined to about 10–20 nm by AFM and DLS (Figure 5). This means that the radial diffusion distance for copper to fully saturate the particles in solution was 5–10 nm, comparable to the nanothin films previously investigated (Lindén et al., Reference Lindén, Larsson, Coad, Skinner and Nydén2014, Reference Lindén, Larsson, Kaur, Skinner, Miklavcic, Nann, Kempson and Nydén2015). All references to nanoparticles in the XAS experiments in this work refer to the fully cross-linked particles, designed to chemically resemble the nanothin GA–PEI coatings.

Figure 5. (Colour online) Size characteristics of GA–PEI nanoparticles. Bar diagram shows the average peak hydrodynamic diameter of PEI and nanoparticles prepared using different cross-linker functionality to primary and secondary nitrogen ratio; Error bars indicate 1 SD (n = 3). The AFM micrograph shows fully cross-linked nanoparticles in the dry state on a silicon wafer.
The fully cross-linked nanoparticles presented a zeta potential of about +26 mV at pH 7 and it decreased to about +7 mV at pH 11, a similar behaviour as reported for nanothin GA–PEI coatings (Lindén et al., Reference Lindén, Larsson, Kaur, Nosrati and Nydén2016). More importantly, as for nanothin GA–PEI coatings (Lindén et al., Reference Lindén, Larsson, Coad, Skinner and Nydén2014, Reference Lindén, Larsson, Kaur, Skinner, Miklavcic, Nann, Kempson and Nydén2015), the nanoparticles were highly effective and selective in binding copper. This was concluded from XPS analysis of nanoparticles on silicon wafer squares after submersion overnight in MQ water containing 200 ppb copper, or artificial seawater containing 200 ppb of copper and 45 other elements (from certificated standard solution), although the N:Cu ratio for the nanoparticles was determined to be about 20, compared with about 12 reported for the nanothin coatings. The difference may be from the spin-coated nanoparticle films being thicker, so that the copper concentration in solution was significantly decreased during the uptake, and that erosion of the non-cross-linked nanoparticle films revealed underlying sample with less bound copper. Nonetheless, it was concluded that the nanoparticles could bind copper to at least a 1:20 Cu:N ratio from a concentration as low as 200 ppb, both in MQ water and in artificial seawater with competing ions.
XANES spectra acquired from the fully cross-linked nanoparticles are compared with a thin and thick film in Figure 6. Spectra from the nanoparticles is highly comparable to the thin, ~8 nm thick, film. There are some subtle differences when compared with the thick film, which was estimated to be at least ten times thicker than the thin film. This is presumably demonstrating the spectra to be a composition of Cu associated with bulk structure and Cu associated at the water–polymer interface. The thick sample would then be dominated by the bulk structure. Note that some small glitches are present in the spectra. These do not detract from the overall spectral curves but do demonstrate an improved signal to noise ratio for the nanoparticles compared with the films. In comparing the spectra of the films, nanoparticles with varying degrees of cross-linking and the standards, it can be concluded that the ligands involved in the cross-linking of the polymer do not detract from the Cu-forming ligands, and therefore the capacity of the material to accumulate Cu out of solution.

Figure 6. (Colour online) Cu-K edge XANES shows Cu associated with nanoparticles is highly comparable to the thin film and is an alternative model system for improving signal intensities in characterization techniques. All samples were analysed at a temperature <10 K.
IV. CONCLUSION
The results from analysis of different copper salts and solutions containing organic molecules and copper provides a source of knowledge that should prove valuable for researchers interested in the oxidation state and chemical complexation of copper. The use of a nanoparticle model system was verified to represent nanothin coatings with a thickness similar to the radius of the nanoparticles. It was further shown that addition of 40% DMSO as a vitrification agent did not significantly alter the XANES spectra for any of the investigated samples, a finding that is highly important for cryoanalysis of hydrated samples, where ice crystals that form without the use of a vitrification agent prevents analysis because of scattering.
ACKNOWLEDGEMENTS
This research was undertaken on the X-ray Absorption Spectroscopy beamline at the Australian Synchrotron, Victoria, Australia. The authors sincerely thank Dr. Peter Kappen and Dr. Chris Glover for assistance and advice in those measurements. The authors further acknowledge that work was performed at the South Australian node of the Australian National Fabrication Facility, a company established under the National Collaborative Research Infrastructure Strategy to provide nano and micro-fabrication facilities for Australia's researchers. The authors thank Nathan H Williamson at UniSA for his assistance with NMR measurements (data not shown) and Professor Magnus Nydén at UCL for valuable discussions.


