I. INTRODUCTION
Nowadays pair distribution function (PDF) analysis is largely employed to study complex materials. The PDF is a function in which peaks represent the correlations between all pairs of atoms. The function is defined as:
 $$G\lpar r\rpar =\left({\displaystyle{2 \over \pi }} \right)\mathop \int \limits_{Q=0}^{Q{\rm max}} Q\left[{S\lpar Q\rpar - 1} \right]{\rm sin}\lpar Qr\rpar dQ$$
where S(Q) is the so-called total scattering structure function, which derives from the properly normalized and corrected total scattering data. The Fourier transform procedure used to generate G(r) [Eq. (1)] introduces certain deviations, which are because of inadequate counting statistics, limited instrument resolution, finite Q max, and the different corrections applied to the data (Toby and Egami, Reference Toby and Egami1992; Egami and Billinge, Reference Egami and Billinge2003a). High experimental Q max values reduce the termination ripples in the G(r) and increase the real-space resolution. In this view, in XRPD total scattering experiments, the use of synchrotron radiation is suggested to measure data over a wide range of momentum transfer Q (Billinge and Kanatzidis, Reference Billinge and Kanatzidis2004). PDFs can be also obtained with laboratory X-ray diffractometers with some limitation in the atomic resolution (Egami and Billinge, Reference Egami and Billinge2003b), using, for example, silver or molybdenum anode X-ray tubes (Q max of 21.7 and 17.1 Å−1, respectively). The purpose of this work is the collection of total scattering data using the most common instruments with different experimental configurations, and the comparison of the subsequent PDF calculations. The instruments used in this work have been chosen for their peculiar characteristics: one, ID31 beamline at the European Synchrotron Radiation Facility (ESRF), with a very high reciprocal space resolution (and with a scanning detector setup), the second, ID11, is one of the high-energy experimental beamlines at the ESRF with a two-dimensional detector, and the third is a laboratory diffractometer with Mo anode (PANalytical Empyrean). All the instruments have been used at the best of their capabilities, according to the knowledge of the authors. Three PDFs have been calculated for each data-set in order to test the influence of the software PDFgetX3 (Juhas et al., Reference Juhas, Davis, Farrow and Billinge2013) using different parameters, in particular concerning background subtraction. The analyzed material is a ZnAl2O4 nanospinel (gahnite), synthesized by hydrothermal method. Crystals present a compact cubic structure, belonging to the space group Fd-3m. The zinc ion shows a tetrahedral coordination with four oxygens, while aluminum is placed in the octahedral site. The research work here presented constitutes a fair comparison between various sources for total scattering data, thanks to the peculiar characteristics of the sample. Owing to its nanometric dimensions and possibly disordered nature, in fact, none of the instruments should have a clear advantage. For instance, a large real-space resolution is not necessary, as there is no way to discriminate between the first two atomic distances (which are too close to each other), and, owing to nanometric dimensions (from 2 to 3 nm), a very high reciprocal space resolution does not bring a clear benefit to the corresponding PDF. A good PDF is essential for a proper structural analysis of the material, and therefore the influence of mentioned variables (instrument characteristics and background subtraction) in the procedure must be investigated.
II. EXPERIMENTAL
A. Instruments
1. ID31 diffractometer and data collection
Data have been collected at the beamline ID31 (ESRF, Grenoble, France), created for high-resolution powder diffraction and optimized for capillary samples. The wavelength, 0.39996 Å, has been calibrated against LaB6 standard (NIST SRM 660b) at room temperature. The beam has been monochromatized by a cryogenically cooled Si 111 double-crystal monochromator. The beam size had dimensions of 1.7 mm (horizontal) and 1.2 mm (vertical), defined by water-cooled slits. A bank of nine detectors, each preceded by an Si 111 analyzer crystal, has been scanned vertically to measure the diffracted intensity. The beamline is described in more details by Fitch (Reference Fitch2004). A boron glass capillary has been chosen as sample holder; the contribution of background has been collected and subtracted from sample scattering. Data collection lasted 5 h for both sample and empty capillary.
2. Empyrean diffractometer and data collection
Total scattering measurements with a laboratory diffractometer have been performed on a PANalytical Empyrean multipurpose diffraction system equipped with a sealed high-resolution X-ray tube with a Mo anode. The X-ray tube was operated at 60 kV and 40 mA in order to achieve good yield of MoKα characteristic radiation (λ = 0.7107 Å). The sample has been loaded in a glass capillary with 0.5 mm external diameter as received, without any further treatment. An empty capillary of the same type has been measured in the same way for background subtraction. The measurements have been performed using a setup with a focusing X-ray multilayer mirror. Anti-scatter kit specifically developed for the PDF application has been used to achieve the needed featureless background (te Nijenhuis et al., Reference te Nijenhuis, Gateshki and Fransen2009; Reiss et al., Reference Reiss, Kharchenko and Gateshki2012; Sommariva, Reference Sommariva2013). The energy discrimination levels of the solid state GaliPIX3D detector have been adjusted in order to suppress the fluorescence signal induced by the Mo radiation in the zinc atoms. The measurements have been performed in the angular range 5°–145° 2ϑ, which corresponds to a Q max value of 16.9 Å−1. An optimized variable counting time strategy has been adopted to counteract the decrease of the scattered intensity at the highest angles because of the X-ray form factor (Reiss et al., Reference Reiss, Kharchenko and Gateshki2012; Sommariva, Reference Sommariva2013). The total time of the measurement has been of 7.5 h, the same for both the sample and the empty capillary.
3. ID11 diffractometer and data collection
ID11 is a multipurpose, high-flux and high-energy beamline. Data collection has been performed with 0.20629 Å wavelength, selected by a double bent crystal monochromator operating in horizontal Laue geometry, and calibrated by a silicon NIST SRM 640c standard. The beam, previously focused with an in vacuum transfocator, consisting in a sets of Be, Al, and pinhole lenses, had a maximal size of 0.1 × 0.1 mm2, as defined by a slit. FReLoN camera has been employed for two-dimensional diffraction pattern acquisition. This is optimized for very rapid readout, allowing full (2048 × 2048 pixels, 16 bit) frames to be read out in ~240 ms (Labiche et al., Reference Labiche, Mathon, Pascarelli, Newton, Ferre, Curfs, Vaughan, Homs and Carreira2007). The background correction has been carried out measuring and subtracting the scatter of empty silica glass capillary, with a diameter of 0.5 mm, used as holder. To achieve good counting statistics, 15 diffraction images have been collected and merged together (3 s for each collection).
B. Data correction and generation of the PDFs
Data have been treated (corrected and normalized) with PDFgetX3 (Juhas et al., Reference Juhas, Davis, Farrow and Billinge2013) which allows the obtainment of a PDF by means of a low-Q-space polynomial correction. Five parameters are available to optimize the functions (the names of the parameters are exactly those used in the software): qmax [the upper Q-limit for the Fourier transformation of the F(Q) curve], qmaxinst (the Q cutoff for the meaningful input intensities), qmin [the lower Q-limit for the Fourier transformation of the F(Q)], bgscale (scaling of the background intensities), and rpoly [r-limit for the maximum frequency in the F(Q) correction polynomial]. Q min, for most instruments, is sufficiently small that the terms missing from the transformation are of negligible importance, since they are multiplied by the Q value (Toby and Egami, Reference Toby and Egami1992). For this reason qmin is, in general, fixed at value 0. PDFs, one for each data-set, have been initially calculated with default program parameters (Table I). To evaluate the influence of the available parameters, in particular of the background scale, other three PDFs for each data-set have been obtained and compared. The three groups, characterized by the specific calculation strategy (Table I), are described below:
-
- bgscale = 1: All the parameters available (described above) have been specifically chosen for each data-set to minimize the termination ripples and improve the PDF quality. Only bgscale has been fixed to 1 (the default value).
-
- bgscale = particular value: The functions calculated in the previous section (bgscale = 1) have been modified further by changing the bgscale parameter. The specific bgscale values have been chosen by comparing graphically each total scattering data-set with its background, and by minimizing the differences between them (see Figure 1 for an example).
-
- Optimized: The bgscale values have been obtained as described in the previous section and kept fixed. Then, qmax, rpoly, and qmaxinst have been modified individually for each data-set in order to get the best PDF with less noise because of termination effects, avoiding, at the same time, the loss of known structural features.
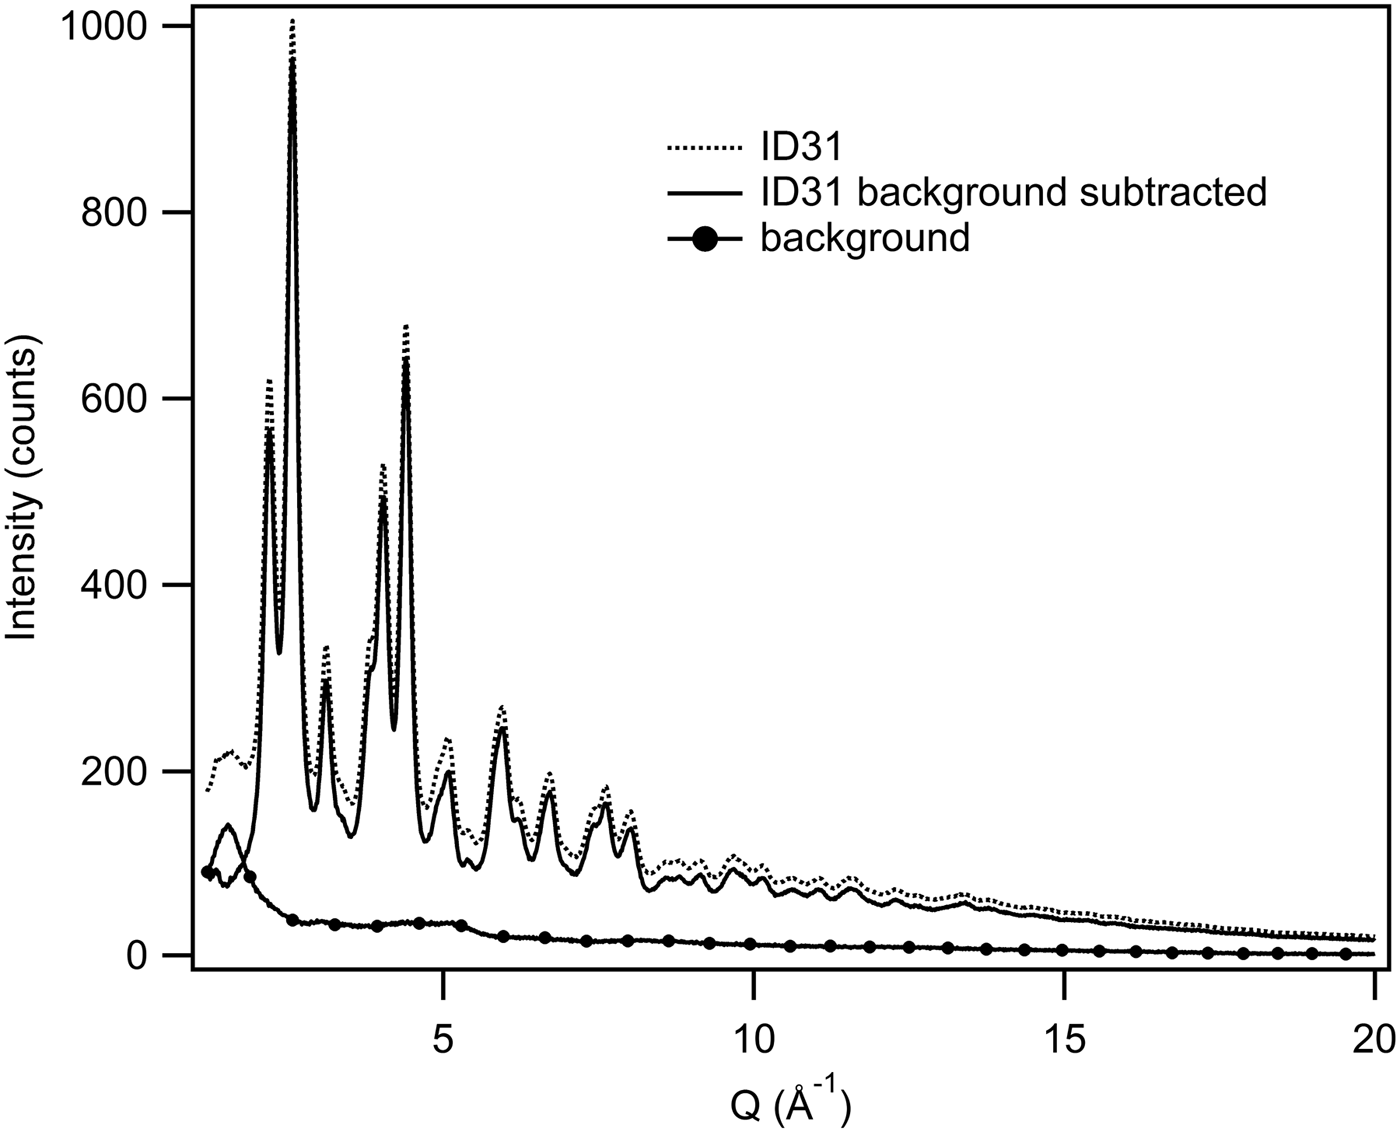
Figure 1. Example of background subtraction. PDFgetX3 allows the determination of the bgscale graphically in order to control and modify the background subtraction.
Table I. PDFgetX3 parameters used in PDF calculation (N.B. bg is short for bgscale).

qmin values are fixed at 0 for all PDFs.
The PDFs generated from the different data-sets have been visually compared. The PDFs obtained from the same data-set, but with different calculation parameters, have been also compared.
C. Refinements
Structural refinements based on the experimental PDFs have been performed using the software PDFgui (Farrow et al., Reference Farrow, Juhás, Liu, Bryndin, Božin, Bloch, Proffen and Billinge2007). To determine the Qdamp values for the different instruments, the PDFs of standard reference materials have been analyzed in the range of radial distances from 1 to 50 Å. LaB 6 NIST SRM 660b for ID31 and Empyrean data, and silicon NIST SRM 640c for ID11 have been employed as standards: the obtained Qdamp values were, respectively: 0.02, 0.01, and 0.059. The gahnite structural analyses have been carried out using the simplest possible model of a spinel [totally direct (Lucchesi et al., Reference Lucchesi, Della Giusta and Russo1998), with space group symmetry constraints]. All the refinements have been done in the same way, by refining the same parameters. To determine the average spherical diameter, as defined in Howell et al. (Reference Howell, Proffen and Conradson2006) and in Masadeh et al. (Reference Masadeh, Božin, Farrow, Paglia, Juhas and Billinge2007), structural refinements of the optimized PDFs, have been performed using the Qdamp values given above, in the range from 1 to 55 Å. The results confirmed the nanometric size of the material grain with a spherical diameter of about 30 Å for all PDFs. This has been verified also by transmission electron microscopy (Confalonieri, Reference Confalonieri2013) and small-angle X-ray scattering measurements performed on the same laboratory diffractometer (Sommariva et al., Reference Sommariva, Gateshki, Bolze, Reiss and Dapiaggi2013). Afterwards a second set of analyses has been executed from 1 to 20 Å with the aim of comparing the structural results of different PDFs; for the sake of simplicity, and to avoid any possible parameter correlation during the refinements, the spherical diameter parameter has been fixed at 30 Å.
III. RESULTS AND DISCUSSION
A. Qualitative comparison
In a simulated PDF of the gahnite structure the first two peaks represent Zn–O and Al–O bonds (see the calculated partial PDFs in Figure 2). In theory, a Q max ≥ 75 Å−1, calculated by the well-known formula Δr = π/Q max (Egami and Billinge, Reference Egami and Billinge2003c), would be necessary to discriminate these two distances (Δr = 0.0418 Å). In view of this, it is normal that all treated PDFs, even ID11, which presents higher Q max, show just one single peak at about 1.9 Å, which includes both the bonds. By visual inspection, the different PDFs appear to be in qualitative agreement (Figure 3). Figure 4 shows a comparison of F(Q) functions calculated from the three data-sets. The noise observed at high Q values in the ID31 data-set, is due to insufficient counting statistics. However, this does not affect significantly the PDF quality, as indicated by the similar features of the PDFs in Figure 3. In more detail, Empyrean PDF shows a few features which are a bit less resolved, in particular at 4.3 and 6 Å (marked by the two arrows in Figure 3). A structural refinement has been used in the following to check on this.
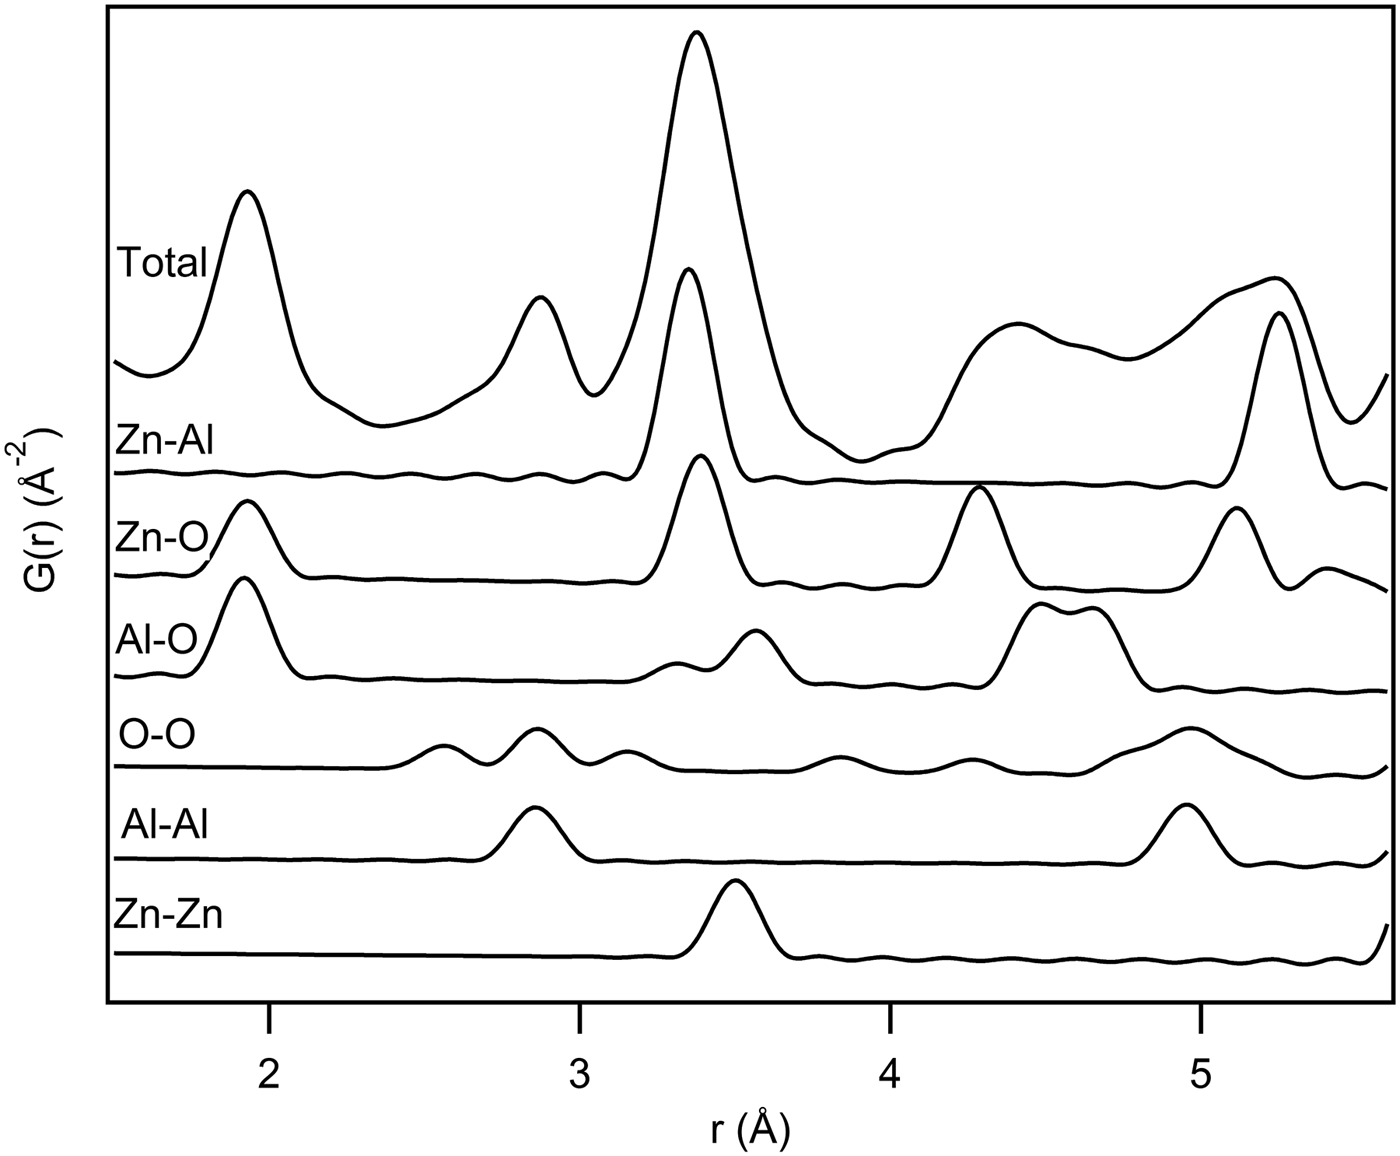
Figure 2. Gahnite Partial PDFs from 1.5 to 5.5 Å radius. The partial PDFs are calculated from the structure used in refinements. It is evident that the first peak includes both Zn–O and Al–O bonds. The two bond lengths show a very small difference.
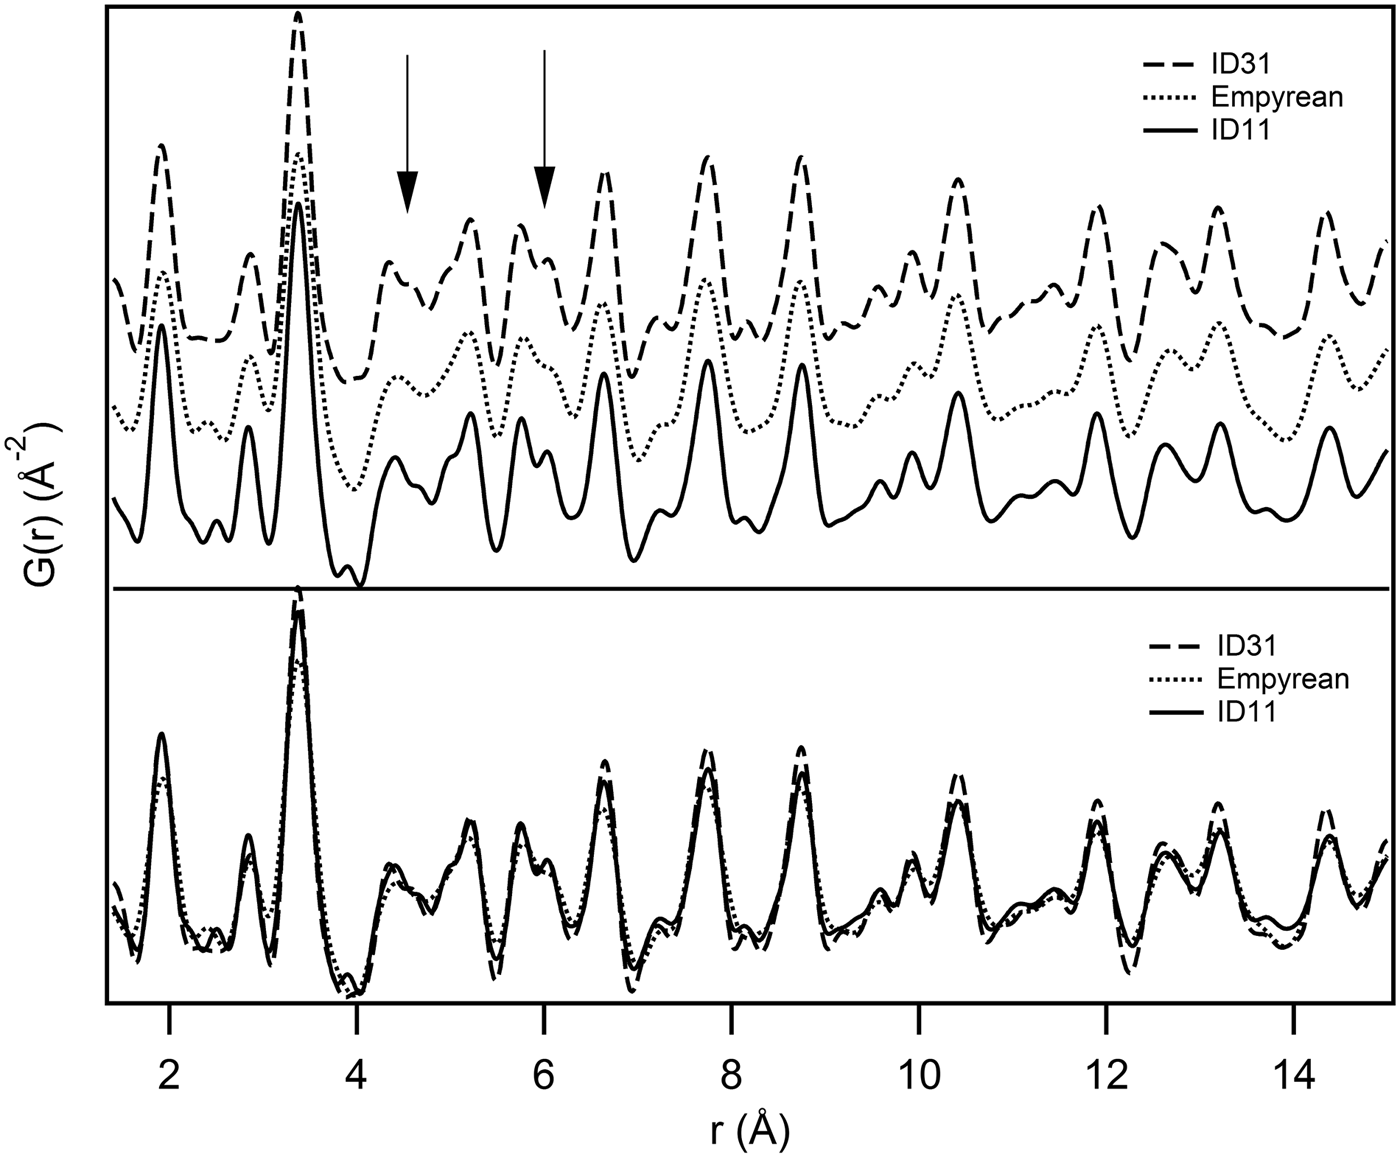
Figure 3. Visual comparison of optimized G(r) from three data sets. The PDFs are shown in a waterfall-like diagram (above) and superimposed (below). Arrows indicate the biggest differences in real-space resolution.
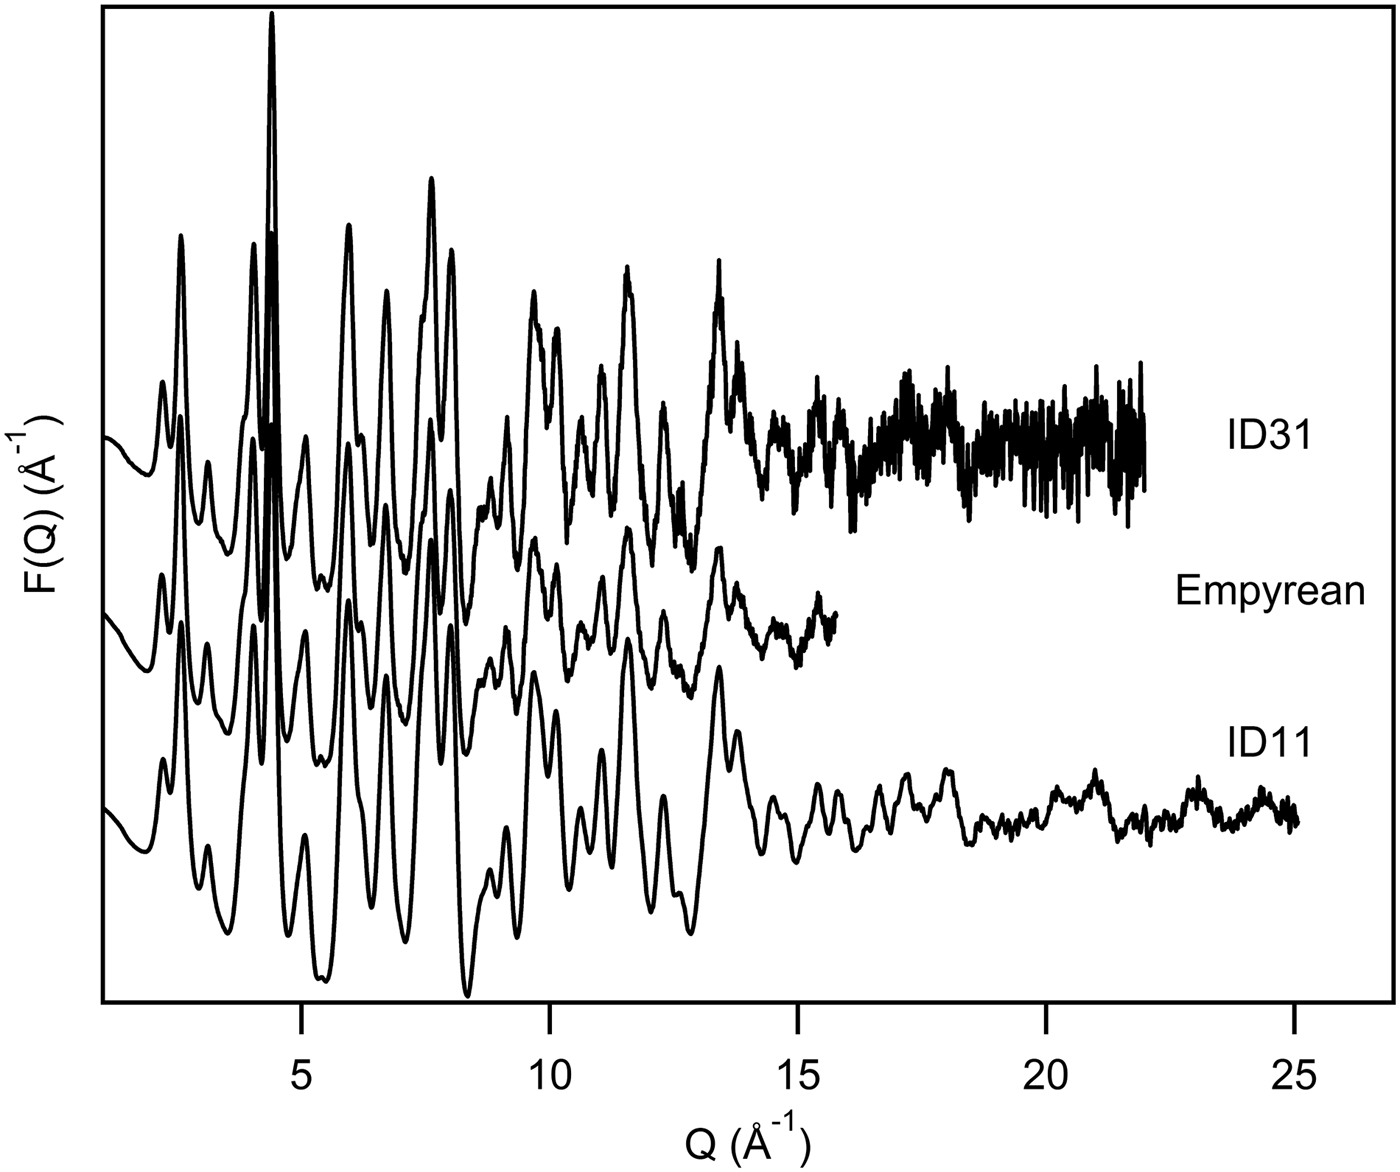
Figure 4. Visual comparison of optimized F(Q) from three data-sets.
Regarding the comparison of the various PDFs calculated for each instrument, Figure 5 shows, for example, that the PDFs calculated from the ID11 data-set with different correction parameters, especially with different bgscale values, are virtually identical. The same conclusion is valid for all instruments.
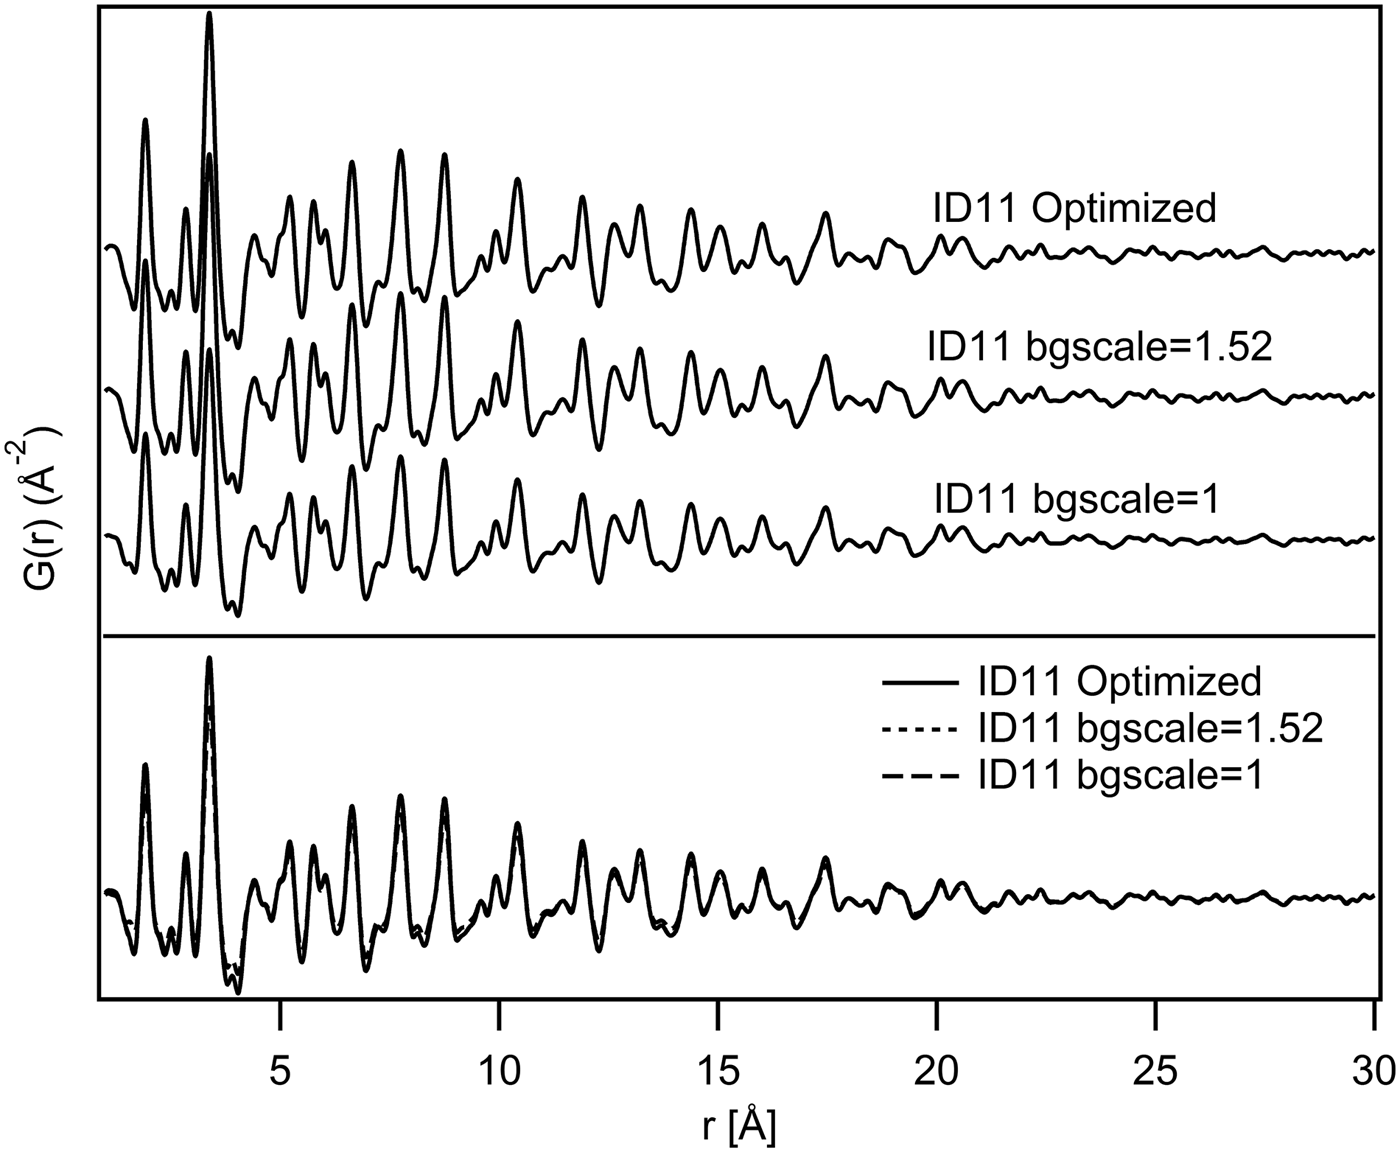
Figure 5. Visual comparison of G(r) from ID11 data-set. The PDFs are shown in a waterfall-like diagram (above) and superimposed (below).
B. Structural comparison
Results obtained from the structural refinements with the different data-sets are shown in Table II. It can be seen that the analyses produced similar structural parameters for the three data-sets. The small variations in lattice parameter values may be due to wavelength calibration, ambient temperature differences, or other possible experimental effects. The slightly broader peaks in the Empyrean PDFs (Figure 6) do not seem to affect the calculated lattice parameters and atomic positions, comparable with those obtained from the other instruments (Table II). Also, the R w values, which are a measure of the quality of the fits, are comparable for all data-sets and all analyses. The differences between the calculated and observed PDFs may be because of structural defects and/or stoichiometrical effects. For example, the peaks observed about 2.8 and 4.5 Å show a difference in intensity between the calculated and the experimental PDFs (Figure 6). The former represents an Al–Al bond (the O–O distance is clearly less significant with X-rays) according to the partial PDF calculations shown in Figure 2: the difference may be because of a distortion within the octahedral site, which is not taken into account in the highly symmetric crystallographic structure. This interpretation could be extended also to the difference of the peak at 4.5 Å, which represents Al–O and Zn–O distances. In fact, considering the gahnite compact cubic structure, the octahedral distortion described above would modify both Al–Al and Al–O bond lengths, but also Zn–O distances. The detailed discussions of the structural effects in this material are beyond the scope of this paper and will be the subject of other studies. In any case, considering the simple structural model used for the calculations (totally direct with space group symmetry respected), all PDFs give acceptable results. The slightly higher values of oxygen Uiso in the Empyrean PDF may be because of the shorter Q range or effect of absorption of X-rays in the sample material which has been not considered in the data processing. Estimated standard deviations of the parameters are derived from the least-squares minimization procedure in PDFgui. The statistical variations of the measured intensities are not taken into account during the Fourier transformation of the data done by PDFgetX3. Therefore, the estimated deviations of the different parameters reported in Table II may not be statistically significant.

Figure 6. Fits of three optimized PDFs from r = 1 to 20 Å. Circles indicate the biggest differences in calculated and observed PDFs.
Table II. PDF refinements results (r min = 1 Å, r max = 20 Å), (N.B. bg is short for bgscale).

IV. CONCLUSION
The PDFs obtained from the different data-sets are comparable. Small differences in the refined structural parameters could be caused by different instrumental characteristics, but also by the parameters used in the PDF calculation, so attention should be paid to the procedure of PDF generation from total scattering data. The laboratory diffractometer with a Mo-anode X-ray tube can be used, with good results, in total scattering experiments in which high real-space resolution is not required. Although accurate background subtraction is desirable, it does not seem to be decisive for the structural analysis.
ACKNOWLEDGEMENTS
The authors thank Lucia Pagliari, Department of Earth Sciences, University of Milan, and Ilenia Tredici, Department of Chemistry, University of Pavia, for their invaluable contribution to the synthesis of the sample.


