Introduction
At present, the right choice of perspective armoring materials for plasma-facing components in thermonuclear reactors is under discussion (Sethian et al., Reference Sethian, Colombant, Giuliani, Lehmberg, Myers, Obenschain, Schmitt, Weaver, Wolford, Hegeler, Friedman, Robson, Bayramian, Caird, Ebbers, Latkowski, Hogan, Meier, Perkins, Schaffers, Kahlik, Schoonover, Sadowski, Boehm, Carlson, Pulsifer, Najmabadi, Raffray, Tillack, Kulcinski, Blanchard, Heltemes, Ibrahim, Marriott, Moses, Radell, Sawan, Santarius, Sviatoslavsky, Zenobia, Ghoniem, Sharafat, El-Awady, Hu, Duty, Leonard, Romanoski, Snead, Zinkle, Gentile, Parsells, Prinksi, Kozub, Dodson, Rose, Renk, Olson, Alexander, Bozek, Flint, Goodin, Hund, Paguio, Petzoldt, Schroen, Sheliak, Bernat, Bittner, Karnes, Petta, Streit, Geller, Hoffer, McGeoch, Glidden, Sanders, Weidenheimer, Morton, Smith, Bobecia, Harding, Lehecka, Gilliam, Gidcumb, Forsythe, Parikh, O'Dell and Gorensek2010; Stork et al., Reference Stork, Agostini, Boutard, Buckthorpe, Diegele, Dudarev, English, Federici, Gilbert, Gonzalez, Ibarra, Linsmeier, Puma, Marbach, Packer, Raj, Rieth, Tran, Ward and Zinkle2014). In general, they have to withstand high impurities-, helium- and hydrogen-isotope-ion fluxes, high fluxes of electrons, and neutrons, and hence, even high heat fluxes, as well as high fluencies of ultraviolet, soft X-ray, and hard X-ray radiation. However, from case to case, the importance of individual load factors significantly changes: while in magnetic confinement fusion (MCF), neutrons and γ rays play the main role (Neilson, Reference Neilson and Neilson2014), in inertial confinement fusion (ICF), it is necessary to distinguish individual driving schemes. According to calculations (National Research Council, Reference Ahearne2013), direct-drive targets will emit 1.3% of energy in X rays (4 keV peak), 24% in ions (that not only cause greatest first wall heating for direct drive, but also implantation of α-particles), and the remainder in neutrons (that have volumetric deposition). Similar calculations for indirect drive show that high Z hohlraum materials absorb most of the α-particles and radiate more energy as X rays. The fraction of individual components depends on the details of the hohlraum design. For heavy-ion target, 25% of energy is in X rays (500 eV peak), 6% is in ions, and 69% is in neutrons. For laser-driven target, the X-ray fraction is 12%, 10% is in ions, and 78% is in neutrons. For indirect drive in both cases, the X rays represent the dominant threat to the first wall; to mitigate that, the wall wetted by liquid lithium or the wall protected by Xe gas is considered. Further references can be found, for example, in Alvarez et al. (Reference Alvarez, Garoz, Gonzalez-Arrabal, Rivera and Perlado2011), Raffray et al. (Reference Raffray, El-Guebaly, Federici, Haynes, Najmabadi and Petti2004), Craxton et al. (Reference Craxton, Anderson, Boehly, Goncharov, Harding, Knauer, McCrory, McKenty, Meyerhofer, Myatt, Schmitt, Sethian, Short, Skupsky, Theobald, Kruer, Tanaka, Betti, Collins, Delettrez, Hu, Marozas, Maximov, Michel, Radha, Regan, Sangster, Seka, Solodov, Soures, Stoeckl and Zuegel2015).
In MCF, the impurities can dominate the energy balance by radiating most of the power put into the plasma (Wesson, Reference Wesson2011); that is why low Z materials in regions outside the divertor are preferred. In reality, at plasma–material interactions in MCF devices, more complex spatio-temporal fundamental processes and synergies must be considered; among the main tasks belong maintaining the high-performance plasma for very long time, predictive controlling of hydrogen recycling, and minimizing of wall erosion. Recently, it turned out that lithiated and boronized plasma material interfaces are superior in majority of aspects (see Krstic et al., Reference Krstic, Allain, Dominguez-Gutierrez and Bedoya2018).
In ICF devices, the fusion plasma is spatially well separated from the vacuum container. Therefore, a first choice of materials for its first wall (and subject of our present investigation) stay those with high melting point, high thermal conductivity, strength, and hardness, and with low thermal expansion – like tungsten [W (Raffray et al., Reference Raffray, El-Guebaly, Federici, Haynes, Najmabadi and Petti2004; Sethian et al., Reference Sethian, Colombant, Giuliani, Lehmberg, Myers, Obenschain, Schmitt, Weaver, Wolford, Hegeler, Friedman, Robson, Bayramian, Caird, Ebbers, Latkowski, Hogan, Meier, Perkins, Schaffers, Kahlik, Schoonover, Sadowski, Boehm, Carlson, Pulsifer, Najmabadi, Raffray, Tillack, Kulcinski, Blanchard, Heltemes, Ibrahim, Marriott, Moses, Radell, Sawan, Santarius, Sviatoslavsky, Zenobia, Ghoniem, Sharafat, El-Awady, Hu, Duty, Leonard, Romanoski, Snead, Zinkle, Gentile, Parsells, Prinksi, Kozub, Dodson, Rose, Renk, Olson, Alexander, Bozek, Flint, Goodin, Hund, Paguio, Petzoldt, Schroen, Sheliak, Bernat, Bittner, Karnes, Petta, Streit, Geller, Hoffer, McGeoch, Glidden, Sanders, Weidenheimer, Morton, Smith, Bobecia, Harding, Lehecka, Gilliam, Gidcumb, Forsythe, Parikh, O'Dell and Gorensek2010; Alvarez et al., Reference Alvarez, Garoz, Gonzalez-Arrabal, Rivera and Perlado2011; Garoz et al., Reference Garoz, Páramo, Rivera, Perlado and González-Arrabal2016)], molybdenum [Mo (for comparison with W)], and silicon carbide [SiC (Perlado et al., Reference Perlado, Dominguez, Lodi, Malerba, Marian, Prieto, Salvador, de la Rubia, Alonso, Caturla and Colombo2001; Sawan et al., Reference Sawan, Ghoniem, Snead and Katoh2011; Snead et al., Reference Snead, Nozawa, Ferraris, Katoh, Shinavski and Sawan2011)]. The other traditionally considered materials for ICF (like ferritic/martensic steels and austenitic stainless steels (Inertial Fusion Energy Watching Brief, 2007–2013), oxide dispersion-strengthened ferritic steels (Caro, Reference Caro2009), dispersion-strengthened W (W + 1%Y2O3, or W + 2.5%TiC) (Vilemova et al., Reference Vilemova, Pala, Jager, Matejicek, Chernyshova, Kowalska-Strzeciwilk, Tonarova and Gribkov2016), carbon (Raffray et al., Reference Raffray, El-Guebaly, Federici, Haynes, Najmabadi and Petti2004), carbon foams and three-dimensional engineered materials (A 2013–2020 roadmap towards IFE …), and SiC composites (Sawan et al., Reference Sawan, Ghoniem, Snead and Katoh2011; Snead et al., Reference Snead, Nozawa, Ferraris, Katoh, Shinavski and Sawan2011) might be a subject of further studies.
The most common way of testing such materials is exposing them to intense neutron fluxes (Knaster et al., Reference Knaster, Arbeiter, Cara, Favuzza, Furukawa, Groeschel, Heidinger, Ibarra, Matsumoto, Mosnier, Serizawa, Sugimoto, Suzuki and Wakai2013), to high-energy ions (Renk et al., Reference Renk, Provencio, Tanaka, Olson, Peterson, Stolp, Schroen and Knowles2005), to heating by the high rep-rate laser (Najmabadi et al., Reference Najmabadi, Pulsifer and Tillack2006), or by pulse high-intensity infrared lamp (Hinoki et al., Reference Hinoki, Snead and Blue2005). Up to the present, the testing of such materials by X rays has been done with the help of discharges with broad radiating spectral range combined with emission of debris (Latkowski et al., Reference Latkowski, Abbott, Schmitt and Bell2005; Tanaka et al., Reference Tanaka, Rochau, Peterson and Olson2005). In the first case (Tanaka et al., Reference Tanaka, Rochau, Peterson and Olson2005), single-pulse irradiation of pre-heated W target by X-ray radiation of Z-machine (corrected by filters to be closer to radiation in direct-drive inertial-fusion reactors) is used for the determination of damage threshold. No surface changes were found below 0.27 J/cm2, and limited surface changes (surface roughening) were found at 0.9 J/cm2. In the second case (Latkowski et al., Reference Latkowski, Abbott, Schmitt and Bell2005, XAPPER X-ray damage facility), the Z-pinch (rep-rate 10 Hz, number of shots up to 105) is placed in the first focus of a semi-ellipsoidal reflector, in the second focus of which the target is positioned. A special foil comb reduces debris and restricts X-ray output to those angles that intercepts the focusing optics. It was also found that between 0.5 and 0.7 J/cm2 no roughening was observed, at 1.0 J/cm2 surface roughening is measurable, and at 1.2 J/cm2 the damage is “catastrophic” (melting takes place). We used for our tests debris-free monochromatic radiation with the quantum energy 26.45 eV, which is smaller than the peak of the expected IFE spectrum (between 1.17 and 1.66 keV for NRL direct drive, and 560 eV for heavy ion indirect drive) (Hassanein and Morozov, Reference Hassanein and Morozov2004), but still has a non-negligible contribution. It is worth mentioning that this low-energy range is the most dangerous one, because the photon energy is higher than any binding energy in solid state, but simultaneously its penetration depth is a few tens of nanometers only, and therefore, the deposition volume is extremely small.
Originally, the interaction of XUV radiation with solid surface was described macroscopically in terms of thermo-mechanical effects (Blanchard and Martin, Reference Blanchard and Martin2005; Inogamov et al., Reference Inogamov, Zhakhovsky, Ashitkov, Emirov, Faenov, Petrov, Khokhlov, Ishino, Demaske, Tanaka, Hasegawa, Nishikino, Tamotsu, Pikuz, Skobelev, Ohba, Kaihori, Ochi, Imazono, Fukuda, Kando, Kato, Kawachi, Anisimov, Agranat, Oleynik and Fortov2015). The present theory (Kabeer et al., Reference Kabeer, Zijlstra and Garcia2014; Medvedev et al., Reference Medvedev, Li and Ziaja2015) says that this XUV radiation changes the effective interatomic potential near the solid surface, and in this way, the mechanical stability of the lattice.
This paper does not have ambition to confirm or deny the abovementioned latest theoretical descriptions. It aims to clarify the results of the interaction of sole XUV radiation with the solid surface of the candidate armoring materials –W, Mo, and SiC.
Experimental apparatus and methods
The source of coherent XUV radiation is the CAPEX (CAPillary EXperiment) apparatus with a 40 cm long Ar-filled capillary with pinching discharge driven by 6 nF/400 kV capacitor (see Fig. 1, and in more detail Schmidt et al., Reference Schmidt, Kolacek, Straus, Prukner, Frolov and Bohacek2005). The population inversion is built on energy levels belonging to Ar8+ (Ne-like Ar) ion. The soft X-ray laser has the wavelength ~46.9 nm, the pulse duration ~1.5 ns, and the focused pulse energy 21–40 µJ. The laser beam propagates ~2.6 m through an evacuated pipe and an experimental chamber to the spherical multilayer (Sc/Si) mirror (diameter 40 mm, surface radius 2100 mm), which focuses radiation on a ~1.79 m distant target. The target is placed approximately in the mid plane between tangential and sagittal foci. Due to that, the damage pattern has a “cross” shape that might be (in the high-energy case) modified by a superimposed interference pattern caused by mirror surface imperfection. A typical laser energy density distribution in the interaction area (with peak value for SiC target ~5 J/cm2) and the factors that cause its variations are in detail given in the Discussion section.
Fig. 1. Part of CAPEX machine showing part of the driving capacitor, the spark gap, and the capillary. To the experimental chamber with multilayer focusing mirror, there are attached both the pipe, connecting it with CAPEX, and the diagnostic arm with irradiated target/sample.
Typically, each sample of the investigated materials [W (dimensions 20 mm × 20 mm × 1 mm, Ra values 1.9–3.5 nm measured by Zygo on the area 0.70 mm × 0.52 mm), Mo (dimensions 20 mm × 20 mm × 1 mm, Ra values 2.3–2.6 nm measured by Zygo on the area 0.70 mm × 0.52 mm), and SiC (dimensions 20 mm × 20 mm × 5 mm, Ra values 1.0–1.2 nm measured by Zygo on the area 1.40 mm × 1.05 mm) – neither producer, nor technology process can be published] was irradiated by repetitively fired laser shots, which left well-separated damage patterns on the sample surface: the first damage pattern was created by a single laser shot, the second was created by five accumulated laser shots, and the next by ten, 20, and sometimes even 50 accumulated laser shots. The interval between laser shots was kept constant (40 s); therefore, it is possible to expect that the sample surface cools down completely between successive shots. The damage patterns created by the focused laser beam on the sample surface were analyzed by atomic force microscope (AFM), by scanning electron microscope (SEM), and the sub-surface structure by SEM analysis of the wall of a trench milled by focused gallium-ion beam along the platinum bar deposited on the sample for the surface protection against trench-edge rounding (at trench-wall polishing) and against undistinguishable re-deposition of material excavated from the trench. Moreover, the SiC sample was examined using the Raman micro-probe.
Results of irradiation
Tungsten
Damage pattern created by a single laser shot
On the W surface, the damage pattern created by a single laser shot is clearly visible (see Fig. 2); however, when imaged by AFM, it is seen not as a crater, but as an area covered by small “grains/solidified droplets”.
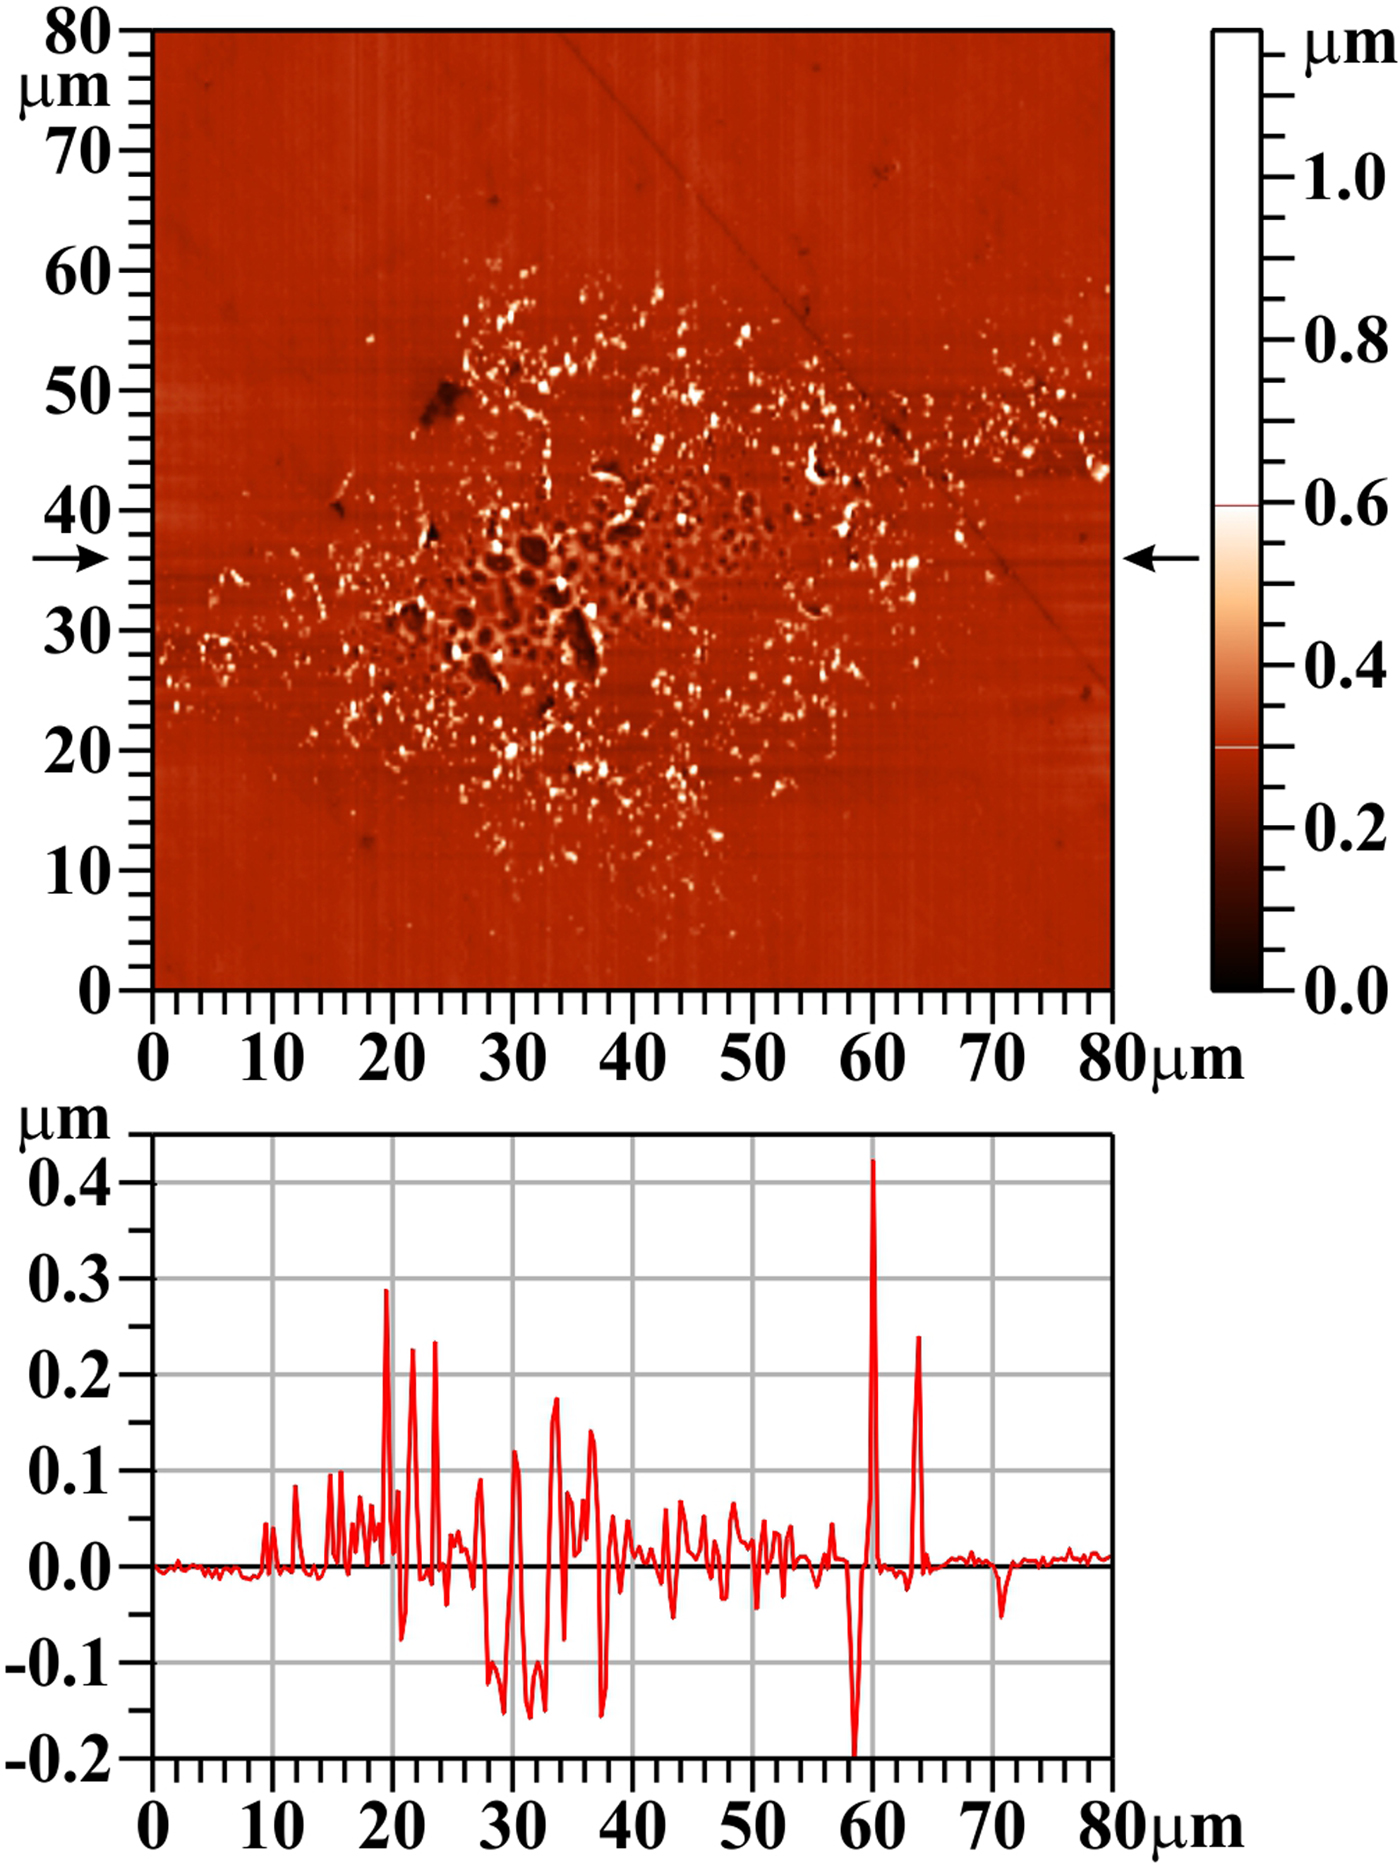
Fig. 2. Tungsten (W), one shot, AFM image. The bar on the right shows the whole range of heights, but only the range from 0 to 0.6 µm is used for the color scale. The profile along the horizontal line y = 36 µm (see arrows) is shown below the two-dimensional image.
The SEM image (see Fig. 3) confirms this interpretation and provides further details: the W target has a porous structure (see Fig. 3, top part, unexposed area); some of these pores are opened, some are closed and it is expected that they contain gas persisting there from production. The central part of the laser-irradiated area was melted (T melting W = 3695 K) and re-solidified. During this melting process, some closed pores were opened, the gas explosively escaped into vacuum, and the material from their lids/covers was deposited around the created mini-craters (see mid and bottom part of Fig. 3). It should be mentioned that no de-gassing of samples before exposition were performed, because in a real reactor wall also some He gas will be present. Another explanation of the observed surface structure supposes (von der Linde and Sokolowski-Tinten, Reference von der Linde and Sokolowski-Tinten2000; Zhakhovskii et al., Reference Zhakhovskii, Inogamov and Nishihara2008) that melted layer (being heated to triple point) immediately starts to boil (due to vacuum above the surface) and the quasi-circular holes on the surface are residua of bursting bubbles, from which “saturated” vapor explosively escaped making rims around them and the surface rapidly re-solidified. The melting process is demonstrated by a number of droplets that were about to release from the melted matter (Fig. 3, arrows “A”), or that had been released and fell back to the target surface (Fig. 3, arrows “B”). Moreover, rapid heating and cooling induces internal stress in the influenced sample surface layer (Ryutov, Reference Ryutov2003), which causes somewhere not only its partial delamination [the free edges of these semi-detached chips are rounded due to more intense heating resulting from locally reduced thermal conduction (Fig. 3, arrows “C”)], but also cracks and ruptures (see Fig. 3, arrows “D”).
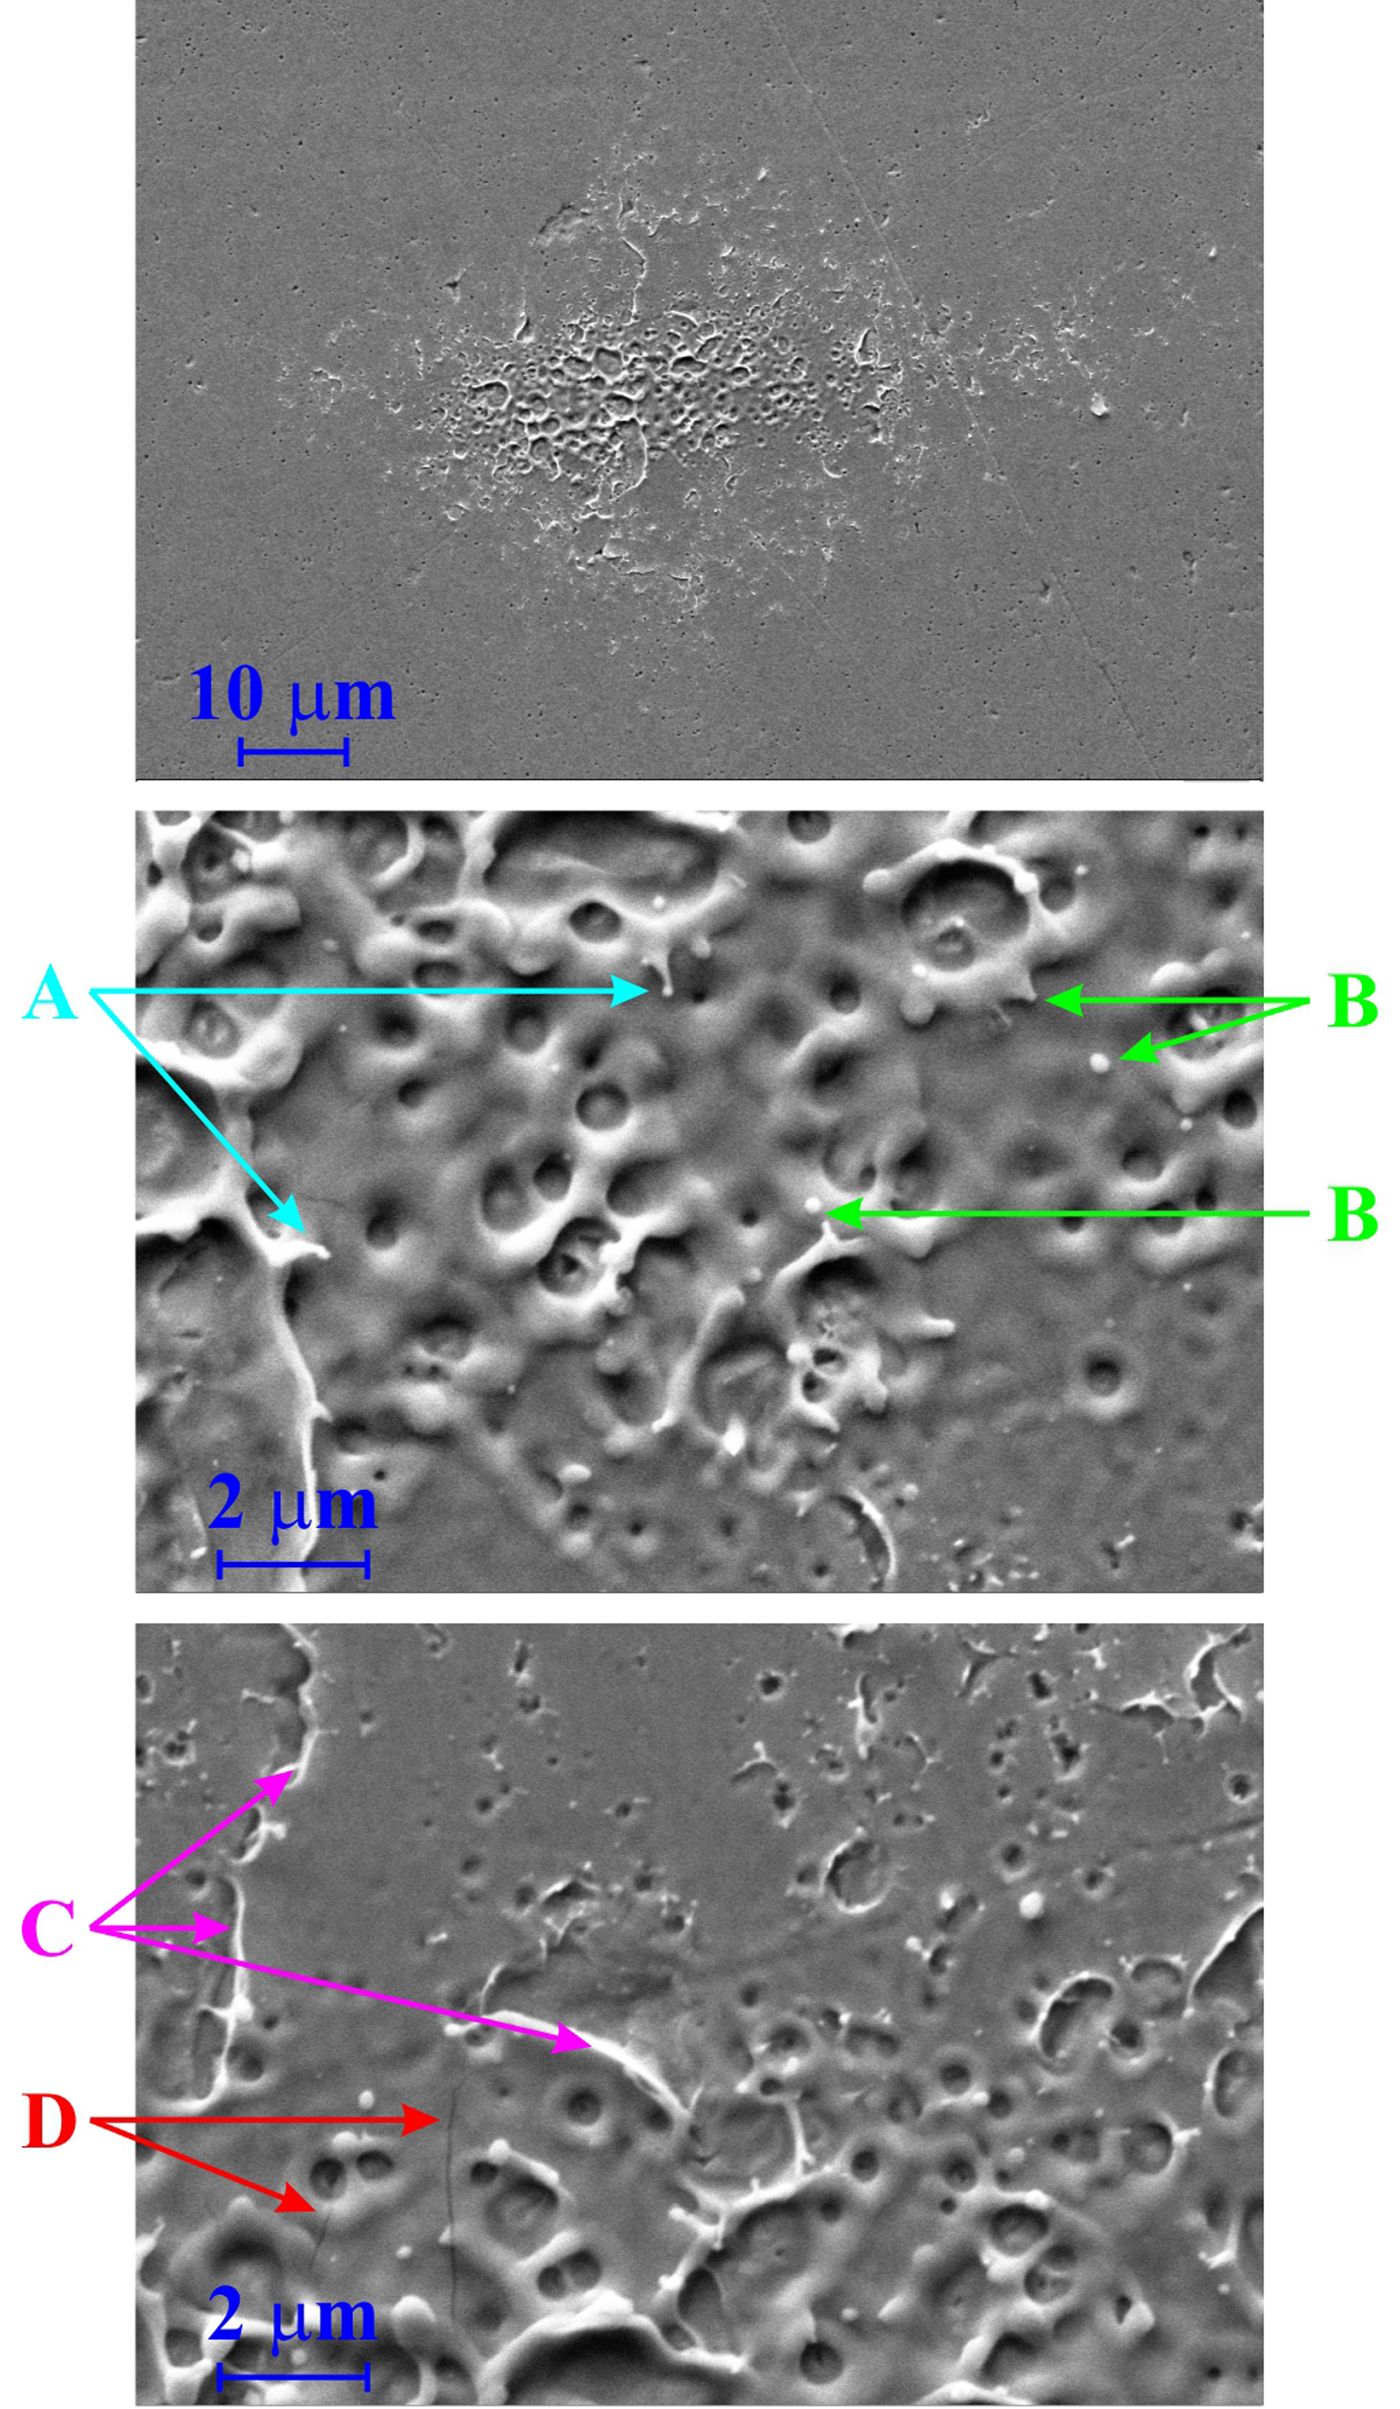
Fig. 3. Tungsten (W), one shot, SEM images (secondary electrons detector): top: the whole damaged area, mid: the lower central part of the damage pattern, bottom: upper central part of the damage pattern.
Analysis of the trench-wall situated in the center (ablation area – right part of the Fig. 4) as well as in the periphery (desorption area – left part of Fig. 4) of the damage pattern confirms that the W was rolled (the crystalline grains have longer dimension oriented along the surface), ground, and mechanically polished: the unexposed as well as the low-exposed surface layer is modified into the depth of a few tens of nanometers, having much smaller crystalline grains with more irregular surface than the grains deeper in the volume. The layer modified by polishing is removed in the higher exposed area; however, no in-depth modification of the near surface layer (e.g. related to volume melting and re-solidification, recrystallization to columnar form and resizing of grains, etc.) is observed.
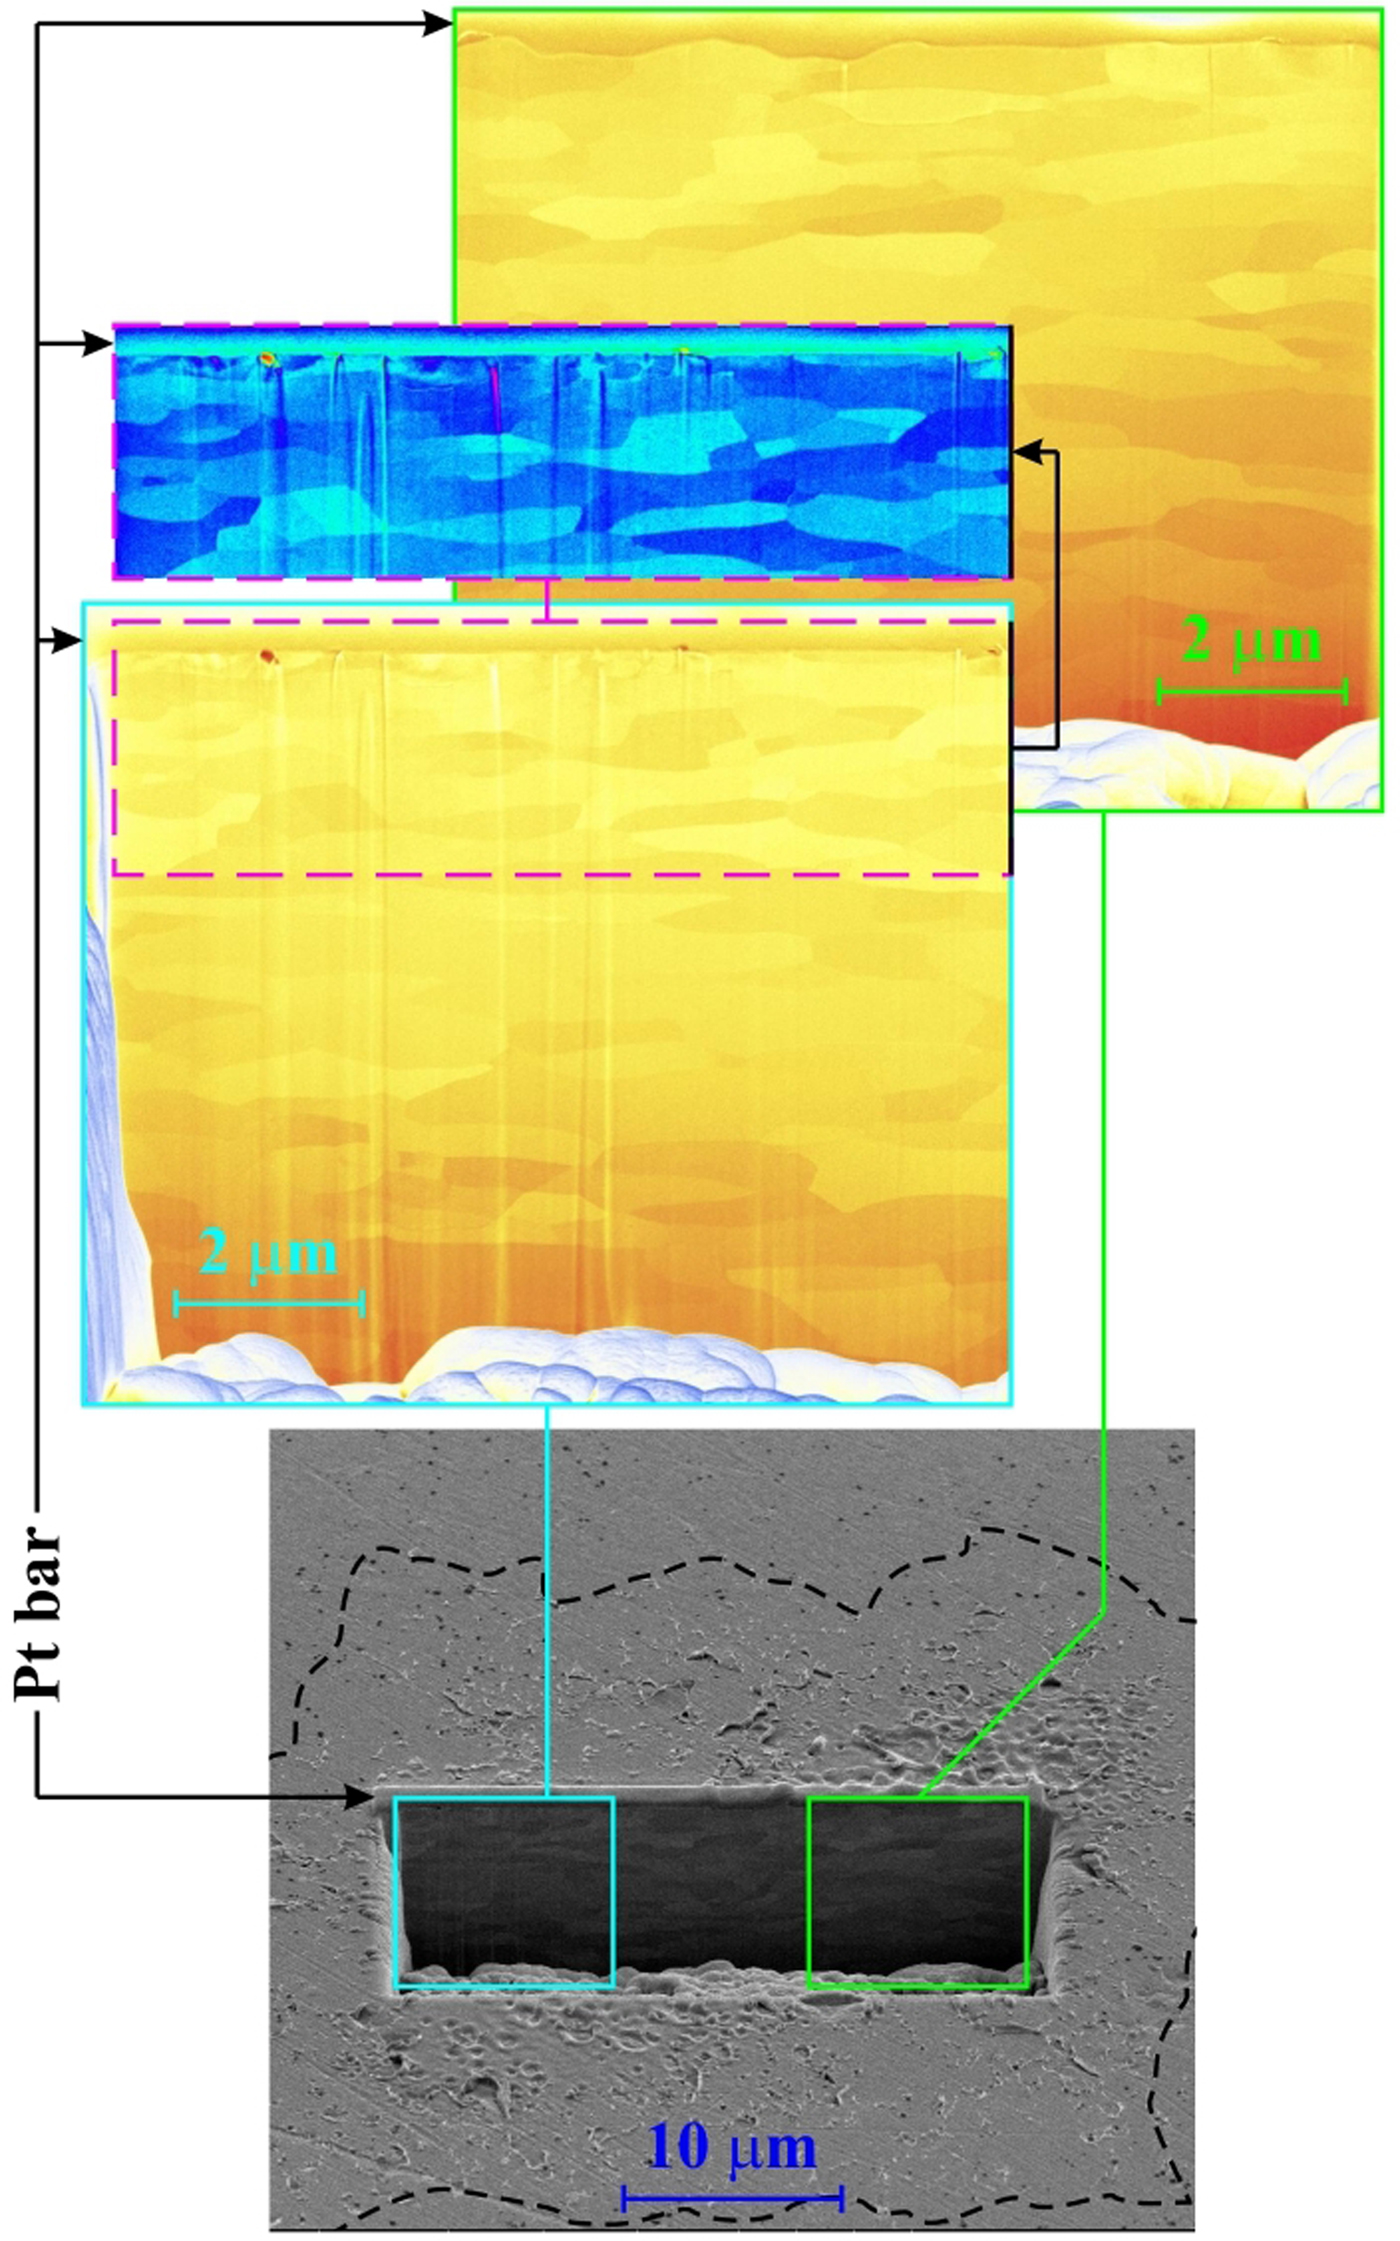
Fig. 4. Tungsten (W), one shot, SEM trench-wall view (tilt 52o): bottom: the trench position well inside the damage pattern (its border is shown by the dashed line), top right: the blown-up part of the trench-wall in the laser ablation area, top left: the blown-up part of the trench-wall in the laser desorption area. The sub-surface layer in the same enlargement, but in different false colors is shown above the left blown-up part.
Damage pattern created by 20 accumulated shots
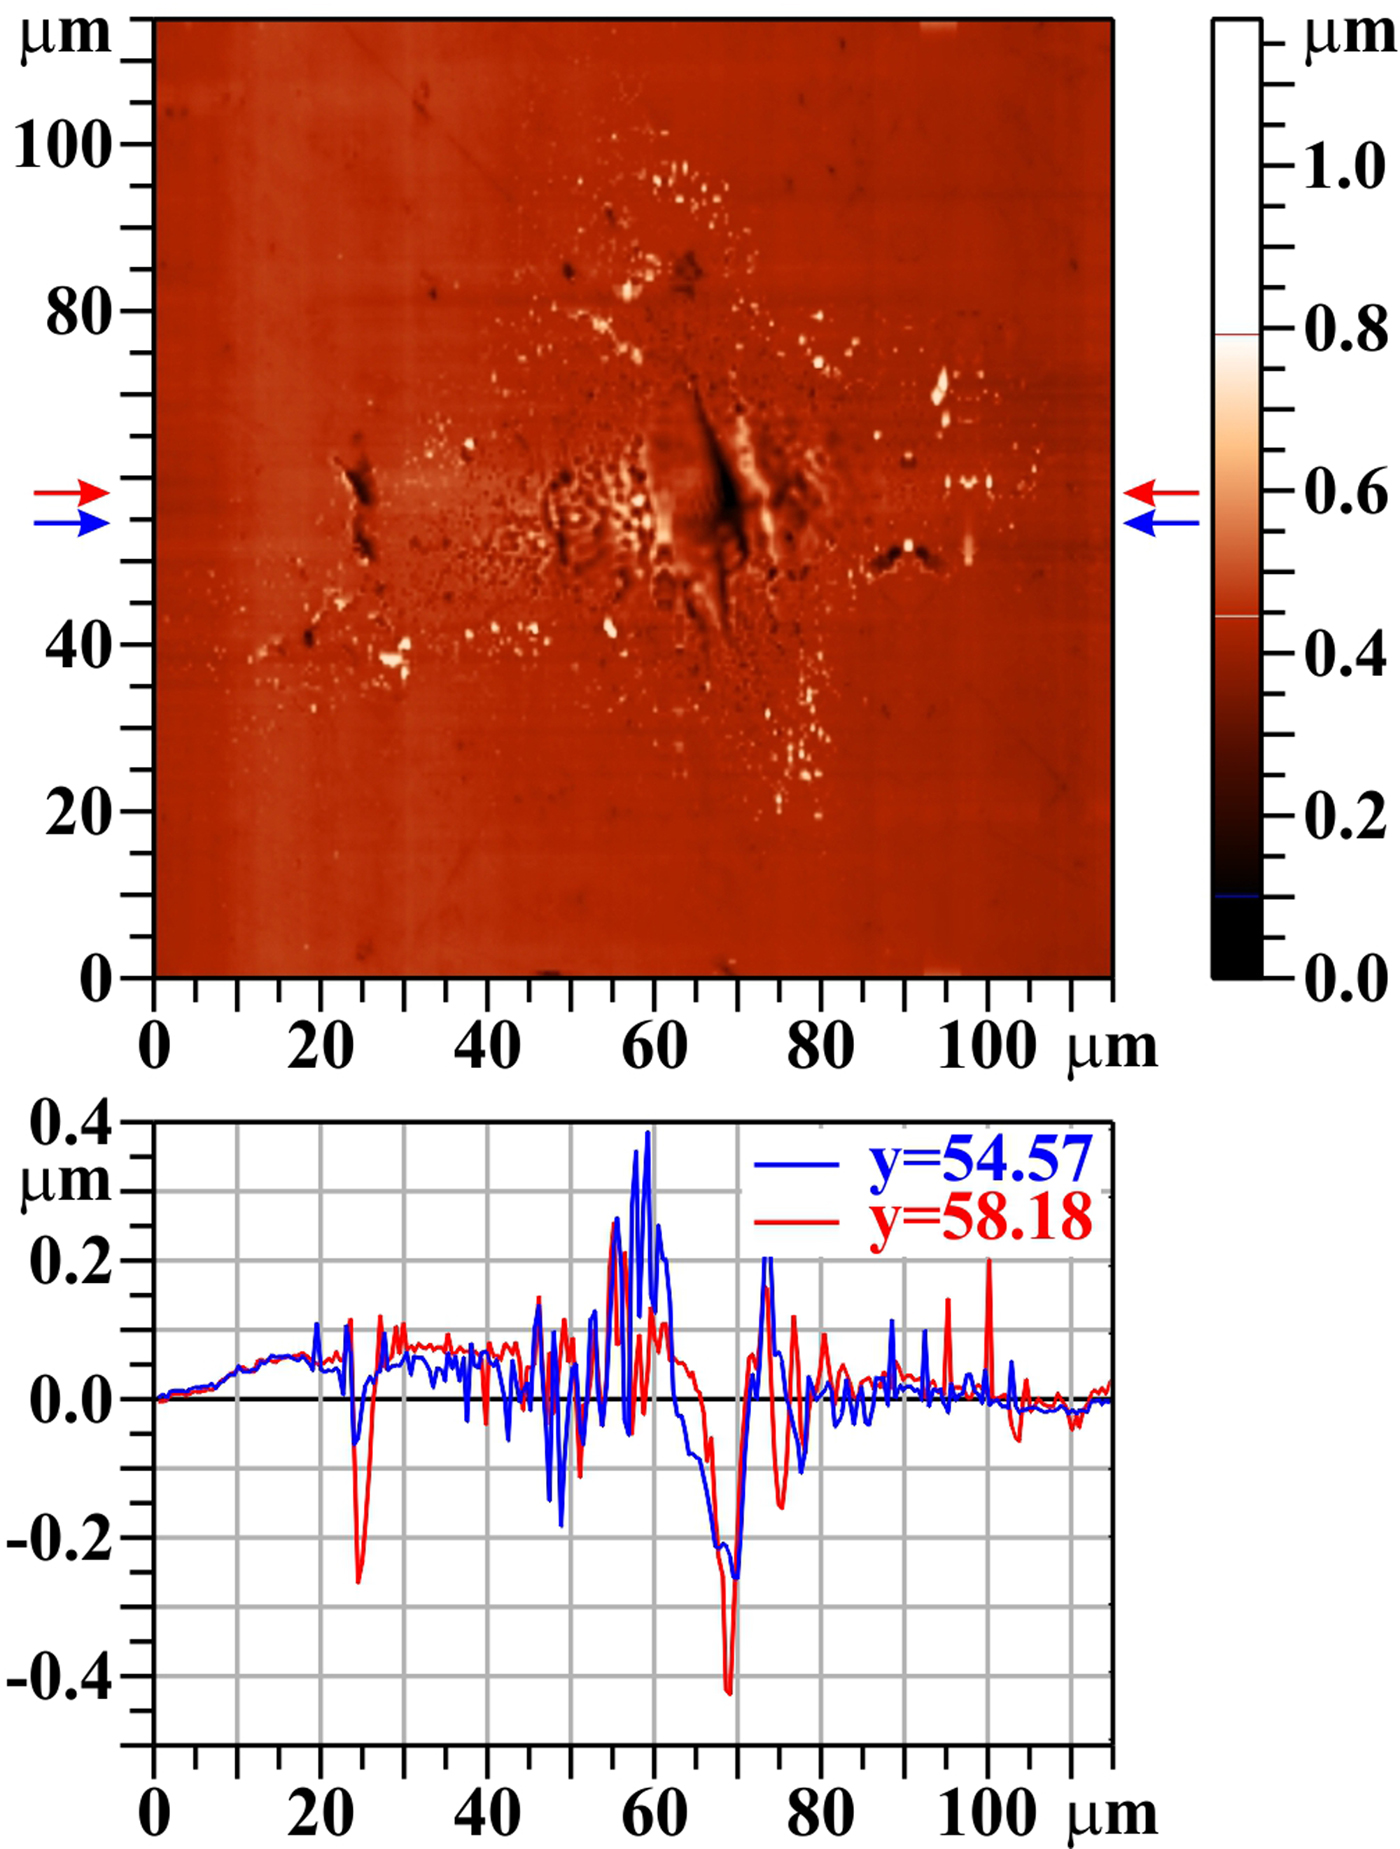
When the number of shots at the same irradiation position rises, the central melted area broadens and the small grains (seen in Fig. 2 as light spots, appearing after the first shot mainly at the edge of opened pores/burst bubbles) persist in the irradiated area periphery only (see Fig. 5). Simultaneously, the central melted area sinks down, creating a visible crater. Vertical elongation of the crater is due to the position of the target being a bit closer to the tangential focus than to the sagittal one. The melted material is partly pushed to sides, and partly evaporated and re-deposited around the crater and forms a rim at its edge (Romashevskiy et al., Reference Romashevskiy, Ashitkov and Agranat2016) (see Fig. 5, profile y = 54.57 µm). The dark spots on the left (at the damage pattern periphery), and the related drop on the profiles, are connected with a surface imperfection.

Fig. 5. Tungsten (W), 20 shots, AFM image. The bar on the right shows the whole range of heights, but only the range from 0.1 to 0.8 µm is used for the color scale. The profiles along the horizontal lines y = 54.57 µm and y = 58.18 µm (see arrows) are shown below the two-dimensional image.
Figure 6 shows that the trench was created in the laser damaged area only. It is apparent that the whole thin surface layer distorted by W polishing was removed in the trench vicinity. However, even 20 accumulated laser shots did not cause any visible persistent structural changes in the substrate.

Fig. 6. Tungsten (W), 20 shots, SEM trench-wall view (tilt 52o): bottom: the whole damage pattern, middle: the blown-up part of the trench-wall in the damaged area, top: the blown-up part of the trench-wall in the center of the damage pattern.
Molybdenum
Damage pattern created by a single laser shot
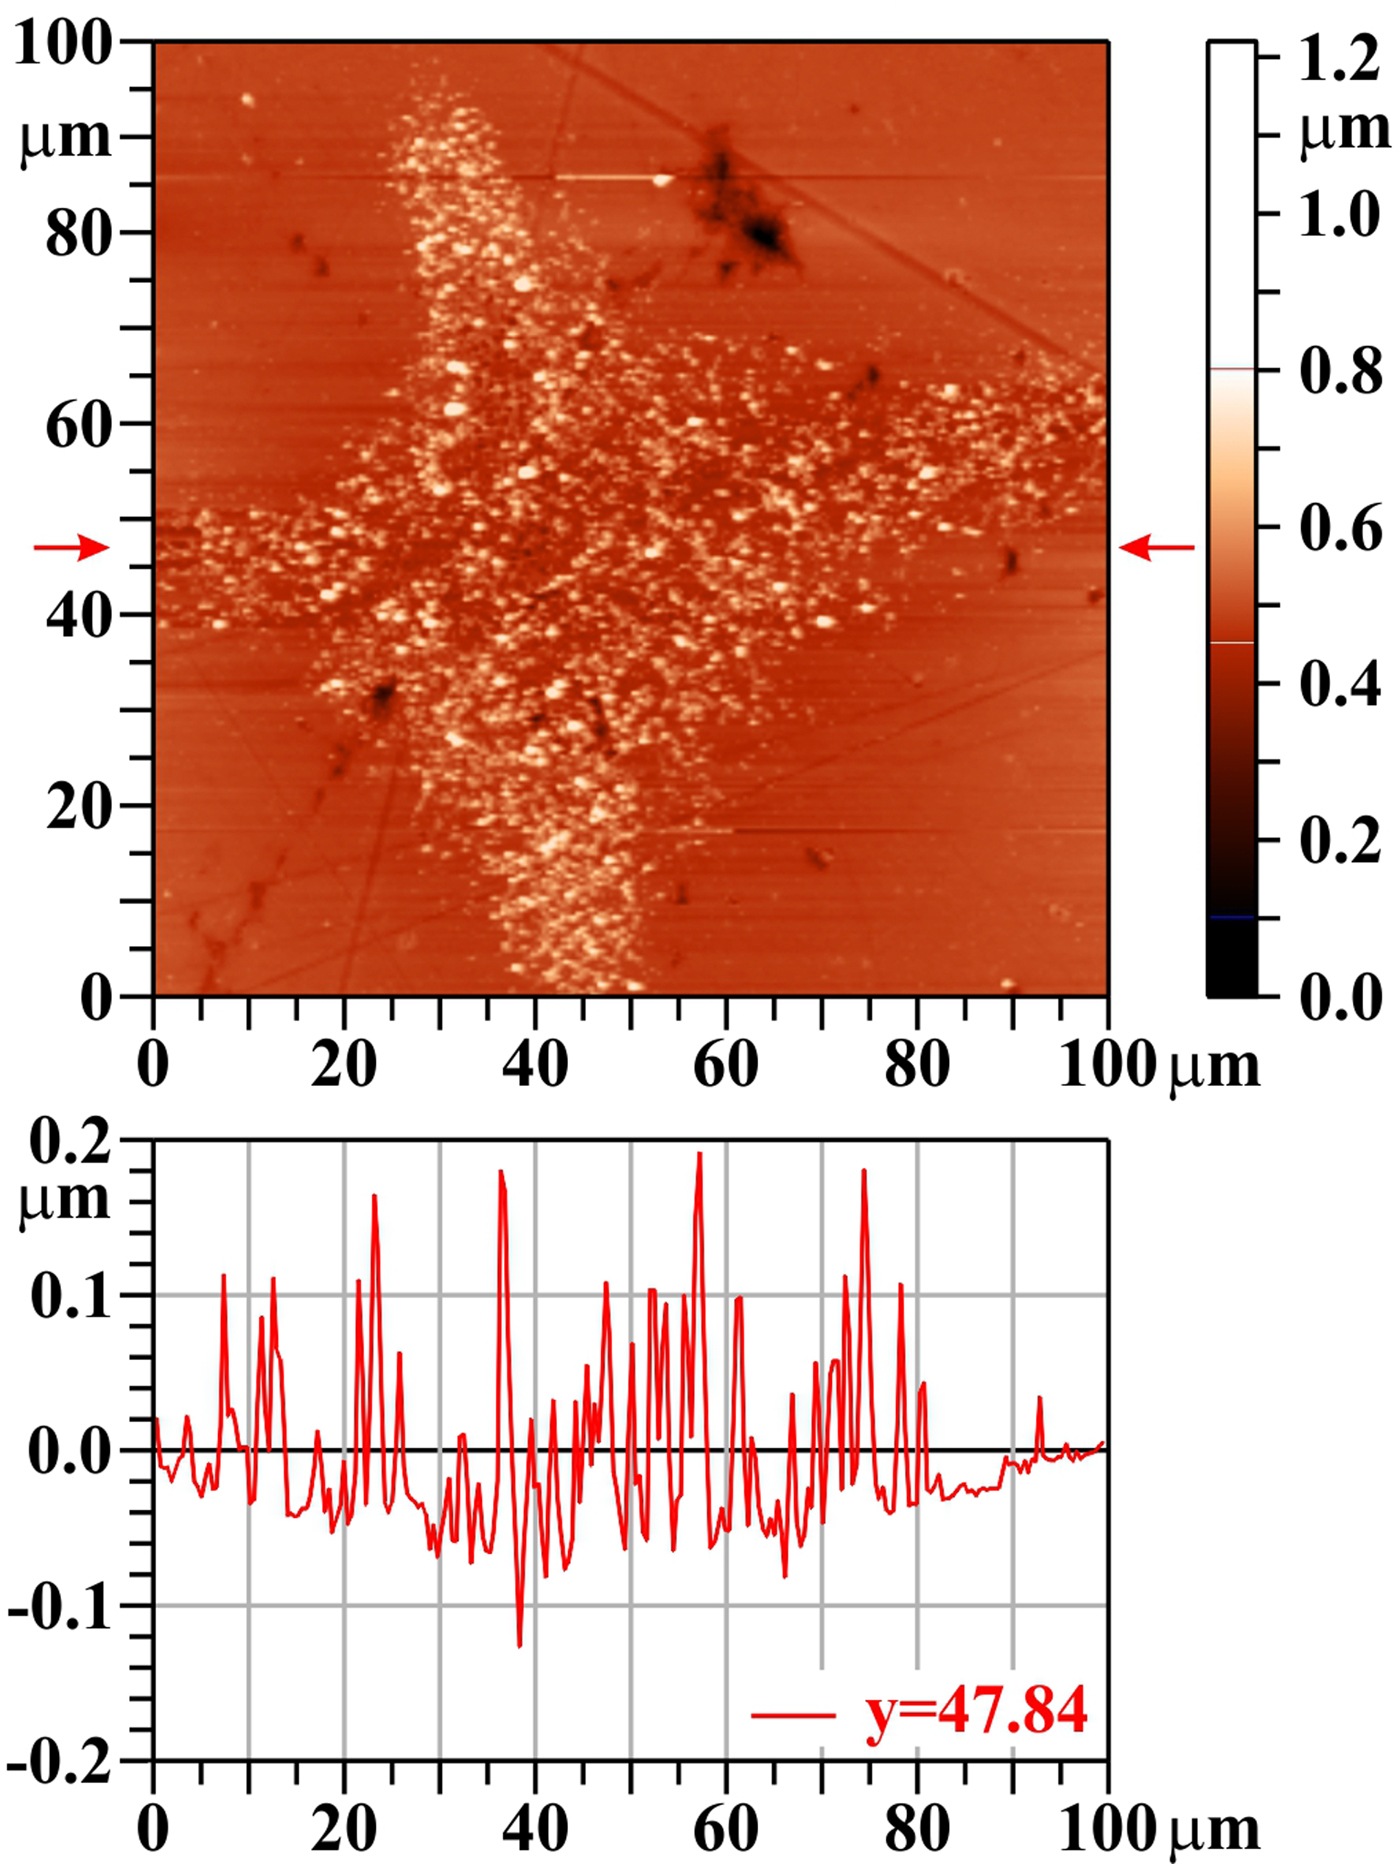
XUV-laser-irradiated Mo behaves similarly to W: a single laser shot does not drill any crater, but partly removes impurities from the surface (that remained there after polishing and were not cleaned by ultrasound waves in organic dissolvent and washed away by distilled water), and opens closed pores and/or creates bubbles that burst, and pressurized gas escapes from them (see Fig. 7). Moreover, rapid heating and cooling (accompanied by thermal expansion and shrinkage) induce, similarly as at W, numerous non-uniformities in the surface region and contribute to the surface damage morphology.

Fig. 7. Molybdenum (Mo), one shot, AFM image. The bar on the right shows the whole range of heights, but only the range from 0.1 to 0.8 µm is used for the color scale. The profile along the horizontal line y = 47.8 µm (see arrows) is shown below the two-dimensional image.
Figure 8 shows the trench position with respect to the damaged area as well as the trench-wall view both outside the irradiated area and near the center of the damage pattern. Mo has (similarly to W) a porous structure (see Fig. 8, arrows “A”, arrows “B”), but the pores are larger here. The closed ones (Fig. 8, arrows “A”) are filled with gas persisting there from production; if such pores are close to the target surface, the incident laser pulse can melt their lids and explosively escaping gas throws this material to the surrounding of the crater. It is supposed that the continuous carbon layer (as thick as 60 nm – see Fig. 8, arrows “C”) at the damage pattern periphery (low laser fluence) comes from residuum of diamond-containing polishing suspension sitting in open pores (carbon is detected there by X-ray energy-dispersive spectrometry detector – see Discussion section). On the other hand, inside the irradiated area (larger fluence), the carbon contamination is fully removed by a single laser shot. However, in contrast to W, a single laser shot is not capable to fully remove the whole surface layer modified by polishing, which is somewhere up to 700 nm thick. Finally, the energy deposition of a single laser shot creates numerous cracks on the surface; one of them was found on the trench-wall image (see Fig. 8, arrows “D”) propagating into a depth of ~1.5 µm.
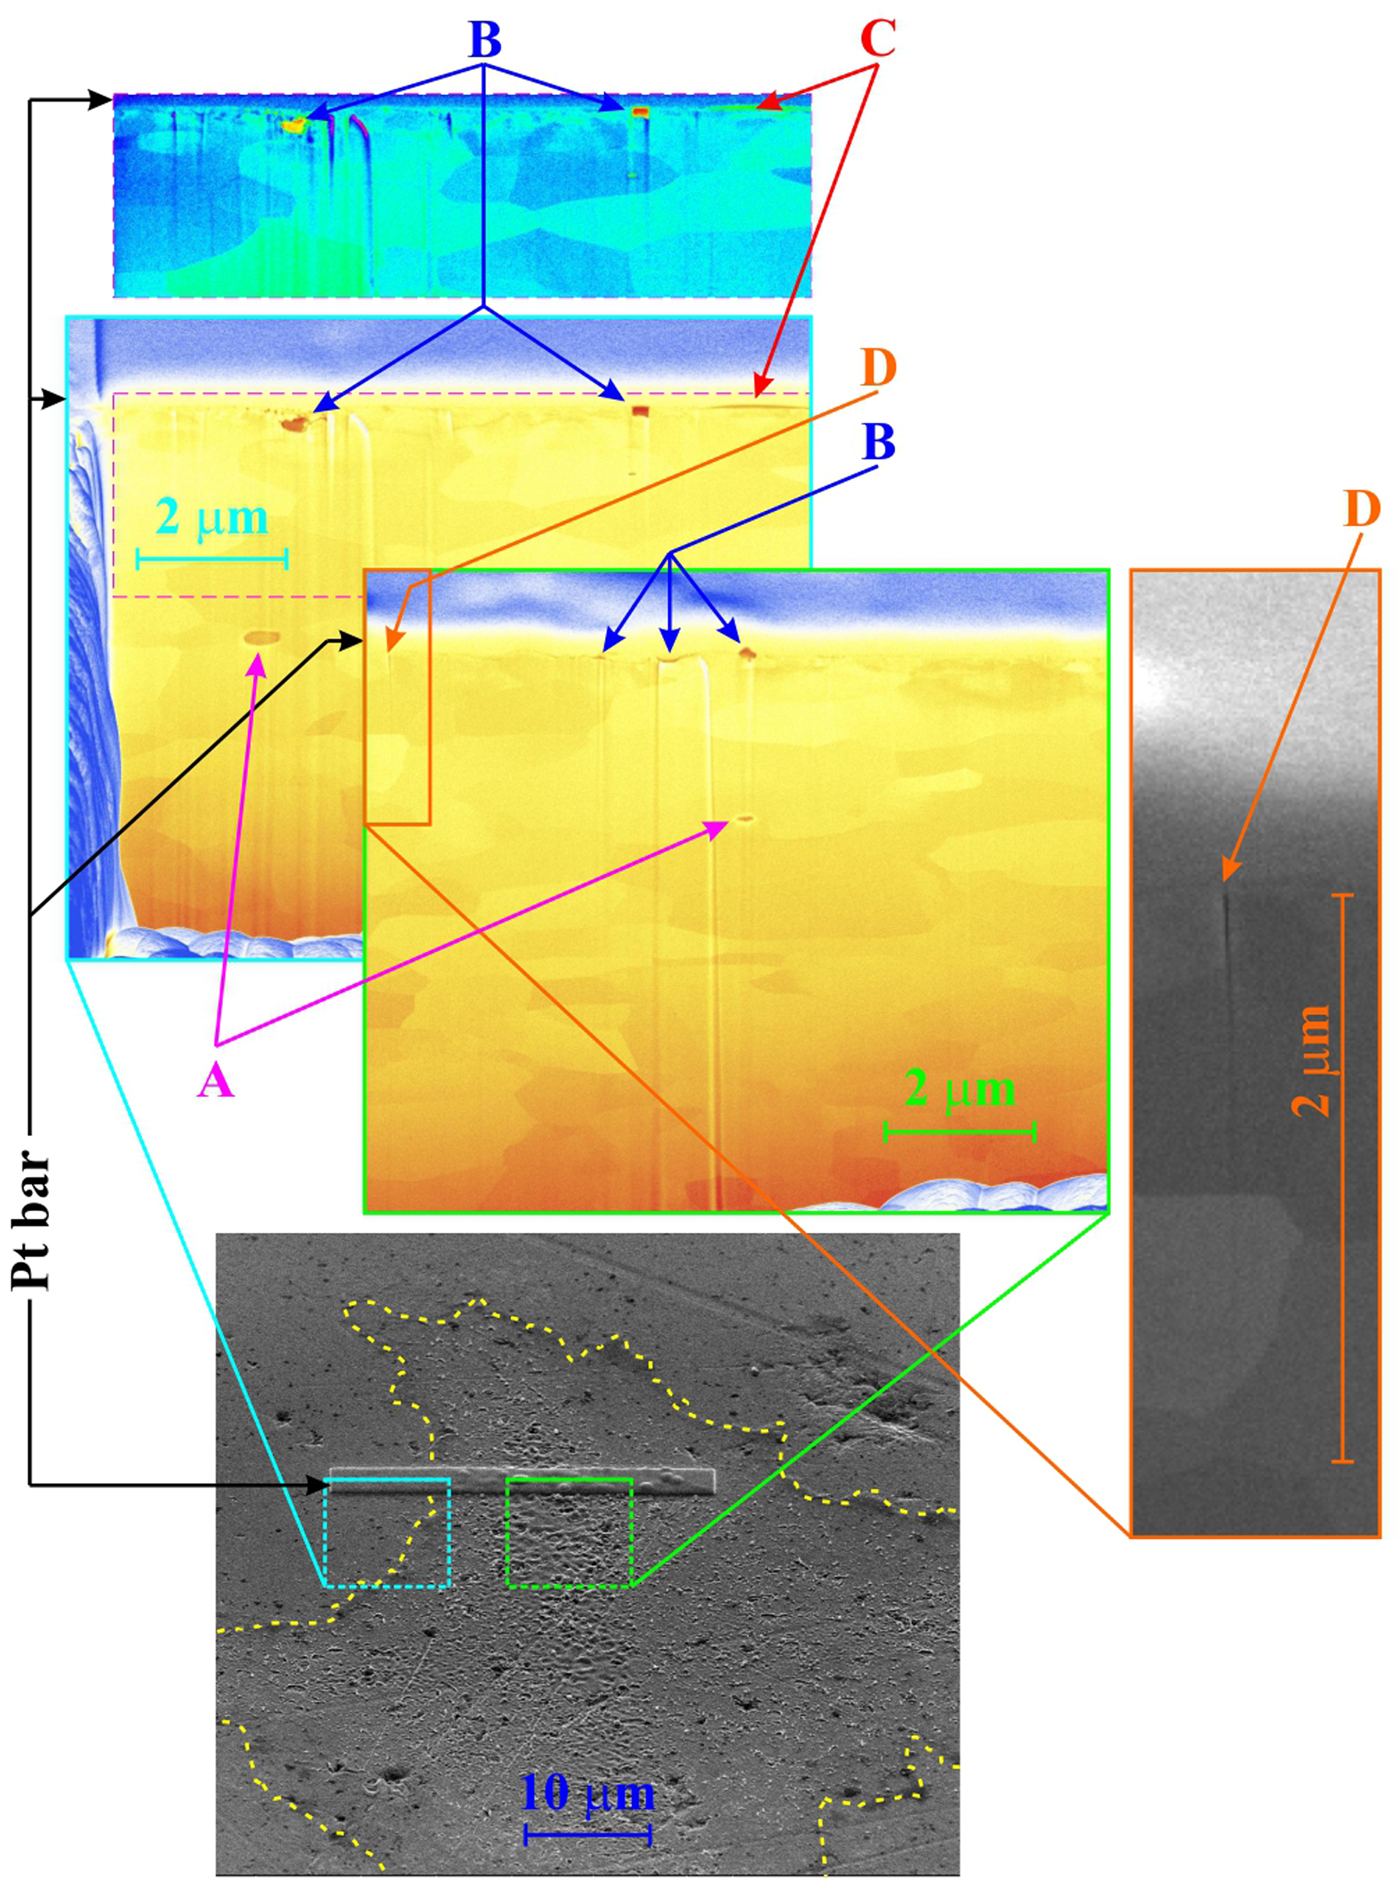
Fig. 8. Molybdenum (Mo), one shot, SEM trench-wall view (tilt 52o): bottom: the trench position related to the damage pattern, top left: the blown-up part of the trench-wall partly outside of the damage pattern; the sub-surface layer in the same enlargement, but in different false colors is shown above the blown-up part, top right: the blown-up part of the trench-wall in the laser-modified area. A crack appearing in the top right figure (“D”) is shown in higher enlargement on the right side of the figure.
Damage pattern created by 20 accumulated shots
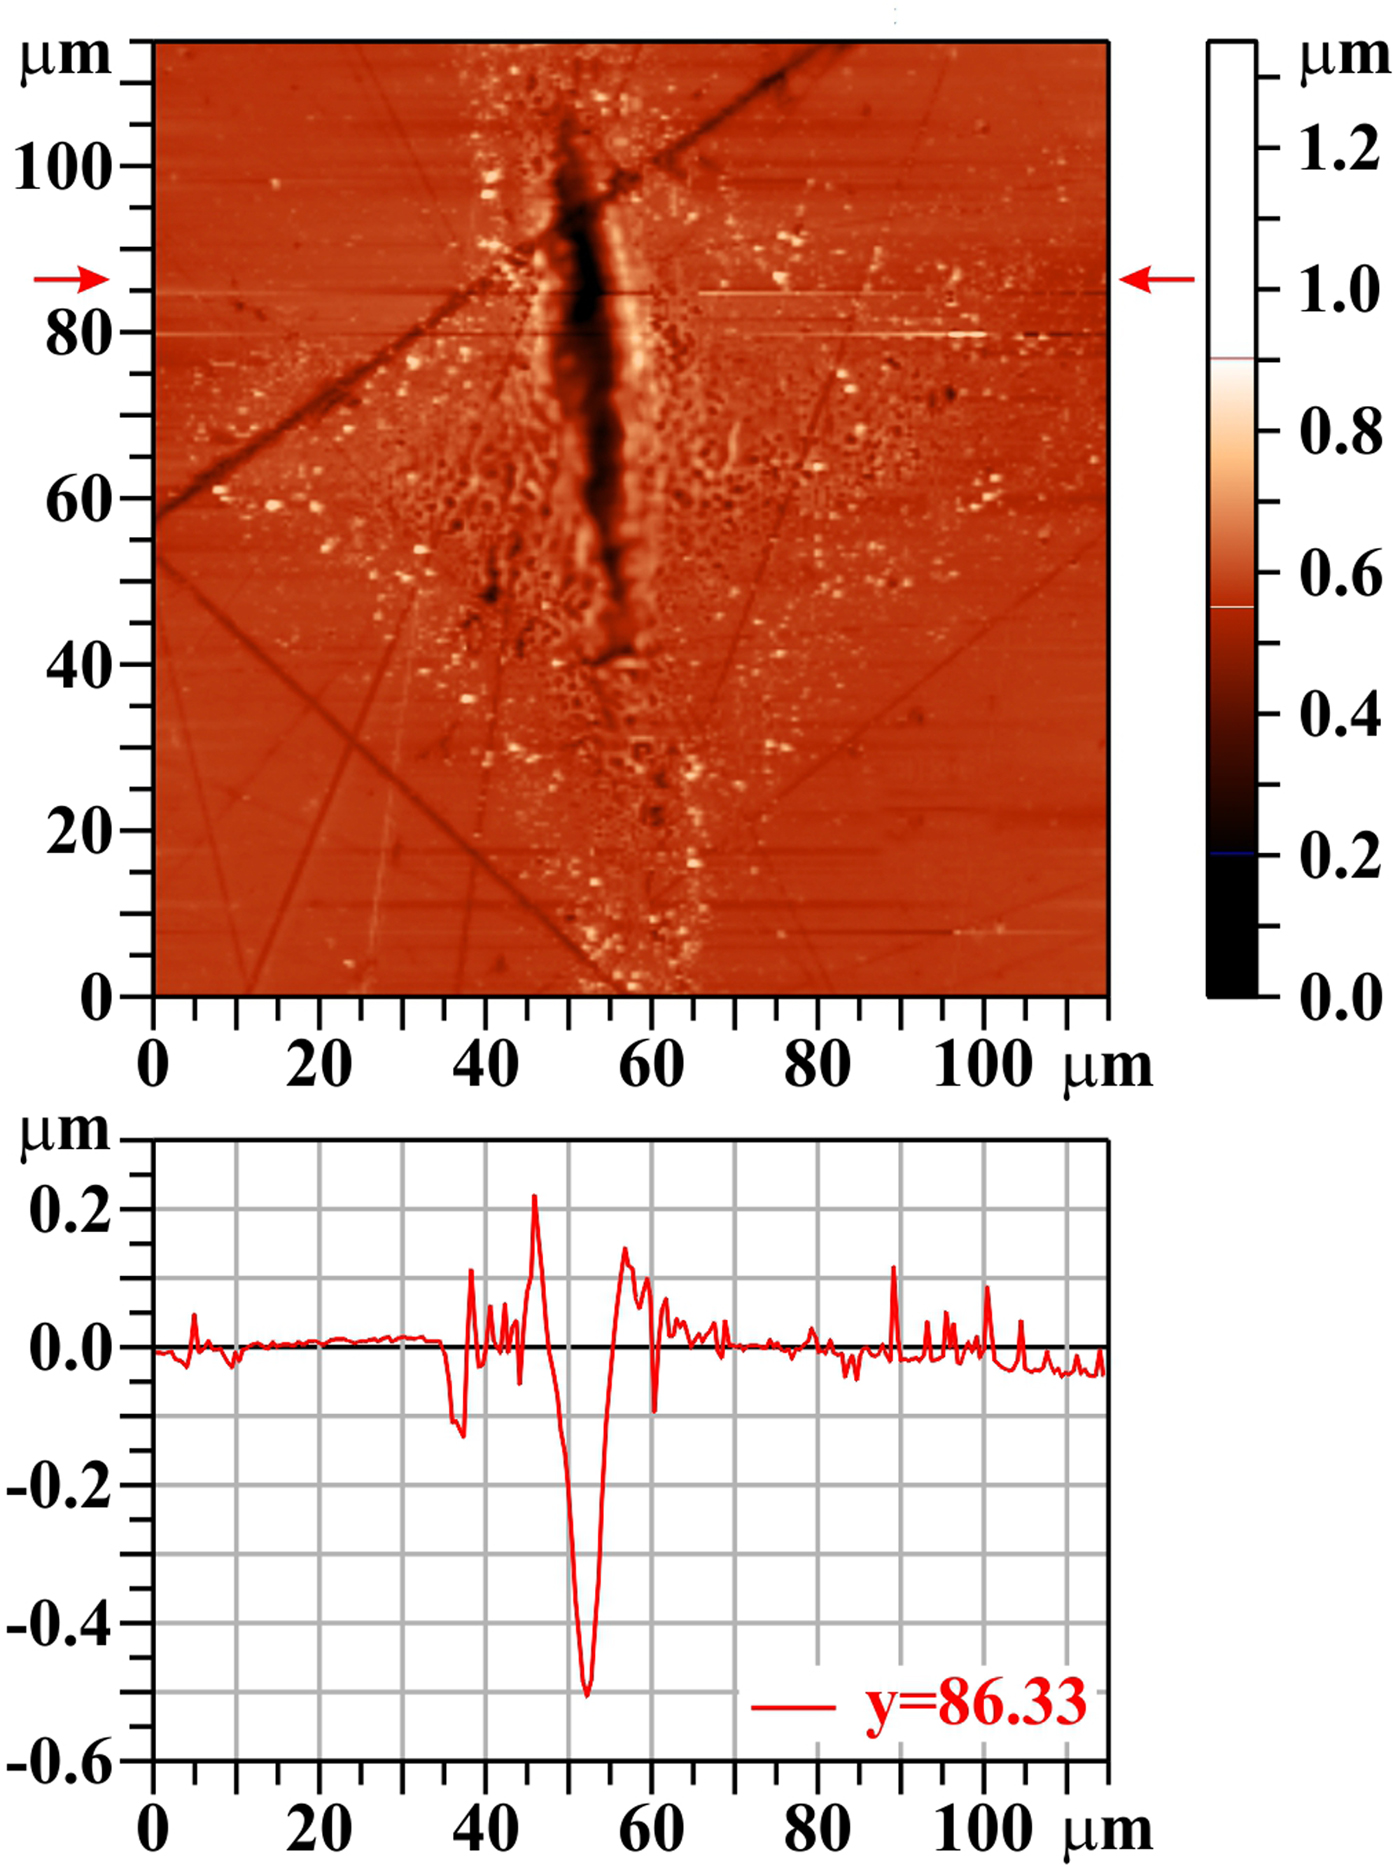
A larger number of shots fired at the same area produces a deep crater in the focal spot center with a rim on its sides (see Fig. 9). The trench showing the sub-surface structure (see Fig. 10) goes through the crater bottom: outside of this crater, but still inside of the laser-illuminated area (with reduced fluence), there is a visible ~0.7 µm-thick layer influenced by polishing: the crystal grains are much smaller (characteristic dimension is ~300 nm) and their surface is rough or diffuse. On the other hand, in the crater bottom, this influenced layer is totally removed and the grain structure is exactly the same as in the deeper parts of the target; no signs that could be attributed to volume-melting process have been observed.

Fig. 9. Molybdenum (Mo), 20 shots, AFM image. The bar on the right shows the whole range of heights, but only the range from 0.2 to 0.9 µm is used for the color scale. The profile along the horizontal line y = 86.33 µm is shown below the two-dimensional image.

Fig. 10. Molybdenum (Mo): 20 shots, SEM trench-wall view (tilt 52o): bottom: the trench position in the damage pattern, middle: the blown-up part of the trench wall in the crater bottom, top left: the blown-up part of the trench wall on the side of laser-modified area (with reduced fluence).
Silicon carbide
SiC structure
SiC can exist in more than 250 different crystalline structures (Cheung, Reference Cheung2006). The polymorphism of SiC is characterized by a large family of similar crystalline structures called polytypes. They are variations of the same chemical compound that are identical in two dimensions and differ in the third. Thus, they can be viewed as layers stacked in a certain sequence. Their crystalline structure is either cubic (C), or hexagonal (H), or rhombohedral (R); the number before the letter characterizing the lattice type denotes the number of layers in the primitive cell. The simplest SiC form is β SiC modification [3C (β) SiC – cubic lattice built up as three repeating layers 1,2,3;1,2,3]; the most common SiC polymorph is α SiC modification [6H (α) SiC – hexagonal lattice with six repeating layers 1,2,3,1,3,2;1,2,3,1,3,2]. Comparison of Raman back-scattered spectrum acquired from virgin (unexposed) part of our sample confirmed that subject of our investigation is namely this 6H (α) SiC with minimum disorders/distortions [all the 13 lines of this polymorph lying above 200/cm (Nakashima and Harima, Reference Nakashima and Harima1997) were identified with accuracy ±2/cm] and no additional line was detected. However, in a hole in virgin surface, the scattered spectrum dramatically changes: besides the characteristic lines for SiC, the bands D and G [characteristic for vibrations of C–C sp 2 bonds (Sorieul et al., Reference Sorieul, Costantini, Gosmain, Thomé and Grob2006)] as well as the line 1331/cm (characteristic for diamond) appear. This is evidently due to a residuum of polishing pasta that contains graphite and diamond microcrystals and that has not been removed at the final cleaning.
Damage pattern created by five accumulated shots
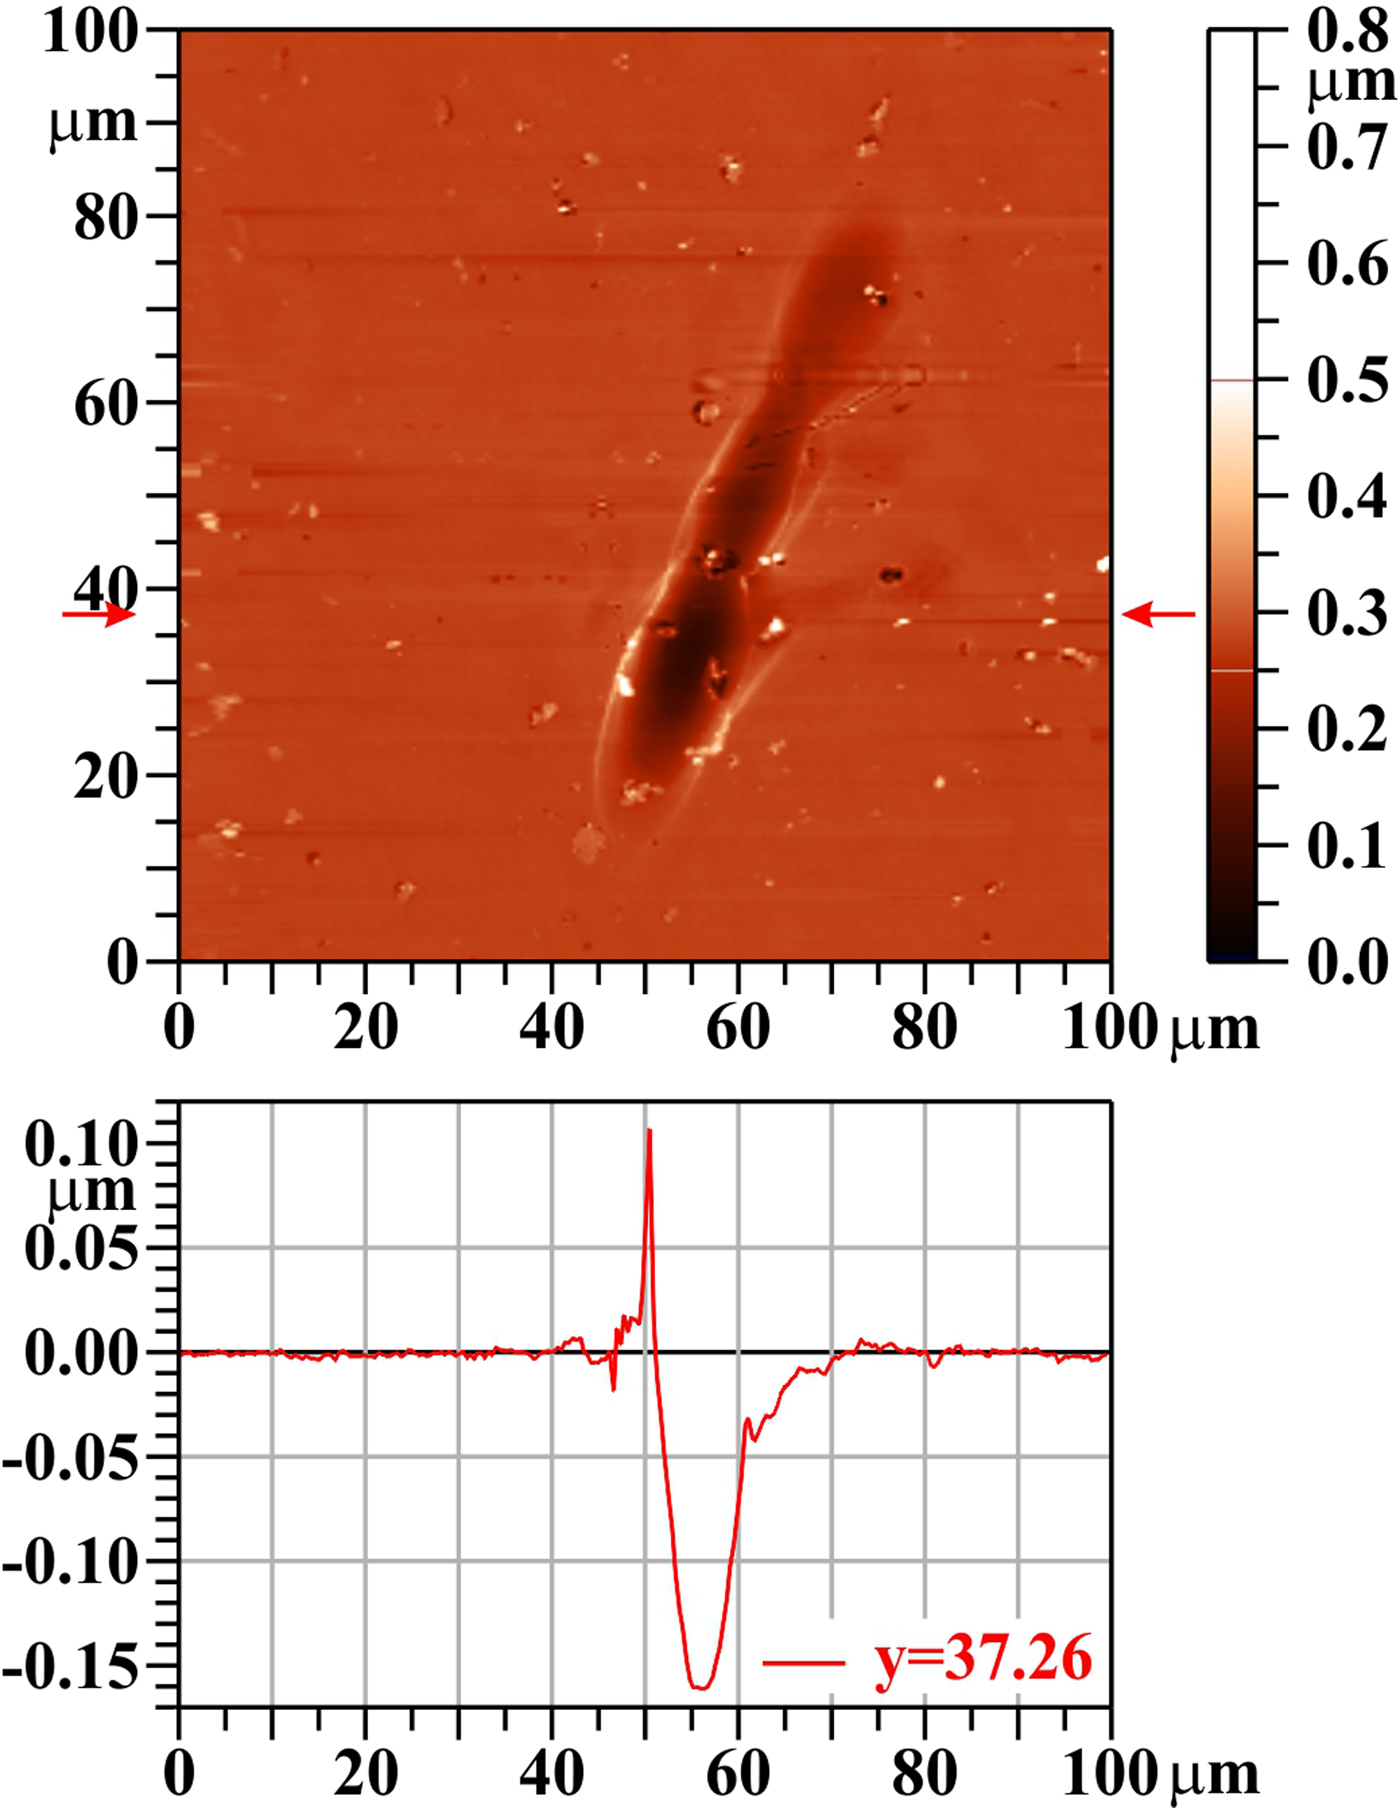
Since it is very difficult to localize the surface damage made by a single laser shot on the SiC sample, the result with five accumulated shots is presented. The macroscopic lattice distortions (holes) are much larger and less numerous than pores in W and Mo. Therefore, it is also less probable that some closed cavities containing gas are located close to the surface. Similarly, because SiC sublimates, there is no melting layer with bursting bubbles. Due to that, the craters created at interaction of the laser with SiC have a smooth surface (Fig. 11) modified only by the abovementioned large opened holes. In contrast to W and Mo, the SiC single-crystalline structure is very compact: there are no traces of delamination of the surface layer with subsequent overheating and rounding of chips’ edges. Finally, because SiC sublimates (as was mentioned above), there is no re-solidification of liquid material. Although some tension in the target can be induced by rapid heating/cooling at/after laser – target interaction, no cracks have been observed. Raman scattering spectra measured inside the damage patterns showed that besides the lines characteristic for 6H (α) SiC polytype (to the most intense belong four lines with wave-numbers 767, 789, 797, and 965/cm), also the band characteristic for vibrations of Si–Si bonds, as well as both the abovementioned D and G bands characteristic for vibrations of C–C bonds appear. It means that some fraction of SiC lattice was disintegrated by XUV radiation creating immediately new homo-nuclear bonds and these new compounds remained on the sample surface [similarly as at heavy-ion bombardment (Sorieul et al., Reference Sorieul, Costantini, Gosmain, Thomé and Grob2006)]. A weak diamond line was detected even in the holes exposed to low fluence (periphery of the laser beam footprint); on the other hand, no diamond line was found in the holes irradiated by high fluence (ablation area).

Fig. 11. Silicon carbide (SiC), five shots, AFM image. The bar on the right shows the whole range of heights, but only the range from 0.0 to 0.5 µm is used for the color scale. The profile along the horizontal line y = 37.26 µm is shown below the two-dimensional image.
The localization of the laser-induced damage patterns created by one or five laser shots is very difficult either on SEM: there is a very shallow crater with practically no contrast (see upper part of the Fig. 12 registered by the detector sensitive to back-scattered electrons). However, as soon as the detector registering the secondary electrons (originating in smaller depth than the back-scattered electrons) is used, the whole cross-like laser beam footprint becomes apparent (see lower part of Fig. 12). A possible explanation of this phenomenon is given in the Discussion section.

Fig. 12. Silicon carbide (SiC), five shots, SEM image made by the detector registering the back-scattered electrons (top) and the secondary electrons (bottom).
Damage pattern created by 20 accumulated shots
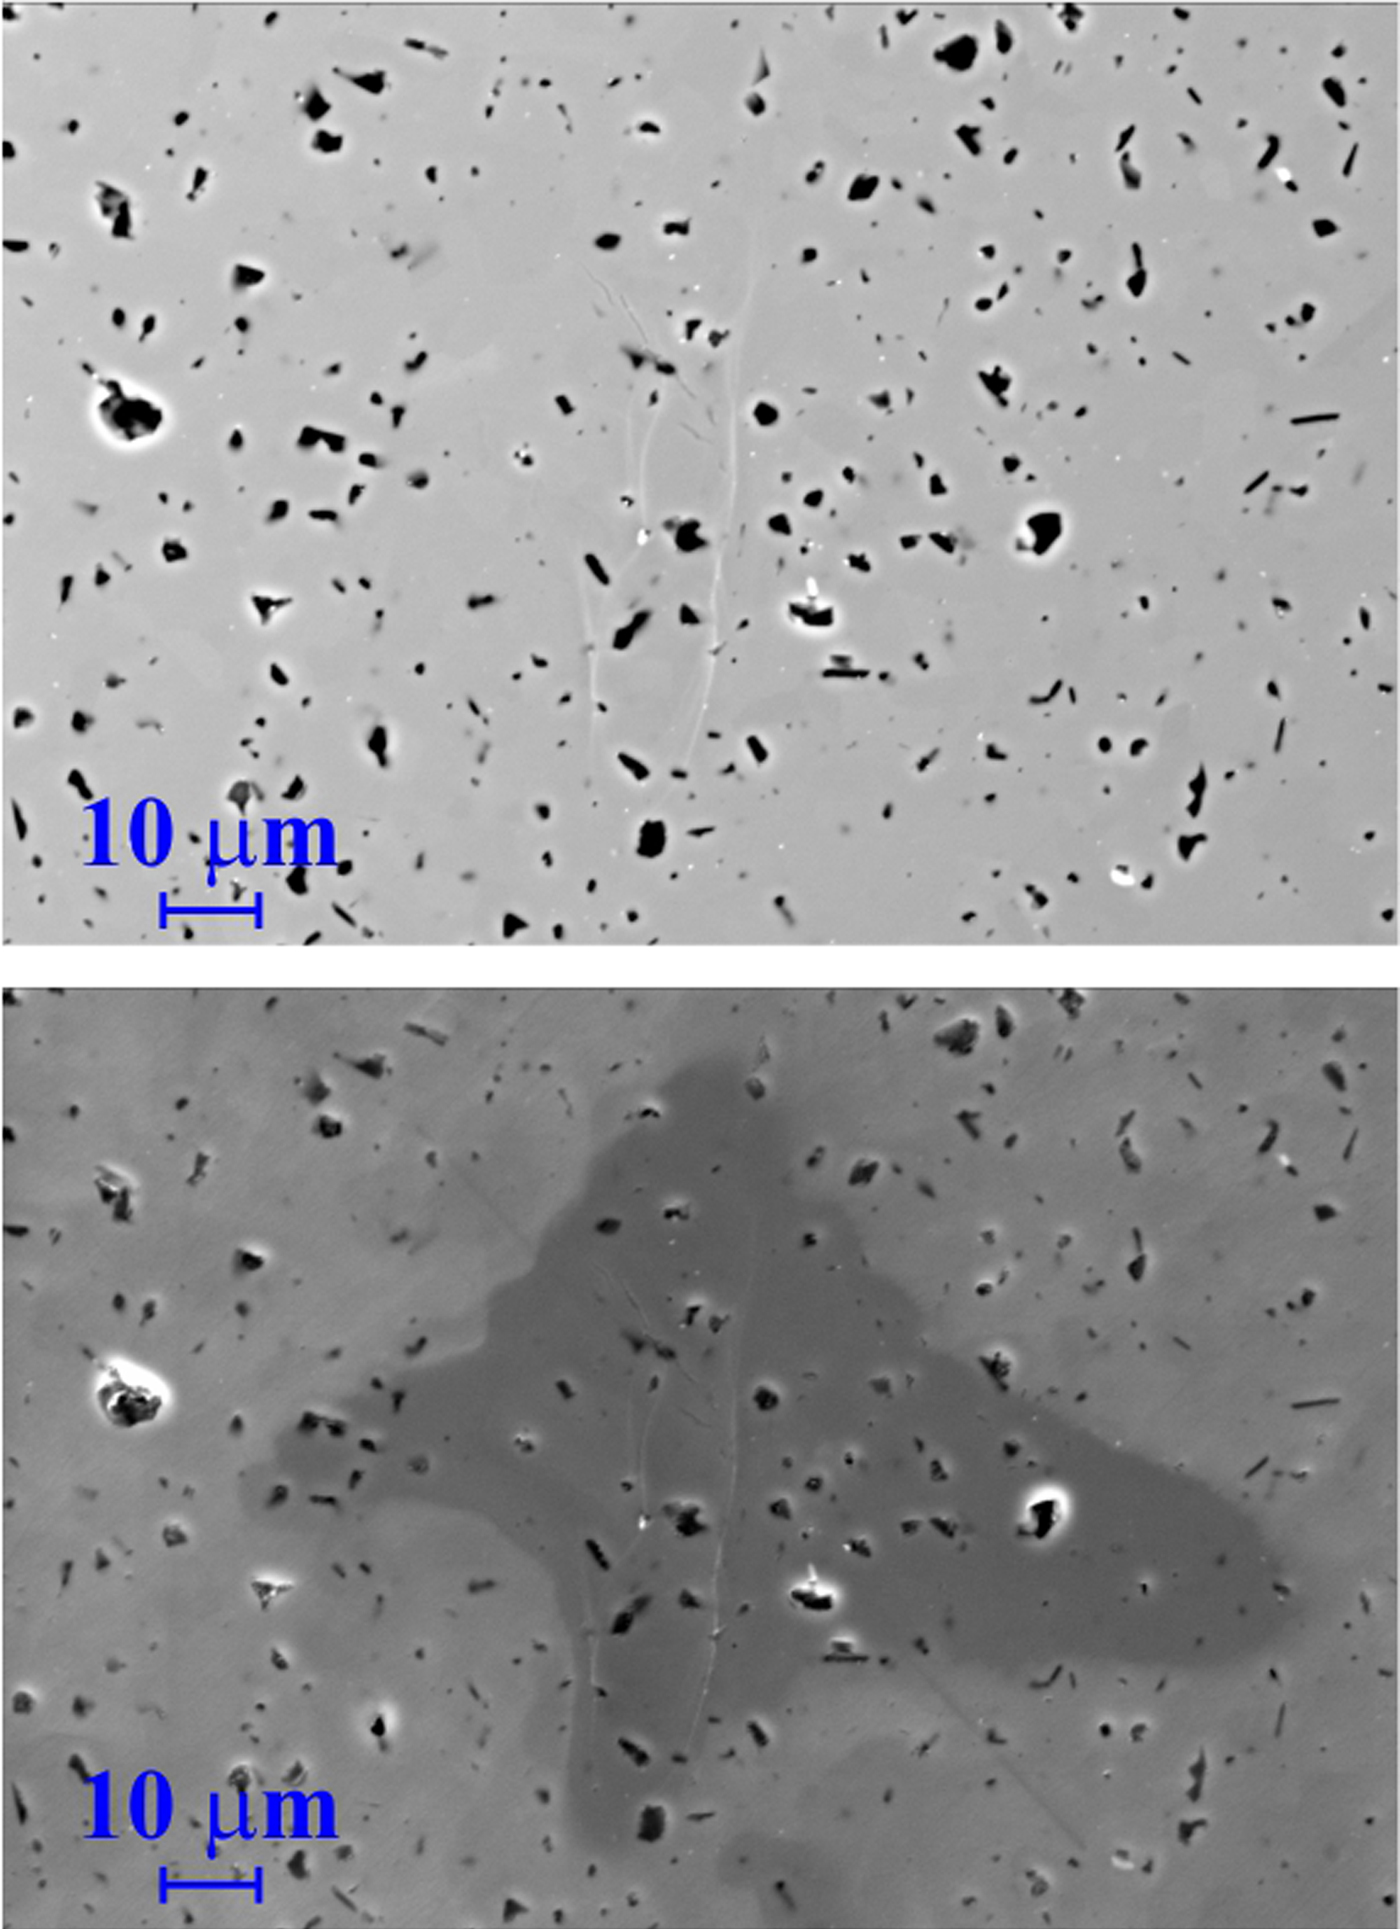
The character of the damage pattern produced by 20 accumulated shots remains the same as mentioned before: the periphery of the laser beam footprint is not visible on the “heights map” registered by AFM. The only remarkable feature is the crater characteristic for the ablation region (not speaking about numerous holes on the whole target surface) – see Figure 13. Also in this case, there is no delamination of the surface layer and no cracks (see Fig. 14). The trench-wall view shows that the target material is rather homogeneous (as a single crystal should be), but a few holes/cavities (see Fig. 14, arrows “A”). The surface of the crater (Fig. 14, arrow “B”) and of the rim (Fig. 14, arrow “C”) around it is as smooth as the surface of the unexposed target part.

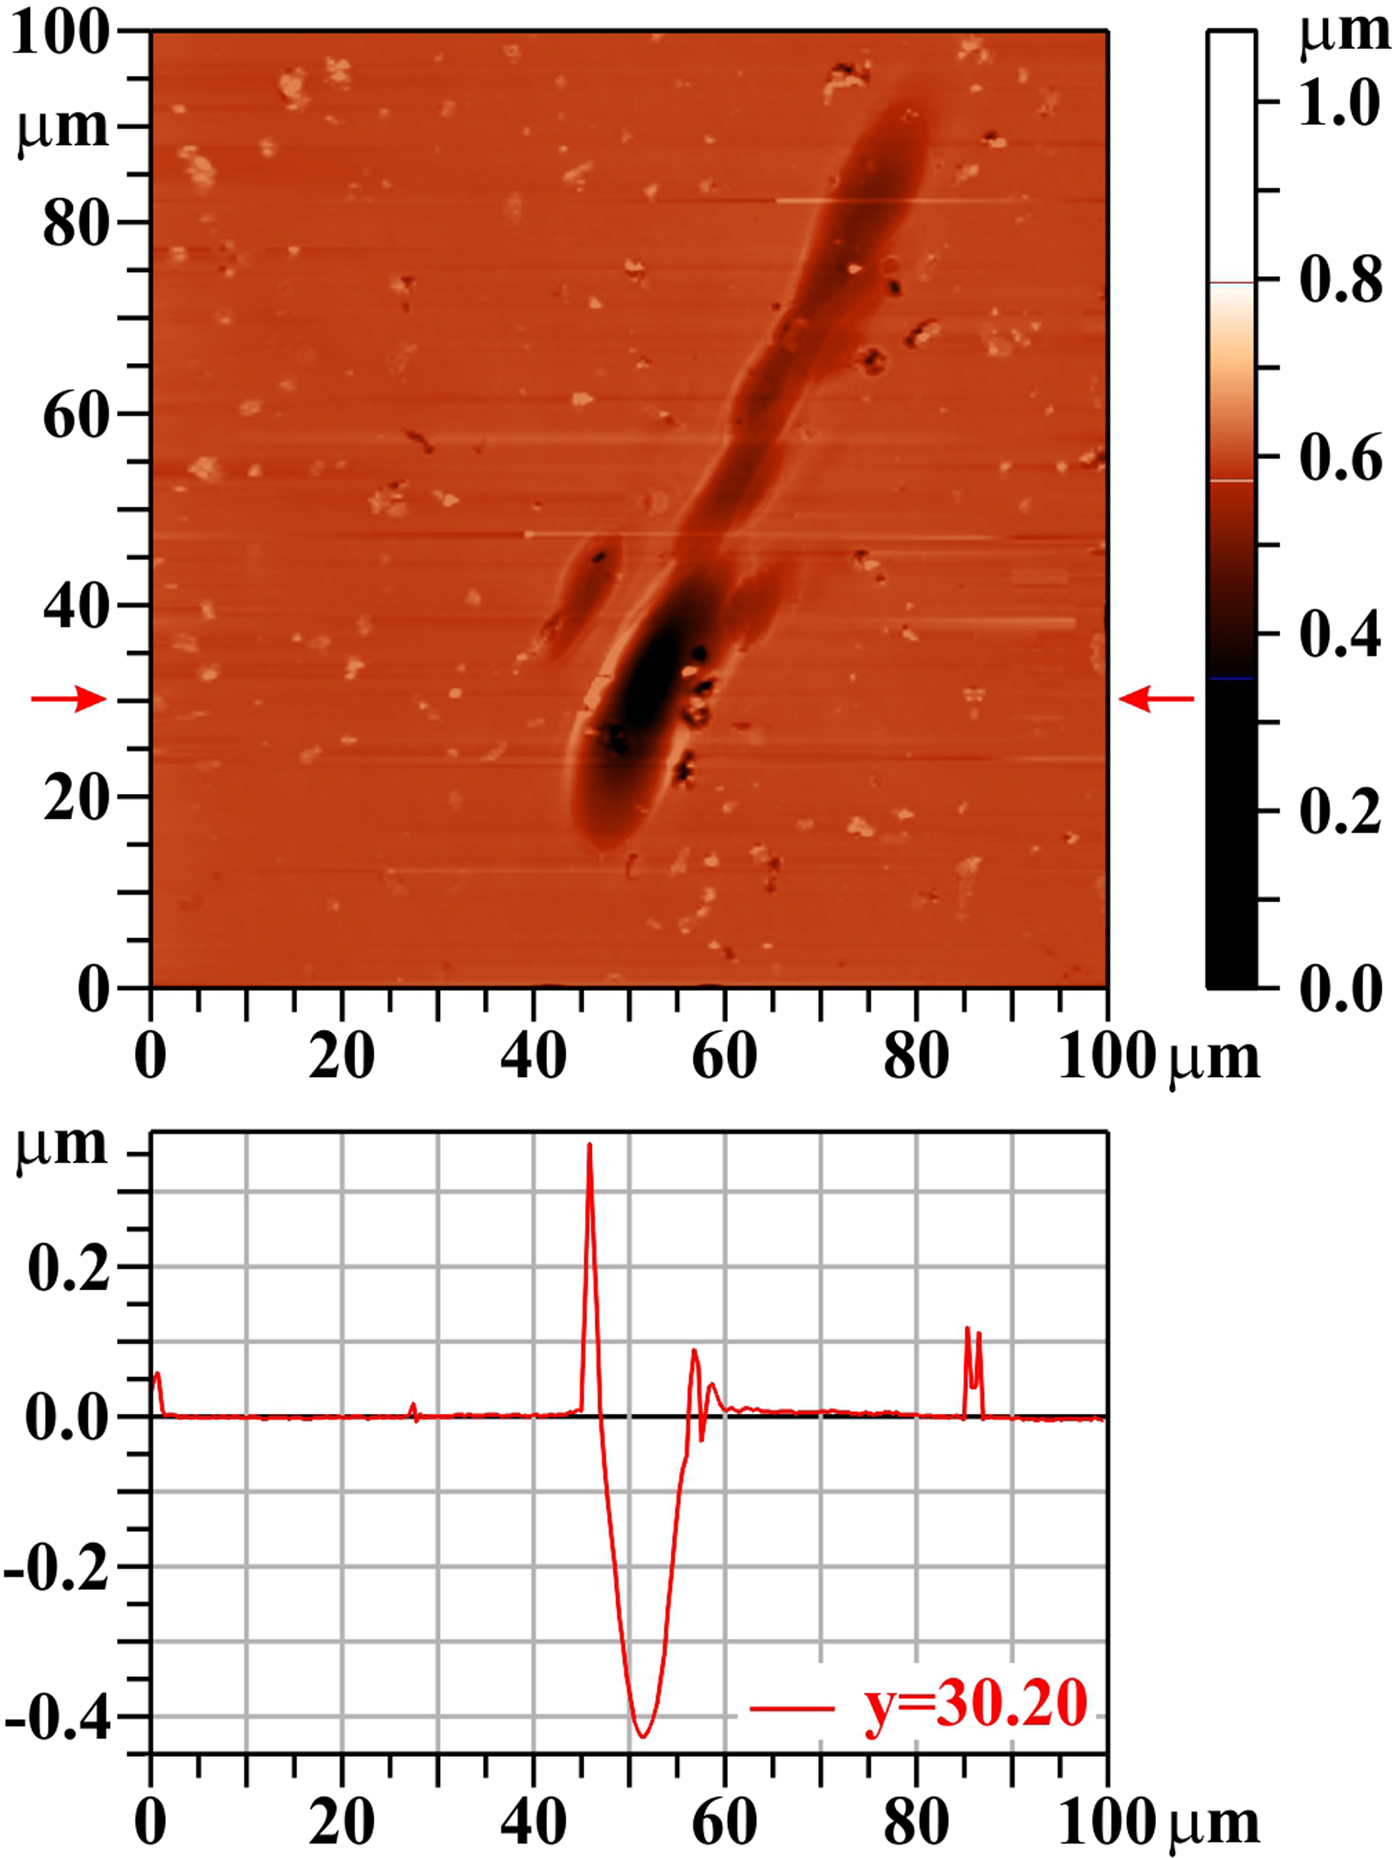
Fig. 13. Silicon carbide (SiC): 20 shots, AFM image. The bar on the right shows the whole range of heights, but only the range from 0.35 to 0.8 µm is used for the color scale. The profile along the horizontal line y = 30.20 µm is shown below the two-dimensional image.

Fig. 14. Silicon carbide (SiC): 20 shots, SEM trench-wall view (tilt 52o): bottom: the trench position in the damage pattern, top left: the blown-up part of the trench wall outside of the laser ablation area (with reduced fluence), top right: the blown-up part of the trench wall showing section of the left part of the crater as well as that of the rim around it.
Discussion
As mentioned in “Experimental apparatus and methods” section, the target was placed approximately in the mid plane between tangential and sagittal foci. Due to that, the laser beam footprint pattern (namely its low fluence part) has a “cross” shape. A more pronounced central vertical line (ablation area – the crater) says that the target was slightly closer to the tangential focus; a more enhanced end part of this crater (visible mainly at SiC sample) results from mirror imperfection. Since any image rotation different from multiples of 90° causes transformation errors (both in the details and in the size), all the damage pattern pictures presented in “Results of irradiation” section are reproduced exactly as yielded by the diagnostic instruments, that is, arbitrarily, depending only how the individual samples were inserted there.
A capillary cleaning process includes laser disassembling and reassembling. Due to that, in various series, a different part of focusing mirror was used, which resulted in slightly different crater morphologies from sample to sample. However, in no case, any spontaneously appearing periodic surface structures (like in Kolacek et al., Reference Kolacek, Straus, Schmidt, Frolov, Prukner, Shukurov, Holy, Sobota and Fort2012, or in Gemini et al., Reference Gemini, Margarone, Trusso, Juha, Limpouch, Mocek and Ossi2013) have been observed.
Each sample was irradiated one day. During first few shots, the laser radiation was attenuated by two Al filters (of the thickness 0.4 + 0.8 µm – to prevent the diode saturation) and monitored by windowless vacuum photodiode (Kolacek et al., Reference Kolacek, Schmidt, Straus and Frolov2015a). When the energy of the laser pulse was stabilized, the filters and the diode were retracted and the target was exposed shooting once when the target was in the first position, five times when the target was in the second position, ten times in the third position, 20 times in the fourth position, and sometimes even 50 times in the fifth position of the target. Each ~25 shots, the laser energy was monitored again, confirming that the energy remains in ±10% error limit. However, the day-to-day reproducibility was worse and we gave up finding exactly the same working regime (see Fig. 17, different energy at individual samples). In fact, it is possible to adjust and stabilize after re-starting a similar regime to the previous one, but it takes longer time (a few hours), and in this case, it is difficult to fulfil the complete daily program prescribed for irradiation of one sample.
Due to relatively large distance between capillary output and focusing mirror (approx. 2.6 m), the ratio of laser fluence to background (incoherent broadband capillary discharge) fluence there (at the mirror) is >100 (time-integrated case); a further increase of this contrast (approximately 100 times) is caused by selective reflectivity of Sc/Si multilayer mirror tuned at quasi-normal incidence to the laser wavelength (~47 nm). Due to this large laser-background radiation contrast, the influence of background radiation can be neglected.
The grinding and polishing of the targets by diamond-containing polishing medium (pasta/suspension) should be mentioned also as a contaminating agent: their residua were found practically in all opened pores and holes (even after standard cleaning – see Fig. 15, where unexposed parts of samples’ surfaces are shown as seen by both the secondary electrons/back-scattered electrons detector and by the X-ray energy-dispersive spectrometry detector tuned to carbon). However, already the first laser shots are capable to remove these polishing remnants from the surface of W and Mo (see Fig. 16; the yellow lines show roughly the exposed area, from where carbon was removed, the yellow circles show extra-deep pores in which carbon survived). On the other hand, on the surface of SiC, the silicon is probably removed first leaving carbon naked on the surface (see Fig. 12).
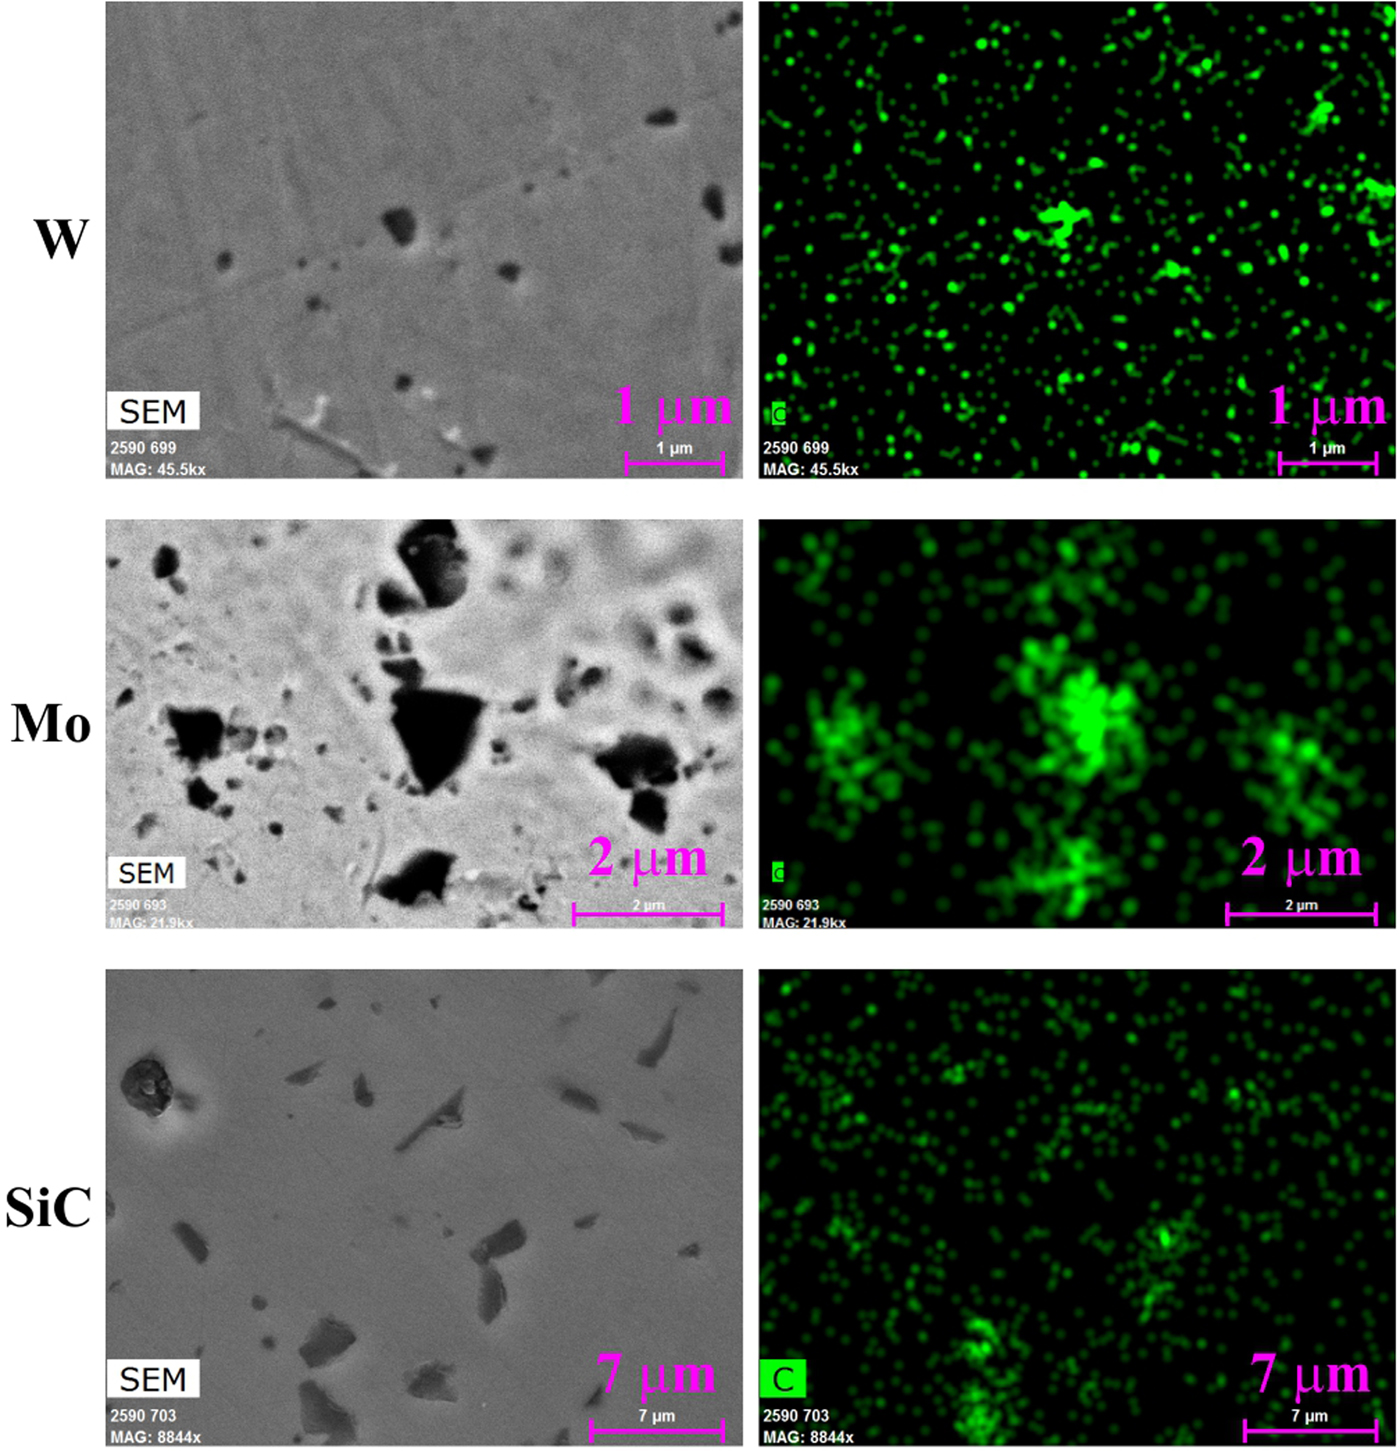
Fig. 15. Unexposed parts of the samples’ surfaces as seen by the secondary electrons detector (left column top and bottom) or back-scattered electrons detector (left column middle) and by the X-ray energy-dispersive spectrometry detector (right column). First row: tungsten, second row: molybdenum, third row: silicon carbide.
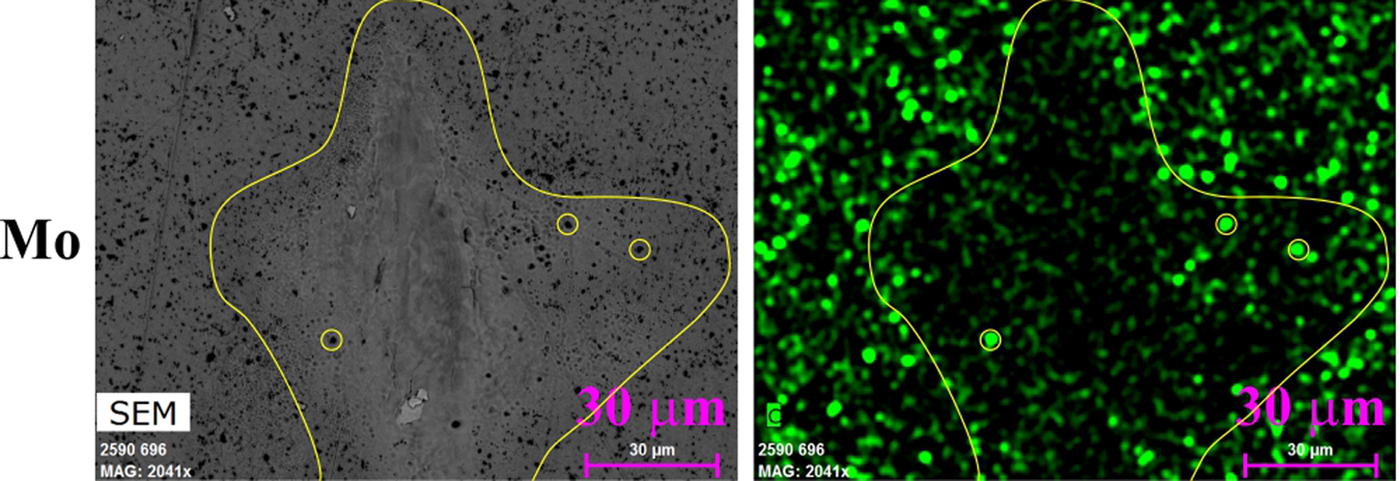
Fig. 16. Molybdenum (Mo), laser-exposed area is marked by a solid line. Left: image by back-scattered electrons detector. Right: image by X-ray energy-dispersive spectroscopy detector highlighting carbon.
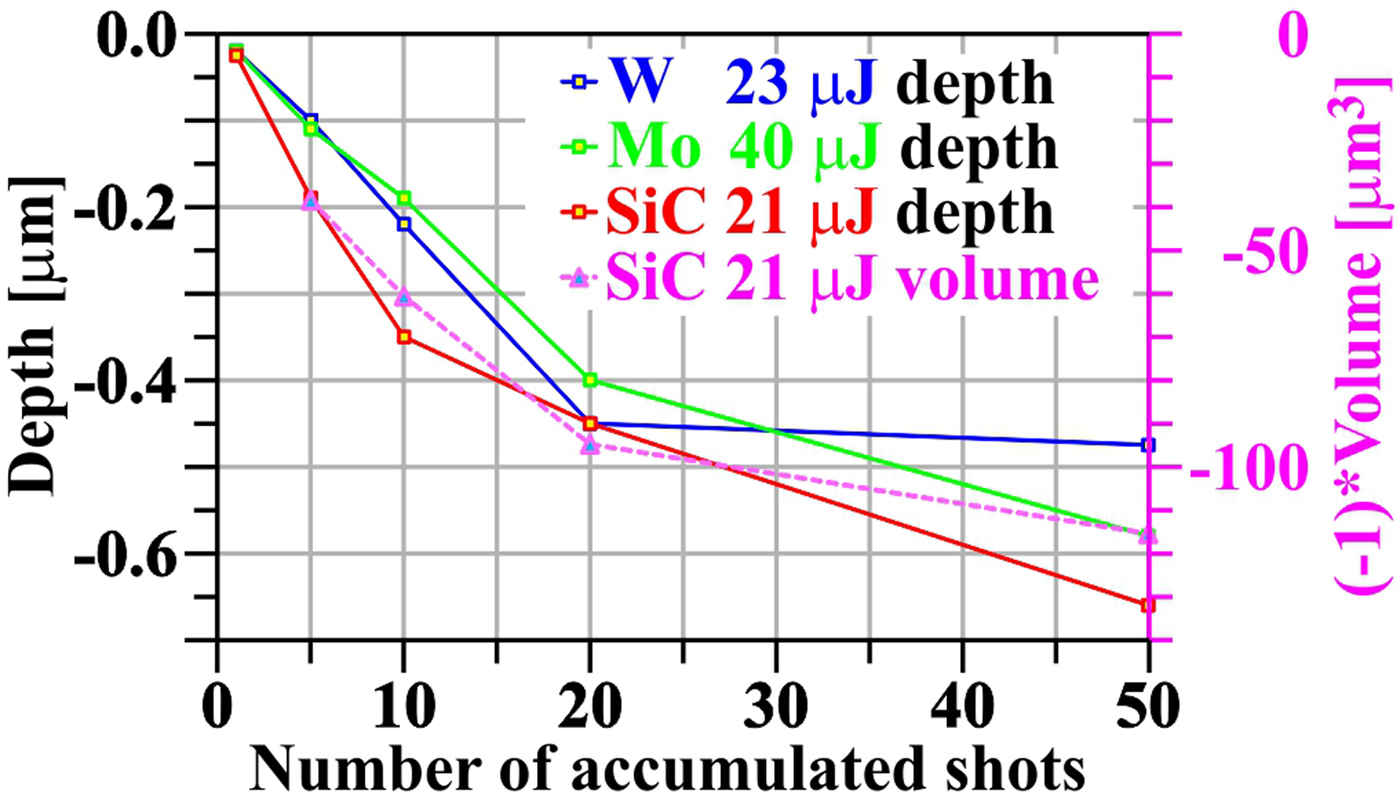
For each target, the “maximum” crater depth (meaning minimum of approximation curves that eliminate in each profile local surface imperfections like grains or pores) as a function of number of accumulated shots was evaluated (see Fig. 17). It seems that for all three target materials, the crater depth increases relatively fast up to ~20 accumulated shots, but at more accumulated shots, this enlargement slows down, and for W nearly stops. It may be explained either by hardening of metallic bonds (see, e.g. Kabeer et al., Reference Kabeer, Zijlstra and Garcia2014), or by different ablation rate in the surface layer modified by polishing and in the bulk material. For the second interpretation speaks the fact that the function of crater deepening with a number of accumulated shots changes its derivative approximately in the depth corresponding to the thickness of polishing-modified layer at Mo and W. Against this interpretation speaks the fact that SiC does not have such a polishing modified layer, but a non-linearity of deepening function has been also observed.

Fig. 17. Crater depth (and volume) as a function of number of accumulated shots.
An attempt was made to evaluate the ablated volumes. However, it turned out that due to arbitrariness of the choice of zero level of integration as well as due to the grains, re-solidified material and pores in/out of the damage pattern (that also contributed to the integral), the errors were huge. Therefore, for at least qualitative insight, the AFM heights maps of SiC – the simplest material (from ablation point of view) – with damage patterns (craters) were digitally cleaned and integrated. The result is shown also in Figure 17. The fact that the ablated volume changes with the number of accumulated shots similarly as the crater depth means that the ablated area does not change significantly with the number of accumulated shots and that the only change goes into crater deepening.
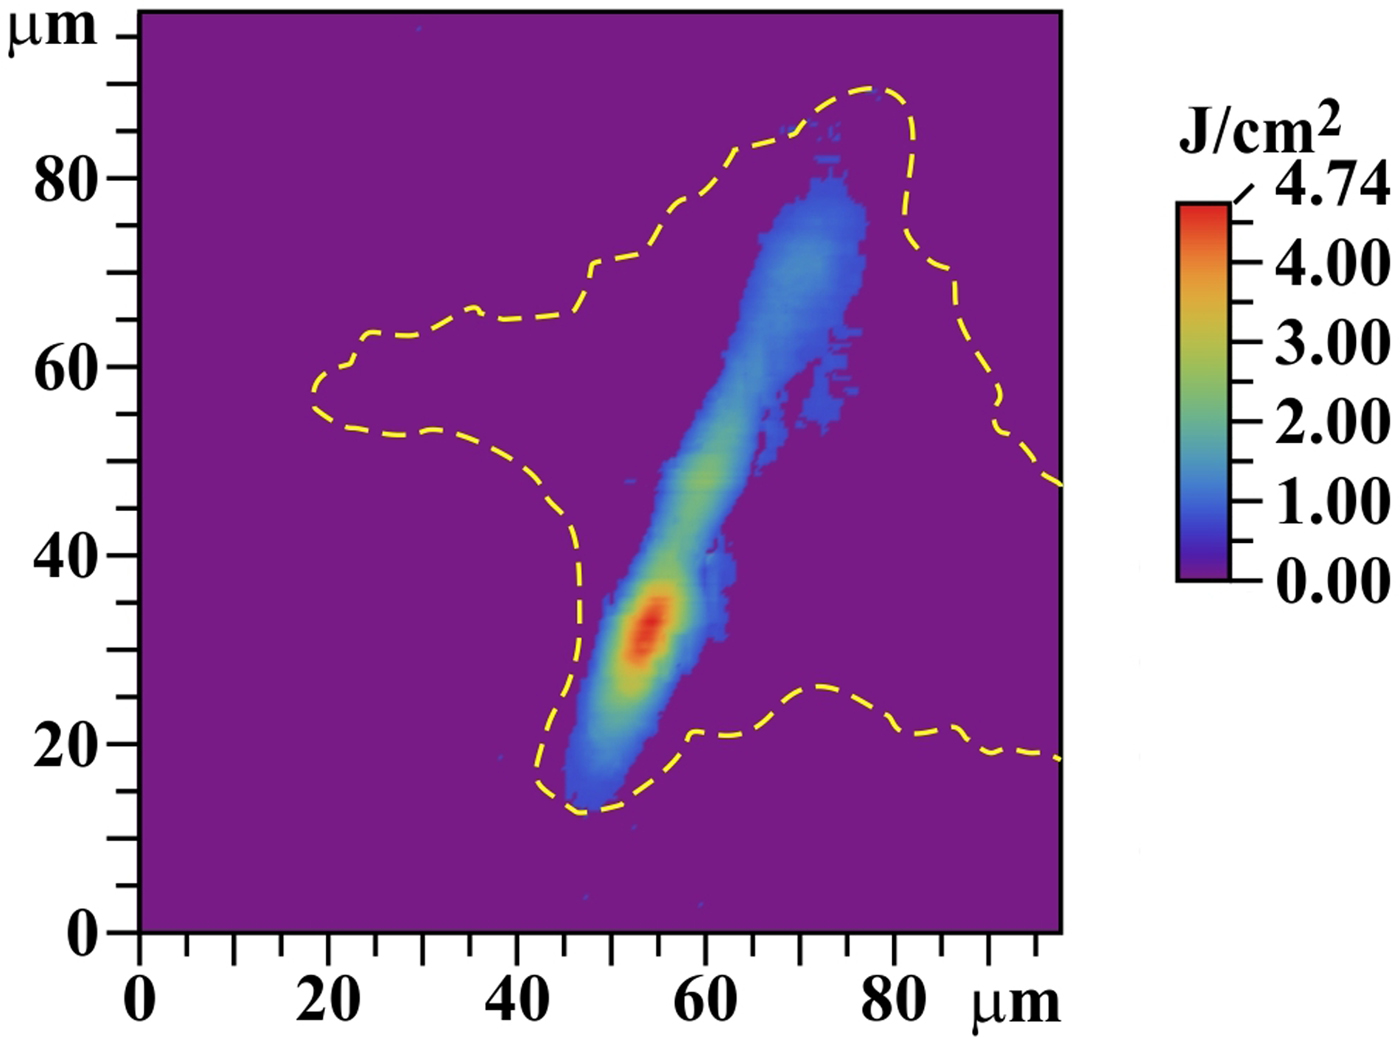
The cleaned AFM heights map for five accumulated shots on the SiC target was also used for the determination of a local fluence map (see Fig. 18; compare also with the upper part of Fig. 11). Supposing that the particle-removal efficiency in the ablation area is 100% (Kolacek et al., Reference Kolacek, Schmidt, Straus, Frolov, Juha and Chalupsky2015b), then it is possible to relate the crater negative depth map to the local fluence map, in which the heights integral is re-normalized to the 40% of the whole incident laser energy. This relatively small fraction of the incident energy is the result of a fitting procedure, at which we tried to adjust crater dimensions [diameter of “equivalent circle” (as to area) and depth] to thermal effects of Gaussian beam with a given total energy and given footprint area (see later in this section). It is estimated (and this is why the ablation threshold cannot be exactly determined in our experiments) that 10% of the whole incident energy is reflected and scattered, and next 50% is deposited in the laser footprint area, but outside the ablation crater area of SiC; an indirect confirmation that the fraction of this energy deposited outside the SiC ablation area may be so large is the fact that there, in case of W and Mo, some melting is also observed. An alternative explanation, why the ablated crater corresponds to remarkably smaller energy than the incident energy is given later in this section.

The traditional measuring methods of XUV fluence distribution [scintillator-based measurements (Jaeglé et al., Reference Jaeglé, Sebban, Carillon, Jamelot, Klisnik, Zeitoun, Rus, Nantel, Albert and Ros1997; Pikuz et al., Reference Pikuz, Faenov, Matsuoka, Matsuyama, Yamauchi, Ozaki, Albertazzi, Inubushi, Yabashi, Tono, Sato, Yumoto, Ohashi, Pikuz, Grum-Grzhimailo, Nishikino, Kawachi, Ishikawa and Kodama2015; Krzywinski et al., Reference Krzywinski, Andrejczuk, Bionta, Burian, Chalupský, Jurek, Kirm, Nagirnyi, Sobierajski, Tiedtke, Vielhauer and Juha2017), Shack–Hartmann wave front sensor (Le Pape et al., Reference Le Pape, Zeitoun, Idir, Dhez, Rocca and Francois2002)] encounter in/near laser beam focus some problems connected with high intensity, small focus dimensions, and partial coherence. The modern methods [ptychographic imaging (Schropp et al., Reference Schropp, Hoppe, Meier, Patommel, Seiboth, Lee, Nagler, Galtier, Arnold, Zastrau, Hastings, Nilsson, Uhlen, Vogt, Hertz and Schroer2013), combination of irradiated sample with diffraction grating (Schneider et al., Reference Schneider, Gunther, Pfau, Capotondi, Manfredda, Zangrando, Mahne, Raimondi, Pedersoli, Naumenko and Eisebitt2018)] have either rather complicated evaluation (Schropp et al., Reference Schropp, Hoppe, Meier, Patommel, Seiboth, Lee, Nagler, Galtier, Arnold, Zastrau, Hastings, Nilsson, Uhlen, Vogt, Hertz and Schroer2013), or have not been available earlier (Schneider et al., Reference Schneider, Gunther, Pfau, Capotondi, Manfredda, Zangrando, Mahne, Raimondi, Pedersoli, Naumenko and Eisebitt2018). Therefore, we supposed that SiC behaves in ablative part similarly to PMMA, and following Chalupsky et al. (Reference Chalupsky, Juha, Kuba, Cihelka, Hajkova, Koptyaev, Krasa, Velihan, Bergh, Caleman, Hajdu, Bionta, Chapman, Hau-Riege, London, Jurek, Krzywinski, Nietubyc, Pelka, Sobierajski, Meyer-ter-Vehn, Tronnier, Sokolowski-Tinten, Stojanowic, Tiedtke, Toleikis, Tschentscher, Wabnitz and Zastrau2007), we used the morphology of ablated crater for the construction of local fluence map (see Fig. 18). For that we used abovementioned digitally cleaned AFM heights map of SiC and accepted a number of better or worse fulfilled suppositions: namely we defined that XUV radiation intensity I has a separable space and time dependence:
 $$I(x,y,z,t) = I_o.f\,(x,y,z).g(t),$$
where z is a direction of light propagation, xy is a plane perpendicular to z and parallel to the sample surface, I o is the maximum intensity, f(x,y,z) is a beam spatial intensity distribution, and g(t) is a pulse temporal shape function. The time integration of (1) transforms intensities I(x,y,z,t) to fluencies F(x,y,z). If the beam profile changes negligibly in attenuation length l at (slowly varying envelope approximation), and if the side energy dissipation due to heat penetration can be neglected, then the dependence of F(x,y,z) on z can be neglected, and the fluence on the sample surface can be expressed not only by the integrated Eq. (1), but also by the Lambert–Beer law that relates crater depth d(x,y) with local fluence [starting from d(x,y) = 0, where local fluence is the ablation threshold F thresh]:
 $$\eqalign{ F(x,y,0) & = F_o.f\,(x,y,0) \cr & = F_{{\rm thresh}}.\hbox{exp}[d(x,y)/(5 \times l_{{\rm at}})]} $$
Factor F thresh can be determined from integral F(x,y,0) across the whole ablation (crater) area, which must be normalized to the total energy of the incoming laser pulse E tot reduced by reflected portion E refl [10% (Henke et al., Reference Henke, Gullikson and Davis1993)] and reduced by portion deposited into laser footprint area, but outside ablation (crater) area E abl−out (50% – see above); expression d(x,y)/(5 × l at) in the exponent respects the fact that the crater was engraved by five laser shots:
 $$\eqalign{F(x,y,0) & = \displaystyle{{\hbox{E}_{{\rm tot}} - \hbox{E}_{{\rm refl}} - \hbox{E}_{{\rm abl} - {\rm out}}} \over {\int\!\!\!\int\limits_{{\rm abl} - {\rm area}} {\exp [d(x,y)/(5 \times l_{{\rm at}})]\,dx\,dy}}} \cr & \exp [d(x,y)/(5 \times l_{{\rm at}})]} $$
A more precise construction of local fluence map which takes into account the energy deposited to desorption area [not applicable to us, because d desorp(x,y) = 0 for SiC – see Fig. 11] can be found in Chalupsky et al. (Reference Chalupsky, Juha, Hajkova, Cihelka, Vyšín, Gautier, Hajdu, Hau-Riege, Jurek, Krzywinski, London, Papalazarou, Pelka, Rey, Sebban, Sobierajski, Stojanovic, Tiedtke, Toleikis, Tschentscher, Valentin, Wabnitz and Zeitoun2009). An attempt to take into account thermal effects was made recently by Blejchar et al. (Reference Blejchar, Nevrlý, Vasinek, Dostal, Kozubkova, Dlabka, Stachoň, Juha, Bitala, Zelinger, Pira and Wild2016) when studying interaction of XUV laser with LiF.
While at interaction of infrared, visible, and ultraviolet radiation with solid surface, the non-thermal ablation appears at short (up to ~10 ps) laser pulses only (Buratin et al., Reference Buratin, Bashtova and Kong2017), at interaction of XUV radiation with such surface we can admit that even at ~ns pulses some fraction of ablation can be due to a non-thermal process, because each quantum of this radiation has energy higher than any binding energy in molecules. However, in the first approximation, we included in our modeling the thermal process only (see in more detail Supplementary material). We suppose that Gaussian laser beam with pulse energy Q (propagating in –z direction) with spatial profile exp[−(x 2 + y 2)/w 2] = exp[−r 2/w 2] and δ-function temporal profile falls in the moment t = 0 on a semi-infinite target placed in the half-space z ⩽ 0 and kept at room temperature (T = T R) in the infinity (at r→∞, −z→∞). Then the temperature increase ΔT(R, Z, τ) in dimensionless co-ordinates R = r/w, Z = z/w, τ = t/t 0 and dimensionless W = w/l at (l at is the attenuation length, t 0 = π w 2 c p ρm/k is the heat diffusion time where c p, ρm, and k are by turns the heat capacity, the mass density, and the thermal diffusivity) is for t > 0 (Buratin et al., Reference Buratin, Bashtova and Kong2017; Xu et al., Reference Xu, Wang, Ma, Zhou, Shen and Tian2018)
 $$\eqalign{& {\rm \Delta} T = {\rm \Delta} T_{{\rm Max}}\displaystyle{{e^{{{ - {\rm R}^2} / {(1 + 4{\rm \pi} {\rm \tau} )}}}} \over {2\,(1 + 4{\rm \pi} {\rm \tau} )}}e^{ - \vert {{\rm WZ}} \vert } \,e^{{\rm W}^2{\rm \pi} {\rm \tau}} \cr & \times\left[erfc\;(W\sqrt {{\rm \pi} {\rm \tau}} + \displaystyle{Z \over {2\sqrt {{\rm \pi} {\rm \tau}}}} ) + e^{2\vert {{\rm WZ}} \vert } erfc(W\sqrt {{\rm \pi} {\rm \tau}} - \displaystyle{Z \over {2\sqrt {{\rm \pi} {\rm \tau}}}} )\;\right]} $$
where
 $$\eqalign{{\rm \Delta} T_{{\rm Max}} & = \displaystyle{{Q(1 - F_{{\rm refl}})(1 - F_{{\rm abl} - {\rm out}})} \over {{\rm \pi} \,w^2l_{{\rm at}}\,c_{\rm p}\,{\rm \rho} _m}} \cr & = \displaystyle{{Q(1 - F_{{\rm refl}})(1 - F_{{\rm abl} - {\rm out}})} \over {t_{0\,}k\,l_{{\rm at}}}}} $$
is the maximum temperature increase [F refl is reflected and scattered energy fraction (in all cases taken F refl ≈ 0.1)]; F abl−out is the energy fraction deposited outside the crater [in all cases taken F abl−out ≈ 0.5)]. Taking FWHM ~40 µm [FWHM is full width at half magnitude of approximating Gaussian curve and determines w = FWHM/{2 × (Ln(2))1/2} = 23.54 µm] and substituting attenuation length l at from Henke et al. (Reference Henke, Gullikson and Davis1993) (after extrapolation), material constants of W and Mo from Wikipedia and material constants of SiC from Siklitsky (Reference Siklitsky1998–2001), we get the time development of radial and z-profiles of temperature field T(r, z, t) = T R + ΔT in graphical form (for SiC see Fig. 19). It is seen that with this choice (the fluence in the center is very close to the ablation threshold) a rough agreement with experimental results is achieved (the crater diameter is ~10 µm, the crater depth is tens or hundreds of nanometers). However, even a slight increase of local fluence in the center (either by enhancing the total deposited energy, or by reducing the deposition area) results in fast enlargement of the diameter as well as thickness of the melted-and-evaporated layer. At W and Mo, it is possible to argue with re-solidification, but in the case of SiC, the curve of sublimating temperature should be identical with final contour of the crater. There are at least three surprising things: that (1) our crater (namely its transverse dimension) is never substantially larger than ~10 µm, (2) Mo (with material constants similar to W), despite measured at nearly doubled laser energy, has the crater depth of the same order as the other two materials, (3) a sub-surface heat-affected zone is missing. All three facts could be explained by the following scenario: as soon as the laser heats the surface to melting temperature, the melted matter (crossing the triple point) immediately starts to boil (due to vacuum environment) and a warm dense matter is created at the surface that starts to fly against the laser beam (Kolacek et al., Reference Kolacek, Schmidt, Straus, Frolov, Juha and Chalupsky2015b) and absorbs reliably the rest of laser pulse.
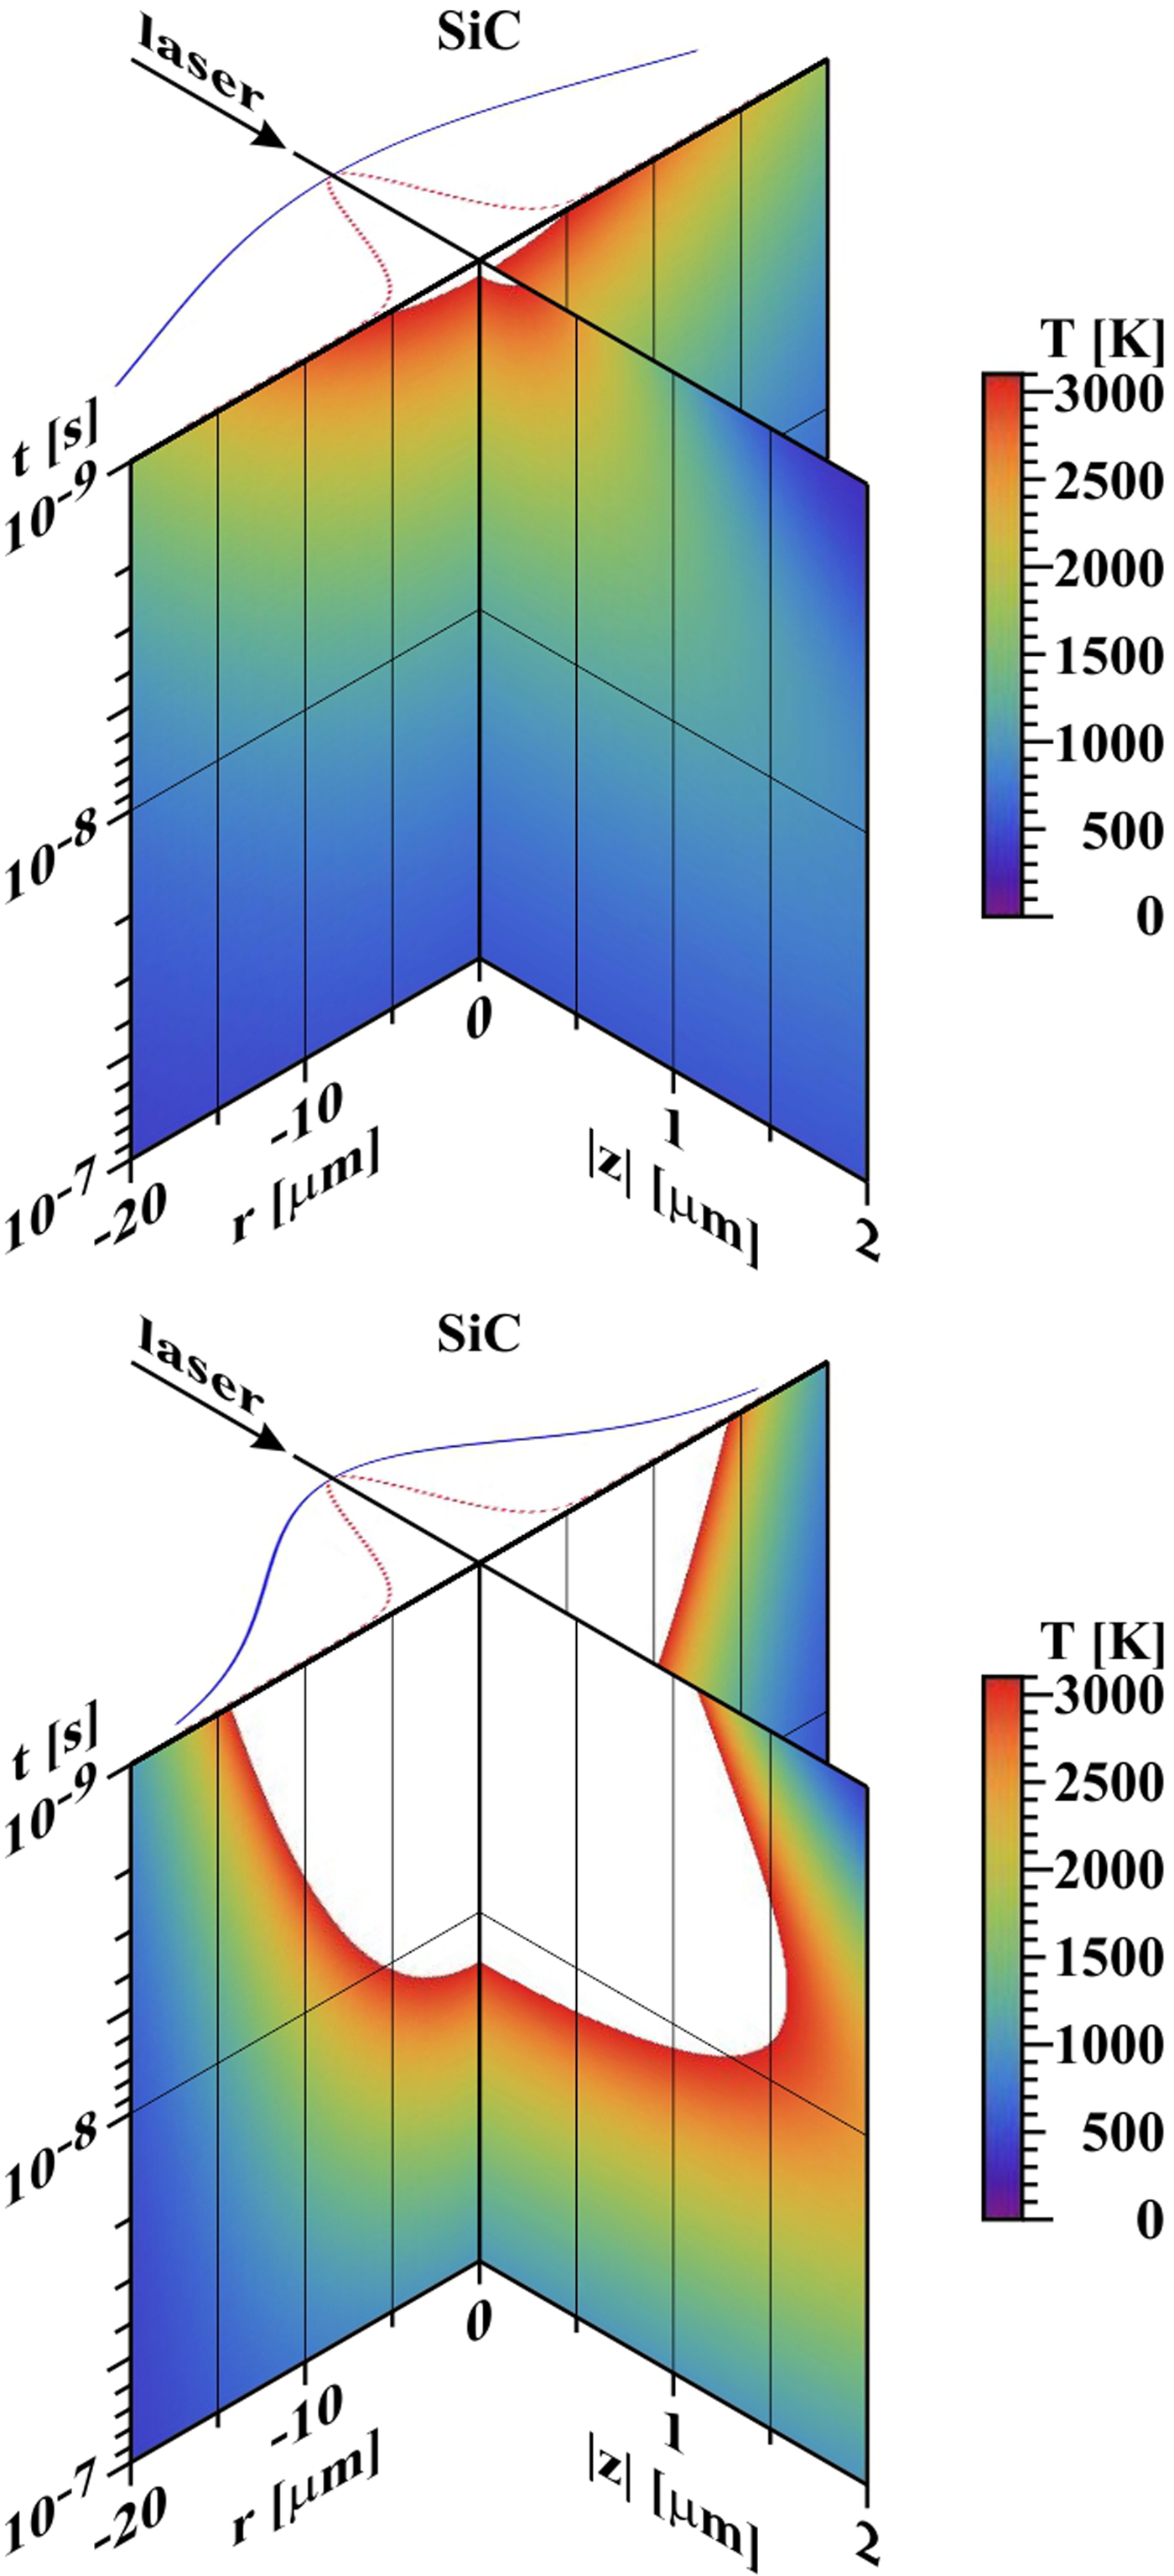
Fig. 19. Temporal development of radial and depth profiles of temperature field. In the plane t = 10−9 s, the incident laser beam is shown together with its Gaussian profile used for calculation (blue curve) and profile deduced from Figure 18 (FWHM* = 5.43 µm – red dotted curve). Top: SiC (Q = 21 µJ, FWHM ~40 µm). Bottom: SiC (Q = 21 µJ, FWHM = 20 µm). Z-scale is ~10 times enlarged r-scale. The white color in the graphs means that the melting point was surpassed.
Conclusion
The character of the response of W and Mo to XUV laser radiation is quite similar: in both materials, desorption and ablation areas (Kolacek et al., Reference Kolacek, Schmidt, Straus, Frolov, Juha and Chalupsky2015b) are clearly visible. They are covered by melted and re-solidified material, in which smaller or larger circular holes appear – residua of just opened pores and/or just burst bubbles, from which gaseous phase explosively escaped into vacuum. For both materials, the ablation area deepens more rapidly with a number of accumulated shots than the desorption area. Simultaneously, in the ablation area, a number of cracks and ruptures appear due to relaxation of stresses associated with the re-solidification of melted material. Moreover, W has the tendency to delaminate its surface layer during exposure; due to reduced thermal conduction of such semi-detached chips, their free edges are more intensely heated, melted, and rounded.
On the other hand, SiC has numerous large open holes and minimum of closed pores; moreover, SiC sublimates – therefore, there is no melted layer with bursting bubbles. Consequently, no explosive escape of “pressurized” gaseous phase and no accompanying effects take place. Additionally, the irradiation by short pulses of XUV laser radiation does not lead to a formation of any segregate desorption area, and therefore, the desorption threshold (if any) seems to be very close to the ablation one. In the ablation area, where sublimation temperature is exceeded, the SiC sublimates with simultaneous decomposition providing atomic Si and C.
In our opinion, for armoring of the first wall of the thermonuclear reactor, the most dangerous issue is material removal: supposing that the service-free period of the future ICF-based thermonuclear reactor should last at least 1 year, that is, at 10 Hz repetition frequency 3.15 × 10⁸ shots, any material removal during few shots represents a potential threat. From this point of view, W and Mo seem worse than SiC, because they (in contrast to SiC) have the desorption threshold remarkably lower [~0.3–0.9 J/cm2 (Tanaka et al., Reference Tanaka, Rochau, Peterson and Olson2005)] than the ablation threshold [1.3–2.3 J/cm2 (Tanaka et al., Reference Tanaka, Rochau, Peterson and Olson2005)]. On the other hand, the observed cracks at W and Mo can be beneficial in the beginning, because they mitigate the helium retention in the armor volume. However, the full-scale scenario must take into account that the critical number of cracks of critical size might be exceeded and then a large chunk(s) could be broken off the armor. In any case, the cracks development needs a further study.
A future research should also answer how the ablation process is influenced by a different laser energy in a single shot, by a different incidence angle, by a different final surface conditioning, and by the elevated target temperature (closer to melting/sublimation point).
Supplementary material
The supplementary material for this article can be found at https://doi.org/10.1017/S0263034618000332.
Acknowledgments
This work was performed under auspices and with the support of the Grant Agency of the Czech Republic (contracts 14-29772S, 14-12837S) and of the Ministry of Education, Youth, and Sports of the Czech Republic (INGO contract LG15013 and LI contract LM2015087, INTER-EXCELLENCE/Inter-transfer contract LTT17015). EC contributed to the funding of here reported research activities by a financial support of the ToIFE project within the EUROfusion program. Further thanks belong to Japanese research collaboration funds of the Institute of Laser Engineering, Osaka University (contract 2015B2-12), and of the Research Institute of Applied Mechanics, Kyushu University (contract 27FP-10).