


The increased transportation of goods and people on a global scale is a major source of greenhouse gas (GHG) emissions and the transportation of food accounts for a significant and growing proportion of these transport emissions (Fuglestvedt et al. Reference Fuglestvedt, Berntsen, Myhre, Rypdal and Bielvedt Skeie2008). The dairy sector contributes towards those emissions, representing 4% of the total global anthropogenic GHG emissions (FAO, 2010). Consequently, concerns over the environmental impact of milk production are moving into the climate change debate (Smith & Smith, Reference Smith and Smith2000; Pirog et al. Reference Pirog, van Pelt, Enshayan and Cook2001; Coley et al. Reference Coley, Howard and Winter2009). Sweden has one of the highest yielding dairy supply chains in Europe, with a wide range of organic and conventional production methods (Cederberg & Mattson, Reference Cederberg and Mattsson2000), but there has been little work done to evaluate the effectiveness of regulations designed to tackle transport or more specifically, vehicle-related emissions in milk production. This paper will open with a brief review of the existing discourses around the measurement of the climatic impact of different milk production methods and attempts to provide a vehicle-related carbon footprint for both organic and conventional dairy production, with the aim of stimulating a discussion around vehicle-related emissions made by both the production systems themselves and those resulting from regulations introduced in the hope to address the former.
Organic dairy production is considered to present an opportunity for improving animal welfare and helping to mitigate climate change. Sweden's organic certifier (KRAV) has a number of regulations designed to improve animal welfare and reduce the environmental impact of milk production such as larger living facilities, calves required to remain longer with the cow after birth, targets for on-site feed production and a ban on the use of artificial chemicals or nutrients. Organic milk producers in Sweden have limits to the length of time cattle can be kept indoors and, depending on the geographical region, organic dairy cows must have access to pasture for 4 months a year in Southern Sweden and 2 months in the North. However, due to the Swedish culture that associates cattle with the rural landscape, the majority of conventional farmers also release their cattle outdoors. Organic milk production in Sweden requires a minimum of 50% feed production to be done on-farm, as a means to reduce the global GHG emissions (KRAV, 2016). There are mixed results from the numerous reports regarding the impact of organic agricultural practices on the carbon footprint of the milk production supply chain. Some authors have reported lower emissions from organic production compared to conventional production, particularly in respect to the impact energy consumption (Wood et al. Reference Wood, Lenzen, Dey and Lndie2006; Cooper et al. Reference Cooper, Butler and Leifert2011; Tuomisto et al. Reference Tuomisto, Hodge, Riordan and Macdonald2012; Bos et al. Reference Bos, Haan, Sukkel and Schils2014). However, some research provides conflicting results, suggesting that the climatic impact is sometimes higher from organic production (Gomiero et al. Reference Gomiero, Paoletti and Pimentel2008; Thomassen, et al. Reference Thomassen, van Calker, Smits, Iepema and de Boer2008). These contradictory research results have encouraged scientists to further study the different impacts each production system has on the environment (Berlin et al. Reference Berlin, Sonesson and Tillman2007; de Vries & de Boer, Reference De Vries and de Boer2010; Henriksson et al. Reference Henriksson, Flysjö, Cederberg and Swensson2011; van der Werf et al. Reference Van der Werf, Kanyarushoki and Corson2009).
Previous research on dairy production has tended to concentrate on specific areas of the dairy supply chain illustrating its implications on the environment (e.g see Cederberg, Reference Cederberg2009; Adom et al. Reference Adom, Workman, Thoma and Shonnard2013), with investigations of vehicle emissions or transportation of goods falling outside the studied system boundaries. This gap highlights the lack of adjustments made to the current ‘business as usual’ model related to transport patterns to reduce GHG emissions, an important aim in the United Nations Framework Convention on Climate Change (UNFCC) and EU reduction emission targets for 2020. Moreover, it highlights the lack of research into the trade-off between vehicle emissions made outside farms (e.g. transportation of goods) and farmyard-vehicle emissions (e.g. farmyard machinery), indicating a lack of willingness to critically challenge the assumption that producing more feed in Sweden would result in a reduction of emissions made in the dairy sector.
This paper seeks to contribute to the debate around the environmental impact of different milk production approaches by providing a carbon foot-printing study focusing on the differences in vehicle use that is determined by the supply chain in the different production systems. For example, the use of manure vs. artificial fertilisers agrichemicals to treat weeds vs. mechanical weed control and the differing levels of vehicle emissions that arise as a result. Furthermore, there are a number of farm inputs requiring transportation for both organic and conventional dairy production such as external feeds required from off-farm production. This paper aims to compare and contrast the emissions contributions made by farmyard machinery from activities on-farm, with transport-related emissions off-farm, in order to investigate the emission trade-offs made between the same that arise from Swedish organic certification requirements. In the concluding section, measures are suggested to improve the dairy carbon emission footprint.
Materials and methods
This paper applies the carbon footprint method and the directives outlined in the International Dairy Federation (IDF) carbon footprint guidelines: ‘A common carbon footprint approach for dairy’ (IDF, 2010). Vehicles form a substantial element across large parts of a dairy supply chain and are the focus of this paper. A fuel-based approach has therefore been applied with emissions factors for different fuels and vehicle types (e.g. agricultural machines, heavy-duty trucks, freight shipping etc.) to examine the global warming potential of different fuel sources. The main vehicle-related greenhouse emissions considered were Carbon Dioxide (CO2), Nitrous Oxide (N2O) and Methane (CH4) (IDF, 2010).
Functional unit, time period covered and impact assessment
The functional unit of the study was 1 kg of fat and protein corrected milk (FPCM) at the farm gate as per the IDF guidelines (2010). Through the standardisation of fat and protein content (4% fat and 3·3% protein), a fair comparison between the production systems is possible. The average energy content for organic milk in Sweden is 4·1% fat and 3·34% protein content whilst conventional milk in Sweden comprises an average of 4·0% fat and 3·39% protein (Davidson, Maria, personal communication). In November 2013 the authors conducted a series of identical semi-structured interviews at 40 farms across Sweden's southern Skåne region, along with the collection of GHG inventory data. Farm data is given in Tables 1 and 2. Values for CO2, CH4 and N2O are presented as CO2 equivalents (CO2e) using 100-year Global Warming Potential (GWP) factors, consistent with reporting under the Kyoto Protocol and the second assessment report of the Intergovernmental Panel on Climate Change (IPCC, 2007).
Table 1. Farm sample – Overview of conventional farm demographics

Table 2. Farm sample – Overview of organic farm demographics

System boundary
The system boundaries chosen for this study contain two main sources of vehicle-emissions: (1) farmyard vehicles and (2) external vehicle emissions from the import and transport of feed requirements into the Swedish dairy market (i.e. cradle to farm gate) (see Fig. 1). As such, this is an analysis of the trade-off between emissions occurring inside and outside the Swedish borders in organic and conventional dairy production. This includes emissions resulting from road, rail and marine vehicle activities for the production of 1 kg of FPCM. Whilst rail and marine transport emissions will occur outside Sweden's physical borders, these emissions have for the purpose of this paper been deemed to lie within the sphere of influence of Swedish regulation and considered appropriate for inclusion.

Fig. 1. The figure depicts a diagram flow of transport activities considered in the study. Only conventional production uses fertiliser and pesticides in its production and this is marked by dotted boxes.
Land management approaches vary between the production systems due to the certification requirements for organic production. However, all producers require regular inputs to sustain their production. Artificial fertilisers and a variety of seeds included within the system boundary from point of sale/production to farm-gate. Other farm inputs such as necessities in agrichemicals as well as slaughter, cadaver and farm-services have also been included. Crop production of sugar beets, potatoes, beetroots and other crops for human consumption, unrelated to dairy production, were omitted.
As mentioned, organic farms are required by KRAV to have a significant level of feed produced on-farm. However, the majority of producers in both conventional and organic production need to purchase additional feed stocks for import onto the farm. Concentrate and protein feed products that are produced off-farm are common components of dairy farming and consequently introduce a component of related emissions of feed produced off-farm. This study includes vehicle emissions from production site to farm-gate. A variety of other types of feed were delivered to farms. Its contribution of the total carbon footprint was below 3%, considered minor and therefore not included. Other activities that did not include vehicle combustion were not considered in the carbon footprint calculation.
Co-product allocation
A dairy farm does not only produce milk, but also calves and bulls that leave the farm if they are not beneficial for milk production and, in doing so, generate income for the farm. These products are labelled co-products of milk production, as resources consumed on the farm will result in both beef and dairy production. As a result, it is common to attribute proportions of a dairy farm's carbon footprint to the production of both meat and dairy (Flysjö et al. Reference Flysjö, Cederberg, Henriksson and Ledgard2011). This is done by using an allocation factor (AF), which was calculated for each farm based on the following equation (IDF, 2010):
 $${\rm AF} = {\rm 1}-{\rm 5}.{\rm 7717} \times R$$
R = kg livestock output per kg of FPCM output, therefore R is the ratio of the live weight of all animals exported for slaughter and the weight of FPCM milk produced. It was assumed that both organic and conventional animals exported weighed 300 kg live weight per animal (Jordbruksverket, 2014a), and the live weight of exported animals was estimated by taking the annual number of animals removed on-farm for slaughter and multiplying it by this benchmark figure. The average allocation factor for this study was calculated to be 90%, showing to be slightly higher than the 85·6% details allocation seen in the IDF (2010) guidelines. An allocation factor for manure was not applied as manure remained on-site for crop fertilisation in both organic and conventional farms.
The IDF (2010) guidelines also take into account an allocation of carbon footprint for products with multiple outputs. For example, rapeseed which is produced for rapeseed oil with a co-product of rapeseed flour, with rapeseed flour then being utilised for livestock feed. To accurately allocate emissions for feed production, IDF (2010) recommend an economic allocation. This type of allocation has been applied in previous dairy research, yet could be considered a volatile approach as it relies on fluctuating world market prices (see Cederberg & Mattson Reference Cederberg and Mattsson2000; Dalgaard et al. Reference Dalgaard, Schmidt and Flysjö2014; Gollnow et al. Reference Gollnow, Lundie, Moore, van Buuren, Stahle, Christie, Thylmann and Rehl2014).
This paper avoided an allocation of co-products through a system expansion. In this case, deducting the environmental impacts of co-products makes effects of a system expansion. To achieve this, the study calculates vehicle-related emissions per tonne of feed multiplied with the annual feed consumed per farm and distributed by its weight of milk production. Each transport link required for each ingredient was considered. For each ingredient, the capacity per vehicle, the proportion of the product transported and its distance was considered. Thus to calculate its emission impact the formula was:
 $$\eqalign{ &{\rm Distance \; ( proportionate \; to \; each \; ingredient)} \cr &\quad \times {\rm Fuel \; consumption \; per \; km} \cr &\quad = {\rm Fuel \; spent \; per \; tonne \; of \; ingredient}}$$
 $$\eqalign{ &{\rm Fuel \; spent \; per \; tonne \; of \; ingredient \times Emission \; factor} \cr &\quad = {\rm g \; of\; CO_2\; e \; per \; tonne \; of \; ingredient}}$$
All the ingredients were then added together according to the proportion of each ingredient that one tonne of feed entails. With the total grams of CO2e per tonne of feed, it allowed us to determine the emissions made per farm depending on the quantities consumed per farm (see Table 3). No other co-products were considered.
Table 3. Illustration of transportation links by two main feed ingredients (type of vehicle, distance and proportion of product transported with its transportation type)

To calculate the emissions made by seed transportation to farms, a similar approach was taken. By determining the distance, type of vehicle and its fuel consumption the carbon emissions CO2e were able to be calculated. Heavy-duty trucks deliver seed and feed to farm-gate on a regular basis, however, these vehicles contain other products destined elsewhere. To fairly allocate those emissions made by such activities, a 30% weight allocation was applied. This figure was provided by Swedish seed companies that also provided data on average number of deliveries made per journey, enabling the authors to apply an appropriate weight allocation.
Data collection
This study was based on primary data from 2013 from 40 Swedish dairy farms in the southern region of Skåne. The interviews were set up as individual meetings using a semi-structured approach on each farm and, if permitted, digitally recorded. The interviews were evenly divided between organic and conventional producers, covering a mixture of farm and herd size. The first step was to retrieve data on land management related to type of machines required, their frequency of use and hectares covered by each producer. Secondly, information about the type of deliveries required, the number of deliveries per annum, the volume/quantity of delivered goods and the delivery method was collected from each farm. This latter related to off-farm feed, seeds, chemical and fertiliser supplies. Seed manufacturers provided vehicle and delivery details. Information on distance and mode of transport of each ingredient were derived from the Swedish Institute for Food and Biotechnology (SIK) database on both conventional protein and concentrate feed (Flysjö et al. Reference Flysjö, Cederberg and Strid2008). ‘Swedish Feed’ provided information on distance and mode of transport of organic feed ingredients, via telephone interview.
Production features and model description
Tables 1 and 2 illustrate farm samples of organic and conventional producers. A conventional cow can produce up to 10000 l and an organic cow produces approximately 8000 l (KRAV, 2014). The number of Swedish dairy farmers is in decline as a result of recent instability in the price of milk, this has increased pressure on farmers to increase productivity per heifer, and increase herd size (Statistics Sweden, Yearbook of agriculture statistics, 2013).
Organic farms are not permitted to use agrichemicals or artificial fertilisers, instead utilising mechanical solutions to tackle the growth of weeds and fertilising the soil with manure (KRAV, 2014). Calves on organic farms spend 10 days with the cow and are provided with non-processed milk for the initial 10 weeks of their lives (KRAV, 2014). Calves on conventional farms are removed immediately after birth. Swedish dairy cows are mainly fed roughage fodder, grains and concentrates with proportions varying depending on producers’ preference (Cederberg, Reference Cederberg2009), regardless of the type of production system. Roughage contains silage of grass or grass mixed with clover usually grown on-farm (Emanuelson et al. Reference Emanuelson, Cederberg, Bertilsson and Rietz2006). The majority of dairy farms in Sweden purchase additional feed which is imported onto the farm. Organic farms are obliged to produce a minimum of 50% on-farm feed in order to consume less off-farm feed. Protein and concentrate feed are provided as a nutritional supplement to maintain modern production yields. The majority of producers interviewed purchase concentrates (80%) with 20% of producers purchasing additional protein feed. Protein and concentrate feed such as rapeseed meal, soy meal and by-products from the alcohol and sugar industry are typical ingredients that require transport to farms (Flysjö et al. Reference Flysjö, Cederberg, Henriksson and Ledgard2011). Soy, palm seeds and rapeseed are all produced internationally and have the furthest distance to travel. As mentioned, the initial part of this investigation focuses on the vehicle-related activities made on-farm in connection with crop management for feed production. Variations between the use of artificial fertilisers and manure application, as well as its transportation to farm vs. the use of existing manure on-farm have implications for fuel consumption. Agrichemicals as opposed to the organic process of mechanical weeding machines are a second variation in approach that has substantial implications on emissions.
The second part of the investigation relates to transported off-farm feed and its overall implications on emissions relative to on-farm feed production. Finally, there are regular transport requirements for a farm to function, such as slaughter, cadaver and farm-services. These emissions sources are also included. The formula seen in (equations 1 and 2) was considered to calculate the carbon footprint for 1 kg of FPCM is;
 $$\eqalign{ &{\rm Annual \; volume \; of \; fuel \; from \; vehicle \; activity}\; ({\rm litres}) \cr &\quad \times {\rm Emission \; factor}\, ({\rm grams \; CO}_{\rm 2} {\rm e \; per \; litre \; of \; fuel}) \cr &\quad = {\rm Vehicle \; related \; emissions} \; ({\rm grams \; CO}_{\rm 2} {\rm e})}$$
 $$\eqalign{ &\sum {{\rm Vehicle \; related \; emissions ( grams \; CO_2 e)} \over {\rm Annual \; milk \; production \; (kg \; of \; FPCM)}} \cr &\quad = {\rm Carbon \; footprint ( grams \; CO_ 2 e \; per \; kg \; of \; FPCM)}}$$
Results: GHG emissions in conventional and organic milk production in Skåne
The following section will discuss how vehicle-related emissions were found to differ between organic and conventional production methods. The average contribution of vehicle-related emissions from organic dairy production was 43·4 g of CO2e per kg of FPCM and 35·7 g of CO2e per kg of FPCM for conventional dairy production. Flysjö (Reference Flysjö2012) found that the impact of transport on 1 litre of milk is 0·07 kg CO2e per kg product. Regrettably, Flysjö (Reference Flysjö2012) did not include the potential variations of different food production systems and as such, this figure relates to conventional milk. Adom et al. (Reference Adom, Workman, Thoma and Shonnard2013) found that the impacts of emission deriving from feed ingredients were approximately 620 and 930 g CO2e kg for conventional milled dairy feed.
Table 4 provides an overview of organic and conventional vehicle-related GHG emission made per kg of FPCM. The results suggest that organic dairy production generates a higher level of vehicle-related emissions. Organic milk production shows higher farmyard emissions (39·1 g of CO2e per kg of FPCM) but a lower level of emissions from farm inputs from external transport (4·08 g of CO2e per kg of FPCM). Conventional farmyard emissions are 28·46 g of CO2e per kg of FPCM. Almost 10 g lower per kg of milk in comparison to organic production. Vehicle-related emissions from protein and concentrate feed only consider the transport-related emissions between cultivation to the farm-gate. The results indicate that concentrate feed has significantly higher levels of emissions within conventional production (3·93 g of CO2e per kg of FPCM). It represents around 11% of the total emissions made by conventional dairy production. Concentrate feed from organic production however is responsible for 1·62 g of CO2e per kg of FPCM, and represents about 4% of the total vehicle-related emissions. It is the largest contribution to the carbon footprint of organic milk arising from external inputs. Despite long distances made by ship and trucks, the overall contribution towards the carbon intensity of the functional unit is low. Seeds required by dairy producers have a relatively low impact on emissions. Both production systems share about 1% impact of emissions by seed deliveries to farm. For organic production this represents approximately 0·29 g of CO2e per kg of FPCM and 0·30 g of CO2e per kg of FPCM for conventional production. Vehicle emissions from agrichemicals (comprising manufacturer to farm and on-farm sprayer application) show to have the least impact (0·005 g of CO2e per kg of FPCM). On-farm necessities delivered to farm indicate that conventional producers generate a higher level of emissions (2·2 g of CO2e per kg of FPCM).
Table 4. Overview of average GHG emissions (in grams (g), by conventional and organic vehicle-related emissions in dairy production

GHG emissions arising from farm activities
The application of natural and artificial fertilisers is one of the more fuel-demanding and carbon-intensive activities for dairy producers. Conventional producers have a tendency to apply manure produced by their cattle in combination with their artificial fertiliser application. Due to this, conventional crop fertilisation generates on average 9·96 g CO2e per kg of FPCM, almost double the emissions than organic producers; the latter emits approximately 5·85 g CO2e per kg of FPCM. The application of artificial fertilisers represents a total of 22% of conventional farmyard vehicle emissions. With the additional manure application by conventional producers, it results in a 13% increase in vehicle-related emissions. In aggregate, a total of 35% vehicle-related emissions is generated to support the conventional nutrient cycle. In comparison to the organic production, conventional producers emit 20% more emissions through interventions to support soil nutrients.
The second process variation between organic and conventional production systems relates to weed control. As already mentioned, conventional production systems apply agrichemicals for weed management, whilst organic production use mechanical processes. The fuel efficiency for sprayers (pesticide, herbicide, insecticides and fungicides) shows significantly fewer vehicle-related emissions (0·52 g CO2e per kg of FPCM) than mechanical weed machines (2·1 g CO2e per kg of FPCM). A small number of conventional producers also use mechanical weeding generating 0·05 g CO2e per kg of FPCM.
GHG emissions arising from protein and concentrate feed
Feed with high protein content is increasingly popular in both production systems as it increases milk yields. Of the producers interviewed, 20% of farms purchase specialised protein feed to increase milk yields, in addition to standard imported concentrate feed. Conventional protein feed contains levels of protein-based ingredients such as rapeseed and palm seed together with soy products (20% content proportion) In comparison, organic protein feed share the same proportion of protein ingredients, but the source of the proteins is from certified rapeseed pellets (35% content proportion) and soy products (19·3% content proportion) produced domestically within Sweden. Figure 2 depicts the proportion of ingredients used for conventional protein and conventional concentrate feed. In addition, the figure illustrates the emission impacts made per ingredient. As seen in conventional protein feed, Expro® (maize) and soybean meal generate the greatest emission contribution. The largest impact of emissions is derived from soybean meal.
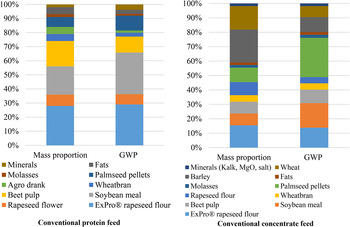
Fig. 2. Conventional protein and conventional feed ingredients illustrating the proportions of weight in proportion to the Global Warming Potential (GWP).
Over 80% of the farms interviewed import concentrate feed. On average, livestock on organic farms consume approximately 1379 kg/animal of concentrate feed, this results in approximately 0·16 kg feed consumed per kg of milk produced. Conventional farmers use significantly higher doses of concentrate feed, utilising an average of 3065 kg/animal, resulting in the consumption of 0·3 kg consumed feed per kg of milk produced. The ingredients in organic feed concentrate are mainly products from Sweden, except palm seed pellet and soybean and/or flour. There are significant environmental impacts arising from the import of palm seed pellets from Malaysia or Kazakhstan in both organic and conventional concentrate. Palm seed pellets from Malaysia make up 11% of conventional concentrate feed, contributing to 27% of emissions (see Fig. 2). Domestic ingredients such as barley, wheat and rapeseed, found in both organic and conventional concentrates indicate lower levels of transport-related emission compared to foreign crops.
Discussion
The regulations that govern organic certification in Sweden play a significant role in the type and level of vehicle-related emissions in the different production systems included in this study. Organic production tends to have lower yields than conventional approaches with an average of 7·557 l of milk/cow compared to 10·135 l of milk per cow. As a result, the lower milk yields increase carbon intensity per kg of milk produced, and could suggest that organic farming is less productive than conventional for similar levels of fossil fuel inputs. Studies by FAO (2010) and Gerber et al. (Reference Gerber, Vellinga, Opio and Steinfeld2011) indicate milk production systems with lower yield have increased emissions than more intensified systems. Notably it is not entirely accurate for all lower yielding production systems, for example, conservation-orientated dairy farms aim to consume a considerably lower fuel input through a no-till system or crop covering. In other words, options are available for producers to lower on-farm fuel emissions, yet the global market dictates to increase productivity to remain competitive and arguably, lower emissions per litre of milk produced. However, options for producers tend to involve purchased off-farm feed or use of farmyard machinery to increase milk yield.
As mentioned, the origin and cultivation of such protein crops and ingredients for feeds have been under particular scrutiny the last few years due to their environmental impact (Lehuger et al. Reference Lehuger, Gabrielle and Gagnaire2009; Da Silvia et al. Reference da Silva, van der Werf, Spies and Soares2010; Knudsen et al. Reference Knudsen, Qiao and Halberg2010; O'Brien et al. Reference O'Brien, Shalloo, Patton, Buckley, Grainger and Wallace2012). The FAO estimated two thirds of energy consumption in conventional livestock is derived from production, processing and transportation of feed (de Haan et al. Reference De Haan, Steinfeld and Blackburn1997). Emanuelson et al. (Reference Emanuelson, Cederberg, Bertilsson and Rietz2006) report on livestock feed suggests long-haul transportation of protein crop have higher emission contributions than national feed transports. These conclusions are supported by Gustafsson et al. (Reference Gustafsson, Bergsten, Bertilsson, Kronqvist, Lindmark Månsson, Lovang, Lovang and Swensson2013) who concluded external feed contributes to a significant level of emissions once ingredients travel long-haul distance. Da Silva et al. (Reference da Silva, van der Werf, Spies and Soares2010) suggest Brazilian soy has a ‘significant contribution’ to climate change with a 15–19% climate change influence; transport playing a substantial role Knudsen et al. (Reference Knudsen, Qiao and Halberg2010) study on organic soybean transport suggest transportation is responsible for 51% of the total global warming potential per tonne of soybean travelling to Denmark. With this in mind, it could be argued that these types of long-haul transportation links are an environmental hotspot that is regulated by the growing global trade of protein-based crops. Thus, there is an interest to increase agricultural cultivation with the potential to integrate home-grown protein crops. The issue is not necessarily if Sweden can cultivate their own protein-crop, but how to overcome the economic benefits of low-cost soy meal with an overpowering competitive advantage and difficult for producers to overcome.
Sweden aims to reduce dependence on foreign protein crops and increase the use of domestically sourced feed with the aim of reducing the level of carbon emission associated with the import of feed. Organic certification requirements are intended to help achieve this goal. There is about a 100-hectare land-size difference between organic and conventional farms (seen in Tables 1 and 2), mainly due to the organic certification requirement for 50% on-farm feed production, the regulatory-aim for organic production to reduce global emissions and increase self-sufficiency. Surprisingly the results of this study show that the policies outcome is counter-intuitive, and has led to organic production having higher levels of vehicle-related emissions. This contradicts the assertion that GHG emissions from vehicles will reduce by minimising the consumption of foreign protein crops required by Swedish dairy farmers to maintain existing yield. More importantly, it signifies a return of emissions to Sweden's national GHG inventory and subsequently maintains national emission levels in the transport or agricultural sector. Moreover, fossil fuels derived from agricultural activities are not statistically represented in the agricultural sector, leading to a confusion of its true impact (Swedish Environmental Agency, 2016). This study would suggest that organic certification requirements encouraging higher levels of domestic feed production could be contributing towards this trend. However, the counter-intuitive higher emissions observed here for organic farms might be seen as disingenuous, leaving out a major component from the organic debate; the reasons behind the high carbon emissions generated from their farmyard machinery. It is clear that there is an opportunity for regulatory measures lower fuel through the machinery used by producers.
The purpose of Sweden's self-sufficiency is understandable to some degree as it also complies with the increasing consumer demand of local and regional production (Jordbruksverket, 2014b). The transfer of emissions into Swedish dairy farms highlighted here does not imply overall vehicle emissions are higher for organic production compared to conventional production as on-farm emissions occurring internationally were beyond the scope of this paper. However, what emerges from these results are that overall Swedish emissions related to vehicles might not be being effectively reduced and, furthermore, that polices aimed at increasing the efficiency of on-farm activities as well as off-farm activities will be necessary. It shows that policies related to on- and off farm activities do not interlink with each other towards the overall aim of GHG mitigation. The impacts of trade-offs such as these are becoming increasingly debated (see Verspecht et al. Reference Verspecht, Vandermeulen, Avest and van Huylenbroeck2012; Klapwijk et al. Reference Klapwijk, van Wijk, Rosenstock, van Asten, Thornton and Giller2014). To optimise policies for GHG mitigation to its fullest, policy makers need data and sustainability implications of such potential trade-offs.
An example of relevant trade-offs is the variations found in organic and conventional production systems. In this case, this paper investigated the variations in methods of milk production to understand the different influences on fuel consumption. Previous studies have shown organic potato and carrot production with mechanical weed control have higher energy inputs per unit of output (see Williams et al. Reference Williams, Audsley and Sandars2006; Bos et al. Reference Bos, Haan, Sukkel and Schils2014). The results of this study share similar conclusions. It shows the chemical sprayer is one of the more fuel-efficient machines on conventional farms. Mechanical weeding is twice as fuel-demanding than the application of agrichemicals to combat weed problems. Efficient weed control is one of the major difficulties in reducing emissions for organic producers. Multiple factors play a role in the concentration of fuel consumption of weeders; age and type of machinery and methods used for weeding merits closer investigation on the habits of producers. Organic producers have to pursue alternative measures with mechanical practices all of which require time, effort and, more importantly, timing; when certain machines are applied can significantly increase or decrease fuel consumption. It is clear that without the use of agrichemicals, organic producers struggle to control weeds, and consequently generate higher vehicle-emissions from use of weeders. Despite these issues, mechanical weed control has been shown increased levels of biodiversity, stronger soil and ground water health compared to the use of agrichemicals (Pimentel et al. Reference Pimentel, Hepperly, Hanson, Douds and Seidel2005). While agrichemicals have a direct environmental impact on soil, insect and weed persistence in crops, the environmental impacts of agrichemicals go far beyond fuel consumption, and a reduction of agrichemicals has long-term benefits for the environment. Any comprehensive comparison of the carbon footprints of different milk production methods would have to take account of effects of soil organic carbon, which has not been considered here. The polluting effects of agrichemicals and artificial nutrients in countries such as Brazil have stimulated domestic feed production even further. However, as of yet, only the Swedish organic sector has taken significant steps towards reducing imports from countries with questionable land-use and polluting repercussions (Naturskyddsföreningen, 2010).
Nevertheless, initiatives such as ‘The Round Table of Responsible Soy’ are encouraging producers to move towards more sustainable production techniques. Despite this, the majority of crops are still produced conventionally and the high demand of protein crops remains in the dairy and meat industries. However, the importation of soya to Sweden is slowly reducing while the demand of rapeseed is increasing (Gustafsson, Reference Gustafsson2017). Swedish policies to stimulate home-based protein crops certainly have had an impact on decreasing imports of soya. However, it is clear that Sweden would need to investigate further whether different production methods can maintain such trends whilst still reducing on-farm fuel consumption. Having said that, if Swedish dairy producers wish to reduce vehicle-related emissions, technically, the impact is less if foreign protein crops are consumed. Clearly these emissions do not consider other environmental impacts that soy production may have on the environment. Furthermore, conventional producers will have to consider the possibilities of increasing their own protein-based crops to substantially reduce their own reliance on internationally produced protein and concentrate feed.
The second process variation is the application of nutrients. Cederberg & Mattson (Reference Cederberg and Mattsson2000) found nutrient surplus to be higher in conventional production systems. Swedish national statistics concur with increasing levels of artificial fertilisers (Statistics Sweden, Yearbook of Sweden, 2013). Sweden's political decision in 2008 to abolish taxes on artificial fertilisers (as a measure to increase Swedish competitiveness) instigated a spike of Swedish farmers applying more fertilisers. Resulting in a considerable influence on increasing nutrient surplus and additionally, a contributing factor to higher on-farm fuel consumption. The findings here show conventional producers applying both organic and artificial fertilisers. Manure is a valuable and free nutrient-resource, and yet the application of both artificial and organic fertilisers can be a contributing factor to the surplus of nutrients in conventional production that increases fuel consumption on conventional farms considerably. The findings show both production methods as fuel-intensive. A relevant finding by Bittman et al. (Reference Bittman, Hunt, Kowalenko, Chantigny, Buckley and Bounaix2011) suggests the removal of solid manure to improve nutrient leaching would also limit on-farm fuel consumption. Different land management such as these between production systems (crop variations, machinery differences, producer behaviours and production approaches) will have to weigh against each other. Policy-makers will have to include a wide spectrum of trade-offs between environmental, economic, social, and institutional to ensure a positive development of all types of producers. Not only the impacts of pollution will be required but also the economic and social implications. At this moment in time, the economic benefits for producers to apply conservation measures are low and would require a change for GHG mitigation. Tying the collaboration between science and policy will be increasingly important to help address these gaps of knowledge.
Conclusion
This study shows organic dairy production has higher GHG emission from vehicle-related fuel consumption than conventional dairy production per kg of FPCM. A reason for this could be associated with the lower organic yield and mandatory targets for on-farm organic feed production. Furthermore, whilst organic milk production does result in a reduction of road-related transport emissions, this fails to offset the increase in emissions from farmyard vehicles used in producing feed on-farm. The benefits of bringing feed ingredient production under domestic control are that Sweden is able to ensure a greater level of responsible land-use management (e.g. avoiding the clearing of rainforest and excessive use of chemicals and fertilisers). Greater domestic environmental benefits can be achieved through the regulation of Swedish farming practices to reduce fuel consumption e.g. re-introducing taxes on fertilisers and chemical agents, or increasing the fuel efficiencies on mechanical weeders and stronger incentives to consume biodiesel. More importantly, the methods towards GHG mitigation are not effective if policy makers don't consider all risks by their decision-makings. The need to motivate and financially stimulate measures towards sustainable land management will be key if fuel consumption on-farm is to be reduced. Potential areas of further research could include an exploration of measures such as restricting use of crop-ingredients from abroad that have not been certified as responsibly sourced, restricting number of external inputs to farms (e.g. through delivery consolidation), and improving the efficiency of farmyard vehicles, in particular mechanical weeders (e.g. through scrappage schemes for the oldest, most polluting vehicles). As a final note, it became very clear in the interviews that a farmer's own behaviour patterns has a significant affect the final outcome of fuel consumption on-farm. Of those interviewed, the majority of producers gave little consideration to what changes they could adopt to reduce fuel consumption. A focus on the main influencers in producers decision-making process could be enables policy makers.
Grateful thanks to the Austrian Technology Institute – Department of Innovation Systems for funding this research and to Ms. Hannah Christmas for proofreading the scripts.


