


INTRODUCTION
The entorhinal cortex (ERC) provides major cortical input to the hippocampus through the perforant pathway (Zola-Morgan, Squire, & Amaral, Reference Zola-Morgan, Squire and Amaral1986). It is one of the first anatomical regions to show Alzheimer disease pathology (Braak & Braak, Reference Braak and Braak1994; von Gunten, Bouras, Kovari, Giannakopoulos, & Hof, Reference von Gunten, Bouras, Kovari, Giannakopoulos and Hof2006), with more than half of adults between 56 and 60 years shown to have neurofibrillary tangles in at least the entorhinal region of the brain (Braak & Braak, Reference Braak and Braak1997). In addition, volumetric studies of the ERC suggest that ERC volume is a predictor for conversion to Alzheimer’s disease (deToledo-Morrell et al., Reference deToledo-Morrell, Stoub, Bulgakova, Wilson, Bennett and Leurgans2004). Functionally, the ERC is associated with memory, as shown in animal studies demonstrating memory impairment following ERC damage (Leonard, Amaral, Squire, & Zola-Morgan, Reference Leonard, Amaral, Squire and Zola-Morgan1995) and human studies showing lower ERC regional cerebral blood volume associated with lower performance on delay memory tests (Reitz et al., Reference Reitz, Brickman, Brown, Manly, DeCarli and Small2009). For all of these reasons, ERC in vivo measurement has received considerable attention.
The ERC is, however, a difficult structure to measure on structural magnetic resonance (MR) imaging. This is partially due to difficulty visualizing ERC anatomical borders on T1-weighted images (Juottonen, Laakso, Partanen, & Soininen, Reference Juottonen, Laakso, Partanen and Soininen1999; Xu et al., Reference Xu, Jack, O’Brien, Kokmen, Smith and Ivnik2000). The lateral border of the ERC is particularly challenging to identify. The ERC is laterally adjacent to the perirhinal cortex and although, cytoarchitecturally, there are differences in cell structure for the ERC and perirhinal cortex, there is no clear visual boundary seen on volumetrically acquired T1-weighted images. Researchers consequently use sulcal landmarks to guide volumetric tracings of the ERC, with the posterior and lateral boundaries guided largely by features of the collateral sulcus.
There are at least three published ERC image-based volumetric approaches, with these techniques largely differing in definition of ERC lateral boundary endpoints. The most well-known approach is that described by Insausti et al. (Reference Insausti, Juottonen, Soininen, Insausti, Partanen and Vainio1998). These investigators developed a volumetric technique for coronal MRI images based on the cytoarchitectonic histopathology analyses of 35 normal human entorhinal cortices (Insausti, Tunon, Sobreviela, Insausti, & Gonzalo, Reference Insausti, Tunon, Sobreviela, Insausti and Gonzalo1995). Based on interindividual variability observed in the histological sections of the ERC within the collateral sulcus, these authors determined that delineation of the ERC’s lateral border from that of the perirhinal cortex depends on whether the collateral sulcus is shallow (<1.0 cm), deep (>1.5 cm), or regular (1–1.4 cm) in length with each type yielding different endpoints for measurement. Thus, the Insausti et al. (Reference Insausti, Juottonen, Soininen, Insausti, Partanen and Vainio1998) approach requires raters to consider the depth of the each brain’s collateral sulci and adjust lateral boundary volumetric approaches accordingly. Although a well-respected approach to acquiring ERC volume, the guidelines introduce the opportunity for rater variability in sulcal judgment.
The second most common approach is that of Goncharova et al. (Reference Goncharova, Dickerson, Stoub and deToledo-Morrell2001) which restricts the lateral border to the medial edge of the collateral sulcus regardless of its depth. In their 2001 publication, Goncharova and colleagues conducted a rigorous comparison of their technique to that of Insausti et al. (Reference Insausti, Juottonen, Soininen, Insausti, Partanen and Vainio1998). They demonstrated that while this simplified approach resulted in smaller ERC volume overall relative to the Insausti et al. (Reference Insausti, Juottonen, Soininen, Insausti, Partanen and Vainio1998) approach, both techniques had a similar distribution and correlated highly. The Goncharova et al. (Reference Goncharova, Dickerson, Stoub and deToledo-Morrell2001) approach was also described as reducing measurement time and rater disagreement between lateral boundary endpoints. Due to its distinct boundary guidelines, the Goncharova et al. (Reference Goncharova, Dickerson, Stoub and deToledo-Morrell2001) technique has gained much acceptance in recent imaging research. Its boundaries are now used in popular semi-automated computerized methods for quantifying ERC surface area, thickness, and volume (e.g., Feczko, Augustinack, Fischl, & Dickerson, Reference Feczko, Augustinack, Fischl and Dickerson2009). There is possible limitation to the Goncharova et al. (Reference Goncharova, Dickerson, Stoub and deToledo-Morrell2001) technique, however. For some individuals, the technique omits portions of the ERC. We question whether this tissue exclusion may impact ERC clinical research for non-demented older adults where atrophy should be in the early stage; tissue omission may reduce inter-participant variability and impose a restriction of range. This may be particularly relevant when researchers are attempting to examine associations between ERC and memory.
A third technique has been described by Honeycutt et al. (Reference Honeycutt, Smith, Ayward, Li, Chan and Barta1998). This approach defines the lateral ERC boundary as the fundus of the collateral sulcus. Like the technique described by Goncharova et al. (Reference Goncharova, Dickerson, Stoub and deToledo-Morrell2001), this method defines consistent boundaries that may reduce rater variability. The resulting measurement, however, may overestimate the size of the ERC; volumes may include portions of the perirhinal cortex in some individuals. Although the perirhinal cortex is intricately connected with the ERC, there is growing evidence that the perirhinal cortex and ERC cortex have distinct functions (Buckley, Reference Buckley2005). Thus, this overly inclusive ERC measurement technique may also be problematic for clinical research investigations examining ERC volume on memory specificity.
As a first step for a larger prospective investigation examining neuroanatomical predictors of cognitive change in non-demented “healthy” older adults, we wanted to identify the most appropriate ERC volumetric method with regard to reliability and validity. The current study reports on our comparison of the three ERC techniques (Goncharova et al., Reference Goncharova, Dickerson, Stoub and deToledo-Morrell2001; Honeycutt et al., Reference Honeycutt, Smith, Ayward, Li, Chan and Barta1998; Insausti et al., Reference Insausti, Juottonen, Soininen, Insausti, Partanen and Vainio1998). We assessed differences in rater reliability as well as validity of each method with a verbal memory test. We specifically predicted better inter-rater reliability for the Goncharova et al. (Reference Goncharova, Dickerson, Stoub and deToledo-Morrell2001) and the Honeycutt et al. (Reference Honeycutt, Smith, Ayward, Li, Chan and Barta1998) techniques due to their more constrained lateral ERC boundaries. Due to consideration of individual differences and potentially greater specificity for ERC regions, we expected the Insausti method would demonstrate a more significant structure/function relationship. Validity was assessed with both hemispheres, for researchers commonly address bilateral aspects of ECR volume on memory function in normal and prodromal disease states. We also assessed the strength of association between each ERC method to assess if techniques were interchangeable by hemisphere.
METHODS
Participants
Participants were part of a larger study investigating neuroanatomical predictors of cognitive change in non-demented older adults. Participants were 1) ≥ 60 years of age, 2) able to read and write, 3) native English speakers, 4) intact in instrumental activities of daily living (Lawton & Brody, Reference Lawton and Brody1969), and 5) nondemented via DSM-IV criteria (APA, 2000). We characterized the sample’s general cognition (Mini Mental State Examination; MMSE; Folstein, Folstein, & McHugh, Reference Folstein, Folstein and McHugh1975; test range 0–30; 30 = best), comorbidity (Charlson Comorbidity Index; Charlson, Pompei, Ales, & MacKenzie, Reference Charlson, Pompei, Ales and MacKenzie1987; score range 0 to 33; maximum comorbidity = 33), general intelligence via four standardized subtests (Wechsler Abbreviated Scale of Intelligence; WASI; Wechsler, Reference Wechsler1999), and depression severity (Geriatric Depression Scale; GDS; Sheikh and Yesavage, Reference Sheikh, Yesavage and Brink1986; test range 0–30; 30 = worst). Exclusion criteria included MR incompatibility (cardiac pacemakers, claustrophobia, etc), history of a documented verbal learning disorder (i.e., dyslexia), and known neurological disorders (e.g., seizure, Parkinson’s disease). Informed written consent was obtained according to University of Florida Institutional Review Board guidelines and the Declaration of Helsinki.
Forty-one participants were initially enrolled (mean ± SD: age = 71.37 ± 6.57; male:females = 21:20; education = 15.17 ± 3.39; comorbidity score = 1.05 ± 1.02; MMSE = 29.22 ± 1.08; WASI = 108.12 ± 14.12; GDS = 3.27 ± 4.17) with two participants excluded for incomplete or corrupt memory test or imaging data. Final analyses were conducted with 39 individuals with their demographic and cognitive information summarized in Table 1.
Table 1. Final participant (n = 39) descriptive data for demographic, cognitive screener, and Story Memory Test (SMT) scores

Note
SMT Verbatim Immediate and Delay scores correlated highly (r = .84; p < .001) and were, therefore, averaged into a composite score (SMT Composite) to simplify analyses.
M/F = Male/female ratio; CCI = Charlson Comorbidity Index; WASI = Wechsler Abbreviated Scale of Intelligence; MMSE = Mini Mental State Examination; GDS = Geriatric Depression Scale.
Procedures
MR acquisition and general procedures
Subjects were imaged with a Siemens 3.0 T Allegra scanner using a quadrature head coil and a T1-weighted three-dimensional (3D) magnetization prepared rapid acquisition gradient-echo (MP-RAGE) sequence (repetition time = 2500 ms; echo time = 4.38 ms; inversion time = 1100 ms; flip angle = 8 degrees; matrix = 256 × 144) reconfigured to 160 gapless, 1-mm images allowing for image reconstruction into any plane. Psychometric testing was completed within 24 hr of each brain MRI scan.
ERC Measurement
ERC analysis was performed with MEASURE (‘MEASURE’; Barta, Dhingra, Royall, & Schwartz, Reference Barta, Dhingra, Royall and Schwartz1997; Honeycutt et al., Reference Honeycutt, Smith, Ayward, Li, Chan and Barta1998) which allows for simultaneous visualization of anatomy in coronal, axial, and sagittal views. Manual tracings were made on oblique coronal slices in rostral–caudal direction with outlines beginning supero-medially at the sulcus semiannularis and progressing infero-laterally along the tissue–cerebrospinal fluid (CSF) interface. All inner border tracings followed the gray/white matter interface. ERC volumes were calculated by automatic voxel counting and compiling of measurements from individual slices.
Rostral-caudal border. When visualized in the coronal plane, anatomical landmarks for the rostral and caudal borders for the ERC differ slightly based on whether slice selection is oriented perpendicular to the line connecting the anterior–posterior commissure (AC–PC alignment; e.g., Insausti et al., Reference Insausti, Juottonen, Soininen, Insausti, Partanen and Vainio1998) or perpendicular to the long axis of the hippocampal formation (Goncharova et al., Reference Goncharova, Dickerson, Stoub and deToledo-Morrell2001). For our investigation, all ERCs were measured using oblique coronal sections oriented perpendicular to the long-axis of the hippocampal formation and relied on anatomical guidelines provided by Goncharova et al. (Reference Goncharova, Dickerson, Stoub and deToledo-Morrell2001). This alignment decision was based on findings that both AC–PC and long-axis alignment techniques produce comparable rostral–caudal ERC length (Goncharova et al., Reference Goncharova, Dickerson, Stoub and deToledo-Morrell2001) and that all of our raters could more easily and consistently visualize the rostral–caudal ERC borders using alignment to the long axis of the hippocampus. Use of a standard alignment method across ERC techniques also allowed us to interpret our findings based only on differences of lateral border endpoints.
Lateral borders. Measurement of the ERC differed by lateral border definitions as described in each technique’s reference papers. For simplicity, we will refer to each technique by the published first author’s last name (Figure 1).
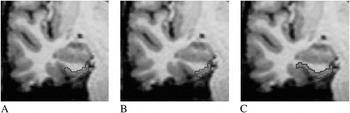
Fig. 1. Coronal view of entorhinal volumetric protocols: (A) Insausti et al. (Reference Insausti, Juottonen, Soininen, Insausti, Partanen and Vainio1998) “regular” collateral sulcal measurement. (B) Goncharova et al. (Reference Goncharova, Dickerson, Stoub and deToledo-Morrell2001) protocol. (C) Honeycutt et al. (Reference Honeycutt, Smith, Ayward, Li, Chan and Barta1998) protocol.
Insausti technique. (Insausti et al., Reference Insausti, Juottonen, Soininen, Insausti, Partanen and Vainio1998) The lateral border varied in each brain and depended on the depth of the collateral sulcus. If the collateral sulcus was “shallow” (<1 cm), the ERC–perirhinal border was the fundus of the sulcus. If “regular” (1–1.4 cm), measurement ended at the midpoint of the medial bank. If “deep” (≥ 1.5 cm), measurement ended at the medial edge of the collateral sulcus. When the collateral sulcus was unusually long or appeared double, the more medially located collateral sulcus was used to define the ERC border.
Goncharova technique (Goncharova et al., Reference Goncharova, Dickerson, Stoub and deToledo-Morrell2001). For all brains, the lateral ERC involved the infero-medial point of the medial bank of the collateral sulcus (i.e., the point of sharpest curvature of the parahippocampal gyrus edge as it turns into the collateral sulcus). As the guidelines describe, this border was constructed as a perpendicular line to the surface of the parahippocampal gyrus starting at the medial edge of the sulcus.
Honeycutt technique (Honeycutt et al., Reference Honeycutt, Smith, Ayward, Li, Chan and Barta1998). For all brains, we continued tracing along the tissue–CSF interface to the fundus (or inner most point) within the collateral sulcus.
Assessing Reliability and Validity
We examined inter-rater and intra-rater reliability differences by technique in a subset of our 39 brains. To eliminate technique bias, novice raters were chosen for this task. Using a separate unrelated dataset, a senior team member (C.L.) trained and supervised the novice raters (C.P., M.W., H.M.) in brain alignment, rotation, and visualization of the temporal lobe and hippocampus. Raters then individually read and discussed the published ERC measurement techniques before applying each technique for ERC measurements (i.e., Goncharova et al., Reference Goncharova, Dickerson, Stoub and deToledo-Morrell2001; Honeycutt et al., Reference Honeycutt, Smith, Ayward, Li, Chan and Barta1998; Insausti et al., Reference Insausti, Juottonen, Soininen, Insausti, Partanen and Vainio1998).
Inter-rater reliability: Three raters independently measured left and right ERC volumes on 12 randomly chosen brain MR images from our set of 39 participants (6 measurements per brain yielding 72 measurements total per rater; 216 measurements for all raters). Scans were blinded and duplicated so that the rater could not match ERC to participant number. Logs were kept throughout this process to help document differences in ERC sulci for visualization discussion. Intra-rater reliability: For each technique, one rater (M.W.) measured 14 left and right ERCs from a set of seven randomly chosen MR images that had been blinded and duplicated (42 measurements total).
Following rater reliability analyses, raters reviewed acquired volumes and associated MR images for rater differences. This allowed for discussion of ERC boundary criteria before beginning the validity portion of the investigation. Validity assessment: After this additional discussion and training, a rater with high intra-rater reliability for each technique (r ≥ .93; see Results section) measured the full set of blinded 39 brains to assess relationships between the three ERC technique and memory scores (78 ERCs measured with each technique; 234 measurements total). Regular consensus conferences were conducted during this process to discuss concerns with visualization, sulcal depth, and lateral border endpoints for long or double collateral sulci (see Insausti et al., Reference Insausti, Juottonen, Soininen, Insausti, Partanen and Vainio1998). Using this full dataset, we then examined intra-method reliability to assess agreement among ERC measurement technique.
Normalization of volumetric data
Each participant’s ERC volume was divided by supratentorial brain volume (cerebellum and brainstem removed; white and gray matter volume only) acquired using a semi-automated technique from ‘MEASURE’ (Barta et al., Reference Barta, Dhingra, Royall and Schwartz1997; brain volume inter-rater reliability, ICC r = .95; CI = .88–.98; intra-rater reliability ICC r > .98). For the temporal horn and hippocampus, correction with total brain volume (TBV) has been shown to have advantages over total intracranial volume (Bigler & Tate, Reference Bigler and Tate2001).
Memory Assessment
Story memory test (Newcomer et al., Reference Newcomer, Selke, Melson, Hershey, Craft and Richards1999) is a paragraph recall test modeled after the Wechsler Memory Scale–Revised(WMS-R) Logical Memory subtest (Wechsler, Reference Wechsler1987). It presents two short stories with immediate and 30-min delay recall indices. The exact number of words recalled for both immediate and delay time points was recorded using a tape recorder (dependent variables: verbatim score, maximum possible score = 88 units). Our sample had a high correlation between total raw immediate and delay scores (r = 0.87; p < .001) so an average of both scores was used to simplify the number of analyses. The Story Memory Test has seven alternate versions. Due to the nature of the current study’s longitudinal parent investigation, four versions were randomly administered to our participant sample. We, therefore, controlled for story version in our final analyses.
Statistical Analysis
Reliability
Inter- and intra-rater reliability for all raw ERC volumes was assessed with one-way random, single measure, intraclass correlation coefficients. Fisher r-to-Z transformation examined differences in ICC r values (Warner, Reference Warner2008). Two-way mixed single measure ICC for absolute agreement assessed strength of association agreement between each technique’s ERC raw volumes for each hemisphere (i.e., inter-method reliability using the final set of 39 brains). Confidence intervals (95%) are reported with desired ICC values > .60 (“Substantial”; Landis & Koch, Reference Landis and Koch1977). Raters’ volumes met normality requirements (kurtosis range = .31–1.33; skewness range = .86–1.23).
Validity
One-tailed Pearson r correlations controlling for story memory test version assessed relationships between normalized ERC volume (acquired volume/ skull stripped supratentorial volume × 1000) and story memory test scores. We conducted follow-up partial correlation analyses that additionally controlled for depression score; pre-analysis descriptive data review revealed our sample had a GDS score ranging from within normal limits to mild (GDS mean ± SD = 3.29 ± 4.27, min to max range = 0 to 18) and the scores negatively correlated with memory performance (r = −.30; p = .04). There were no differences in male/female raw or normalized ERC volumes and so analyses were conducted without consideration for sex. Alpha levels were set at ≤ .05. From the r values, we discuss effect size based on Cohen’s guidelines (small, r = .01–.23, medium, r = .24–.36, larger r = .37 or larger; Cohen, Reference Cohen1988) and calculate r square (r 2) values to interpret percent of memory performance explained.
RESULTS
Reliability Analyses and ERC Volume by Technique
Inter-rater reliabilityanalyses of ERC volumes showed moderate positive intraclass correlations across the three raters by technique (Insausti ICC = .34; CI = .09–.59; F = 2.52; p = .004; Goncharova ICC = .59; CI = .36–.77; F = 5.23; p < .001; Honeycutt technique ICC = .62; CI = .40–.80; F = 5.91; p < .001), with no statistical differences between correlation coefficients (Insausti to Goncharova, Z = -1.04; p = .30; Insausti to Honeycutt, Z = 1.22; p = .27; Goncharova to Honeycutt, Z = .18; p = .86). Follow-up analyses of rater reliability between two raters at a time show that a range of moderate to strong intraclass correlation coefficients for two of the techniques (Goncharova: ICC range = .42 to .91; Honeycutt ICC range = .43 to .91), with a weak to strong range for the Insausti technique (ICC range =.06 to .84) (Figure 2).

Fig. 2. Scatter overlay showing relationship between rater raw entorhinal volumes by technique. X and Y axes depict rater raw entorhinal volumes.
Intra-rater reliability analyses of the ERC volumes showed high positive correlations for all techniques [Insausti (ICC = 0.94; CI = .82–.98; F = 32.97; p < .001), Goncharova (ICC = .93; CI = .79–.98; F = 28.23; p < .001), Honeycutt technique (ICC = .98; CI = .95–.99; F = 110.61; p < .001)], with no statistical difference between correlation coefficients (Insausti to Goncharova, Z = .17; p = .87; Insausti to Honeycutt, Z = 1.24; p = .22; Goncharova to Honeycutt, Z = 1.21; p = .16).
Inter-method agreement for all 39 brains was substantial, but with a wide confidence interval (left hemisphere ICC = .68; CI = .19–.87; F = 20.38; p < .001; right hemisphere ICC = .88; CI = .19–.90; F = 29.30; p < .001), suggesting that ERC technique volumes within left or right hemispheres were not consistently interchangeable between the three technique. Post hoc paired comparisons between two techniques at a time show overall less consistency between the Goncharova and Honeycutt techniques (left hemisphere: Insausti to Goncharova: ICC = .86; CI = .17–.96; Insausti to Honeycutt: ICC = .73; CI = .06–.91; Goncharova to Honeycutt = .55; CI = .09–.84; Right hemisphere: Insausti to Goncharova: ICC = .86; CI = .04–.96; Insausti to Honeycutt: ICC = .79; CI = .07–.93; Goncharova to Honeycutt = .60; CI = .08–.87).
ERC volume by technique
Raw and corrected ERC volume by technique and hemisphere are reported in Table 2.
Table 2. Mean ± SD (minimum, maximum) for raw (n = 39) entorhinal volume and ratio (n = 39) entorhinal/parenchymal volume* by technique and hemisphere

* Ratio entorhinal/supratentorial brain volume = raw entorhinal cortex volume (mm3) divided by supratentorial total brain volume (mm3) × 1000.
A 3(Technique) × 2(Hemisphere) × Raw ERC volume mixed model analysis of variance showed a main effect of Technique [F(2,229) = 20.04; p < .001] with the Honeycutt producing the largest volumes, and the Goncharova technique the smallest volumes [post hoc p’s < .01] Table 2. Although right hemisphere raw means are slightly larger for the Insausti and Goncharova techniques, these was no main effect of Hemisphere (p = .71) or Technique by Hemisphere interaction (p = .96). Repeated analyses on normalized ERC (raw/total brain volume) produced the same results [main effect of Technique; F(2,228) = 41.41; p < .001; post hoc p’s < .01; all other main effects and interactions, p > .10].
Relationships Between Technique ERC (Corrected Volumes by TBV) and Story Memory Test Composite Scores
There was a significant positive association and moderate effect size between story recall and left ERC volumes acquired via Insausti (r = .30; p = .04; r 2 = .09) and Goncharova (r = .29; p = .04; r 2 = .08), but not the Honeycutt technique (r = .22; p = .09, r 2 = .05) Figure 3. After controlling for GDS score, the relationship between ERC volume and recall remained significant for the Insausti volumes (Insausti: r = .32; p = .03; r 2 = .10 Goncharova = .27; p = .06; r 2 = .07; Honeycutt r = .19; p = .14; r 2 = .04), although we note that there were moderate effect sizes for both Insausti and Goncharova.

Fig. 3. Scatterplots comparing each technique’s left and right normalized entorhinal volume to story memory test scores. Y-axis depicts entorhinal cortex volumes corrected by Total Brain Volume and multiplied by 1000 for ease of interpretation (rather than scientific notation); Honeycutt = full depth of collateral sulcus; Insausti = shallow, deep, regular sulcus judgments; Goncharova = edge of collateral sulcus. Axes set to the same scale to show differences in total volume range achieved by each technique and relative relationship to the memory test score. See Table 2 for relative min and max values for each entorhinal cortex (ERC) technique.
There were significant positive associations with moderate effect sizes between story recall and right ERC volumes acquired via Insausti (r = .28; p = .04; r 2 = .08) and Honeycutt (r = .27; p = .04; r 2 = .07), but not Goncharova (r = .24; p = .07; r 2 = .06). After controlling for GDS score, however, there were no significant relationships between ERC volume and story recall (Insausti r = .25; p = .07; r 2 = .06; Goncharova r = .20; p = .12; r 2 = .04; Honeycutt r = .21; p = .10; r 2 = .04). An outlier (>2.0 SD for corrected ERC; see Figure 3) was identified. When this participant was removed from analyses, there were no significant associations for any technique before or after controlling for GDS.
DISCUSSION
There are three well-known tracing techniques for quantifying ERC volume from T1-weighted volumetric brain MR images (i.e., Goncharova et al., Reference Goncharova, Dickerson, Stoub and deToledo-Morrell2001; Honeycutt et al., Reference Honeycutt, Smith, Ayward, Li, Chan and Barta1998; Insausti et al., Reference Insausti, Juottonen, Soininen, Insausti, Partanen and Vainio1998). These techniques vary in lateral ERC border definition, thereby impacting the amount of ERC and perirhinal tissue measured. One technique requires consideration of collateral sulcal depth (Insausti et al., Reference Insausti, Juottonen, Soininen, Insausti, Partanen and Vainio1998), while the other two use consistent lateral border end points: medial edge in Goncharova et al. (Reference Goncharova, Dickerson, Stoub and deToledo-Morrell2001), fundus of collateral sulcus in Honeycutt et al. (Reference Honeycutt, Smith, Ayward, Li, Chan and Barta1998). We hypothesized that differences in entorhinal border definition may impact MR visualization of ERC boundaries thereby influencing rater reliability and association to memory performances.
Our first study goal was to assess differences in reliability for novice entorhinal raters. We showed that the three published techniques varied in inter-rater reliability. Inter-rater reliabilities ranged from moderate to strong (.42 to .91) for the techniques requiring consistent lateral border end points: medial edge in Goncharova, fundus of collateral sulcus in Honeycutt, respectively. By contrast, inter-rater reliabilities were negligible to strong (.06 to .84) for the Insausti technique, which requires consideration of collateral sulcal depth for each individual brain. Post-measurement discussions among raters revealed that, for the Insausti technique, one rater was particularly weak at establishing reliability with the other two raters. A qualitative examination of rater logs and a comparison of raw volumes indicated that this rater more frequently and consistently judged collateral sulci to be smaller in size (i.e., more regular and shallow judgments) than the other two raters. Findings, therefore, indicate more difficulty establishing formal rater agreement with the Insausti technique. We addressed this issue by establishing regular sulcal depth classification meetings between raters before any measurements were conducted for the validity portion of our study.
Our comparison of the final ERC volumes for each technique showed volumes that correspond to the respective published values and ranges. As expected, the Honeycutt technique provided the largest volumes while the Goncharova technique provided the smallest volumes. An analysis of inter-method reliability showed a moderate association between all three techniques (i.e., larger Honeycutt volumes were often associated with larger Insausti and larger Goncharova volumes), with the Honeycutt and Goncharova techniques having the weakest association. Large confidence intervals were observed for all technique comparisons suggesting that ERC volumes were not always interchangeable between techniques. This is a critical point to consider for researchers who decide to use different ERC techniques midway through a large imaging database.
ERC associations to verbal memory scores differed by technique. Left ERC and verbal memory associations were positive and medium in effect size for the Insausti and Goncharova techniques. In our sample of nondemented adults, both also explained a significant amount of memory variance (9% and 8%, respectively). After controlling for depression symptom severity, however, only the Insausti volumes significantly associated with memory scores, continued to produce a moderate effect size, and continued to explain 10 percent of variance in participants’ memory scores. Associations with the Goncharova technique dropped to trend level (p = .06) accompanied by estimates of moderate effect size and a one point drop in percent variance explained. By contrast, Honeycutt volumes and memory associations were not significant, low in effect size, and explained half as much variance in memory scores relative to the Insausti approach. We, therefore, conclude that the Insausti technique yielded the strongest association with the left ERC and verbal memory measure, with the expected pattern followed very closely by Goncharova approach.
For the right hemisphere, no ERC technique provided a convincing positive association between ERC volume and verbal memory performance. Initial analyses suggested a small to moderate effect size with the Insausti and Honeycutt volumes; however, after controlling for depression score severity, correlations diminished. Additionally, coefficients for all techniques further diminished after removal of an outlier. The findings support research suggesting a primary association with the left medial temporal lobe and verbal memory (e.g., Rosen et al., Reference Rosen, Prull, Gabrieli, Stoub, O’Hara and Friedman2003).
Based on our overall findings, researchers should consider not only rater training needs for each ERC technique (i.e., more training for Insausti vs. relative simplicity of the Goncharova technique), but also participant characteristics that may interact negatively with technique boundaries. Relative to the Insausti technique, the Goncharova and Honeycutt techniques provide a consistent end point which aided agreement among our novice raters. Unlike the Insausti technique, however, the Goncharova technique excludes the most lateral portion of the ERC in some individuals. This conservative lateral border approach minimizes one’s quantification of individual variability in sulcal depth, sulcal patterns, and thickness. These variables appear to be important considerations for Alzheimer’s pathogenesis (Zhan et al., Reference Zhan, Brys, Glodzik, Tsui, Javier and Wegiel2009). For studies of non-demented older adults with a limited range of ERC atrophy, the Goncharova technique may result in tissue omission which may reduce inter-participant variability and impose a restriction of range. For example, we note at least one sophisticated study using Goncharova lateral guidelines reports no ERC thickness-memory associations for normal older adults, but significant associations for those with Alzheimer’s disease (e.g., Dickerson et al., Reference Dickerson, Fezcko, Augustinack, Pacheco, Morris and Fischl2009). By contrast, the Honeycutt technique is overly inclusive incorporating portions of the perirhinal cortex for some individuals. Although the perirhinal cortex is associated with memory function (Zola-Morgan et al., Reference Zola-Morgan, Squire and Amaral1986), early medial temporal lobe pathology primarily involves the ERC. Researchers are still exploring functional specialization for the perirhinal and ERC cortices (Bellgowan, Buffalo, Bodurka, & Martin, Reference Bellgowan, Buffalo, Bodurka and Martin2009; Buckley, Reference Buckley2005). Thus, inclusion of the perirhinal cortex may erroneously increase acquired volumes and negatively bias specific functional predictions. At most, measuring to the fundus of the collateral sulcus may be most appropriate when a patient sample is expected to have atrophy to both the ERC and perirhinal cortex, and specificity to ERC function is not required.
Other ERC research considerations involve methodology for scan acquisition and post-processing approaches for improving ERC quantification. We based our ERC measurement on a single T1-weighted volumetric image acquired as part of a larger scanning protocol. Although it provided adequate resolution, all raters learning the ERC techniques reported some difficulty distinguishing gray and white matter boundaries. This is likely due to variations in intensity and contrast that develop across an image during MR acquisition. The most aggressive solution to this problem involves using multichannel imaging which is described as invaluable for improving visualization and particularly distinguishing the ERC from other medial temporal lobe structures (e.g., Bellgowan et al., Reference Bellgowan, Buffalo, Bodurka and Martin2009), but takes considerable scanning time and may not be feasible with all study patients. Less time intensive is to acquire at least two T1 weighted volumetric sequences for each participant, with these averaged to optimize the signal-to-noise ratio. This option can fail, however, when a participant moves significantly between the two acquisitions. With regard to post-processing, we encourage researchers to consider potentially time saving tissue segmentation algorithms (gray, white, cerebral spinal fluid segmentation; see Smith et al., Reference Smith, Jenkinson, Woolrich, Beckmann, Behrens and Johansen-Berg2004; http://www.fmrib.ox.ac.uk/fsl/) that will enhance region of interest measurements. Additionally, there are now very sophisticated semi-automated segmentation approaches for the ERC (i.e., Fischl et al., Reference Fischl, Stevens, Rajendran, Yeo, Greve and Leemput2009; http://surfer.nmr.mgh.harvard.edu/) incorporating the lateral border elements of the Goncharova technique, but also some elements of Insausti technique. These programs do require monitoring with regard to output; however, as the ERC segmentations typically need cleaning and adjustment. They also work best when two T1 weighted scans can be acquired and gray/white matter contrast is enhanced. Finally, we encourage researchers to consider using MRI measurement segmentation software such as ITK-SNAP (Yushkevich et al., Reference Yushkevich, Piven, Hazlett, Smith, Ho and Gee2006; http://www.itksnap.org/pmwiki/pmwiki.php) which allows manually segmented anatomy to be saved as 3D maps. During rater training and conferences these archived 3D maps facilitate visual inspection and comparison of raters’ segmentations. They also permit the use of superior reliability metrics: measuring the spatial overlap among 3D maps from repeated measurements allows for a more stringent and informative analysis of reliability than do correlations among the amount of space occupied by the segmented anatomy (Zikjenbos, Dawant, Margolin, & Palmer, Reference Zikjenbos, Dawant, Margolin and Palmer1994). Unfortunately, we did not have the option to use such 3D mapping software in the current study. When possible, however, we are now using many of these suggestions in our new investigations.
We recognize limitations with our participant sample and atrophy correction procedures. A few of the participants presented with MMSE and story memory scores that may suggest a form of mild cognitive impairment. This may suggest disease related atrophy of the ERC in addition to age related general brain atrophy. In the current study we prospectively normalized/ corrected for atrophy using total brain volume. Bigler and Tate (Reference Bigler and Tate2001) demonstrated that correcting hippocampal volume with total brain volume was meaningful with regard to normal and diseased group classification over other correction techniques (see Bigler & Tate, Reference Bigler and Tate2001). In participants where there may be localized atrophy (i.e., medial temporal lobe structures), brain volume is an appropriate correction method. We recognize, however, that some readers of our current investigation may question whether our ERC technique results would vary by correction approaches (see Bigler et al., Reference Bigler, Neeley, Miller, Tate, Rice and Cleavinger2004; Bigler & Tate, Reference Bigler and Tate2001; Buckner et al., Reference Buckner, Head, Parker, Fotenos, Marcus and Morris2004; Jeukens et al., Reference Jeukens, Vlooswijk, Majoie, de Krom, Aldenkamp and Hofman2009). To address this concern, we retrospectively re-analyzed our MRI data to acquire two correction methods: (1) total intracranial volume (TICV) which is more conventional in the literature and (2) total brain volume corrected for total intracranial volume which has been shown to produce robust correlations to neuropsychological measures (TBVc; dividing the individual’s intracranial volume by the group’s average intracranial volume, with the resulting value multiplied by individual total brain volume; see Bigler et al., Reference Bigler, Neeley, Miller, Tate, Rice and Cleavinger2004). See Supplementary Tables 1 and 2 (on-line) for the corrected means and standard deviations as well as correlation results. Overall, the same ERC technique patterns we reported with total brain volume appeared for both the TICV and TBVc approaches (e.g., Insausti technique consistently presented with stronger correlations). The strength of the ERC-memory associations varied depending on correction approach, however (e.g., correction with TBVc resulted in strong left Insausti r = .36, left Goncharova, r’s = .32; TICV correction showed only a trend level for left Insausti). Overall, these supplemental retrospective analyses continue to support our interpretations regarding the ERC techniques we investigated. These analyses also indicate that prospective investigations integrating topics of structural volumetric techniques, correction procedures, and neuropsychological associations are warranted.
In summary, the primary message of the present study is that choice of ERC technique and lateral boundary guidelines can vary visual rater reliability and the strength of ERC-memory associations in non-demented older adults. Researchers are encouraged to consider technique limitations before investigating ERC and associated functions. We strongly encourage additional studies investigating structure volumetric techniques and cognitive associations in larger and more diverse patient populations. Using validity as a criterion for choosing a volumetric measurement technique appears to be a novel approach that may improve understanding between neural substrate and cognitive function.
ACKNOWLEDGMENTS
Supported by NIH F32 AG021363-01 from the National Institute on Aging, Bethesda, Md. (C.P.), NINDS K23NS060660 (C.P.), the University of Florida grant 1UL1RR029890 - NCRR/NIH, the University of Florida Opportunity Fund (T.M.), and the I. Hermann Anesthesia Foundation (C.P.). We thank Michael Robinson, Ph.D. and Michelle Keiski, Ph.D. for method and analysis suggestions. We are thankful to the JINS Reviewers and Editors for their insightful comments and critiques.


