


According to the fifth edition of the Diagnostic and Statistical Manual of Mental Disorders (DSM-5; American Psychiatric Association, 2013), neurodevelopmental disorders (ND) comprise intellectual disabilities (ID), communication disorders, autism spectrum disorder (ASD), attention-deficit/hyperactivity disorder (ADHD), specific learning disorder (SLD), and motor disorders. These conditions initiate during the early life period and affect normal development, producing delays in the expected social, emotional, language, cognitive, and/or movement milestones. Therefore, children with unrecognised ND are more likely to underperform academically, experience social difficulties, emotional, and behavioural problems, which may result in low educational achievement, school dropout, unemployment, and poorer mental health in adulthood (Dockrell & Hurry, Reference Dockrell and Hurry2018). Given that early intervention has been shown to improve school performance, behaviour, social interactions, cognitive, and motor skills (DuPaul, Kern, Caskie, & Volpe, Reference DuPaul, Kern, Caskie and Volpe2015; Petrenko, Reference Petrenko2013; Rosenberg, Maeir, Yochman, Dahan, & Hirsch, Reference Rosenberg, Maeir, Yochman, Dahan and Hirsch2015), timely identification and treatment of subjects at risk should be prioritised to enhance long-term outcomes and allow for a proper development.
In this sense, prevalence estimates of ND in children and adolescents are essential to provide adequate educational, social and medical services, and to evaluate the effectiveness of future interventions. However, epidemiological research has yielded highly variable rates worldwide, ranging from 0.60% to 1.40% for ID (Westerinen et al., Reference Westerinen, Kaski, Virta, Kautiainen, Pitkälä and Iivanainen2017), 3.00% to 16.0% for communication disorders (Rosenbaum & Simon, Reference Rosenbaum and Simon2016), 0.60% to 1.00% for ASD (Fombonne, Reference Fombonne2009; Hill, Zuckerman, & Fombonne, Reference Hill, Zuckerman, Fombonne, Volkmar, Rogers, Paul and Pelphrey2014), 5.90% to 7.10% for ADHD (Willcutt, Reference Willcutt2012), 5.00% to 15.0% for SLD (American Psychiatric Association, 2013), and 4.00% to 20.0% for motor disorders (Cubo et al., Reference Cubo, Trejo Gabriel y Galán, Ausín Villaverde, Sáez Velasco, Delgado Benito, Vicente Macarrón and Benito-León2011; Delgado-Lobete, Santos-Del-Riego, Pértega-Díaz, & Montes-Montes, Reference Delgado-Lobete, Santos-Del-Riego, Pértega-Díaz and Montes-Montes2019). This heterogeneity in estimates is mainly due to methodological differences among studies, such as the diagnostic criteria, measurement tools, and source of information used. Additionally, the prevalence of ND varies across many sociodemographic factors, including gender, age, socioeconomic status (SES), and ethnicity, although results have been inconsistent (Bax, Bard, Cuffe, McKeown, & Wolraich, Reference Bax, Bard, Cuffe, McKeown and Wolraich2019; Delgado-Lobete et al., Reference Delgado-Lobete, Santos-Del-Riego, Pértega-Díaz and Montes-Montes2019; Dockrell & Hurry, Reference Dockrell and Hurry2018; Durkin et al., Reference Durkin, Maenner, Baio, Christensen, Daniels, Fitzgerald and Yeargin-Allsopp2017; Fortes et al., Reference Fortes, Paula, Oliveira, Bordin, de Jesus Mari and Rohde2016; Jiménez et al., Reference Jiménez, García de la Cadena, Siegel, O'Shanahan, García and Rodríguez2011; McGuire, Tian, Yeargin-Allsopp, Dowling, & Christensen, Reference McGuire, Tian, Yeargin-Allsopp, Dowling and Christensen2019; Werling & Geschwind, Reference Werling and Geschwind2013; Willcutt, Reference Willcutt2012).
Further research is also warranted to determine the prevalence and distribution of ND in Spain, since prevalence studies are scarce, almost all of them have focused on a specific disorder, the published findings are conflicting, with a wide range in reported rates, and sociodemographic correlates other than gender or age have received little attention (Carballal Mariño et al., Reference Carballal Mariño, Gago Ageitos, Ares Alvarez, del Rio Garma, García Cendón, Goicoechea Castaño and Pena Nieto2018; Catalá-López et al., Reference Catalá-López, Peiró, Ridao, Sanfélix-Gimeno, Gènova-Maleras and Catalá2012; Cuadro, von Hagen, & Costa Ball, Reference Cuadro, von Hagen and Costa Ball2017; Cubo et al., Reference Cubo, Trejo Gabriel y Galán, Ausín Villaverde, Sáez Velasco, Delgado Benito, Vicente Macarrón and Benito-León2011; Delgado-Lobete et al., Reference Delgado-Lobete, Santos-Del-Riego, Pértega-Díaz and Montes-Montes2019; Fortea, Escandell, & Castro, Reference Fortea, Escandell and Castro2013; García-Mateos, Mayor Cinca, de Santiago Herrero, & Zubiauz de Pedro, Reference García-Mateos, Mayor Cinca, de Santiago Herrero and Zubiauz de Pedro2014; González et al., Reference González, Jiménez, García, Díaz, Rodríguez, Crespo and Artiles2010; Jiménez et al., Reference Jiménez, García de la Cadena, Siegel, O'Shanahan, García and Rodríguez2011; Linazasoro, Van Blercom, & Ortiz de Zárate, Reference Linazasoro, Van Blercom and Ortiz de Zárate2006; Morales-Hidalgo, Roigé-Castellví, Hernández-Martínez, Voltas, & Canals, Reference Morales-Hidalgo, Roigé-Castellví, Hernández-Martínez, Voltas and Canals2018).
Considering this knowledge gap and the discrepant results from other countries, the aims of the current research were (1) to measure the prevalence of ND (i.e. ID, communication disorders, ASD, ADHD, SLD, and motor disorders) in a school-based population, and (2) to explore the influence of gender, age, educational stage, type of school, SES, and ethnicity on the prevalence estimates.
Overall, this study provides, for the first time, the prevalence rates of multiple ND and examines a wide variety of sociodemographic factors in 6834 Spanish children aged 5–17. In addition to the large size and age range of the sample, we combine the administration of screening tools to different informants with standardised diagnostic methods based on the DSM criteria for a comprehensive case identification, which also surpass previous investigations. Finally, the use of a school-based rather than a clinical sample produces a more valid reflection of the broader population and allows the detection of undiagnosed children.
Methods
Participants and procedure
The present study is part of a larger, ongoing research called INSchool, aiming to identify children and adolescents' mental health problems in a school setting. Prior to the start of data collection in 2011, the project was authorised by the Ministry of Health and the Ministry of Education (Generalitat de Catalunya, Spain), with the approval from the Ethics Committee of the Vall d'Hebron Hospital Universitari, in Barcelona. In order to preserve confidentiality, data were anonymised by allocating an identifying code number to each student and all original questionnaires were stored in a lock drawer accessible only by the principal investigator. A two-stage procedure was applied over 6 academic years. First, 28 schools from seven different counties in Catalonia were contacted and invited to participate after explaining the study to the school staff. All of them accepted, which resulted in 10 418 eligible subjects, with ages comprised between 5 and 17 years (i.e. first grade of primary through fourth grade of secondary education). Families were then informed and written consent was obtained for 7272 children (participation rate = 69.8%), 2338 of whom were at least aged 11 and also gave permission. Parents and teachers of the students enrolled in this first phase received a questionnaire about child's mental health and functioning, including the Child Behaviour Checklist (CBCL; Achenbach, Reference Achenbach1991a)/Teacher's Report Form (TRF; Achenbach, Reference Achenbach1991b) and the Conners' Parent Rating Scale-Revised: Short Form (CPRS-R:S; Conners, Reference Conners1997)/Conners' Teacher Rating Scale-Revised: Short Form (CTRS-R:S; Conners, Reference Conners1997). Additionally, teachers provided information on reading and writing difficulties through the Protocol for Detection and Management of Dyslexia. Educational Scope (PRODISCAT; Col⋅legi de Logopedes de Catalunya, 2011), and children in secondary education, with ages over 11 years old, were asked to fill in the Youth Self-Report (YSR; Achenbach, Reference Achenbach1991c). According to the manual for the Achenbach System of Empirically Based Assessment, individuals with more than eight missing items on the CBCL, TRF, or YSR were removed. On the other hand, we excluded subjects with more than 20% missing values on the CPRS-R:S/CTRS-R:S (i.e. >5 missing items), based on previous publications (Chen et al., Reference Chen, Zhou, Sham, Franke, Kuntsi, Campbell and Asherson2008). Thus, the final sample comprised 7180 pupils, who completed at least CBCL, TRF, YSR, CPRS-R:S, or CTRS-R:S. Of them, 2644 were identified as potential cases in accordance with the following criteria: (a) a T score ⩾70 on any of the syndrome scales from the CBCL, TRF, or YSR; (b) a T score ⩾70 on any of the subscales from the CPRS-R:S or CTRS-R:S; (c) five or more high-risk indicators on the PRODISCAT; or (d) a previous diagnosis of ND from a medical professional. In the second phase of the project, subjects who screened positive and provided consent (n = 2298) were interviewed by trained psychiatrists and neuropsychologists for diagnostic confirmation. Specifically, psychiatric disorders were evaluated using the Kiddie Schedule for Affective Disorders and Schizophrenia Present and Lifetime version (K-SADS/PL; Kaufman et al., Reference Kaufman, Birmaher, Brent, Rao, Flynn, Moreci and Ryan1997). Children with symptoms suggestive of ASD or communication disorders were referred to a specialist for a definitive diagnosis. The Wechsler Intelligence Scale for Children (WISC; Wechsler, Reference Wechsler2003, Reference Wechsler2014) was applied to identify ID. The presence of dyslexia was determined based on the Battery for the Evaluation of Reading Processes, Revised (PROLEC-R; Cuetos, Rodríguez, Ruano, & Arribas, Reference Cuetos, Rodríguez, Ruano and Arribas2007) and Battery for the Evaluation of Reading Processes in Junior and Senior High-School Students, Revised (PROLEC-SE-R; Cuetos, Arribas, & Ramos, Reference Cuetos, Arribas and Ramos2016), whereas dysgraphia was established by administering the Test for the Analysis of Reading and Writing (T.A.L.E.; Toro & Cervera, Reference Toro and Cervera1991), and Battery for the Evaluation of Writing Processes (PROESC; Cuetos, Ramos, & Ruano, Reference Cuetos, Ramos and Ruano2002). In total, the second-phase population included those students with a negative screening score and those who underwent the diagnostic assessment (n = 6834).
Measures
Child behaviour checklist, teacher's report form, and youth self-report
The CBCL (Achenbach, Reference Achenbach1991a), TRF (Achenbach, Reference Achenbach1991b), and YSR (Achenbach, Reference Achenbach1991c) are standardised screening questionnaires internationally used to identify mental health problems as reported by parents, teachers, and youth aged 11–18, respectively. Symptoms are grouped into eight syndrome scales, namely: Withdrawn, Somatic complaints, Anxious/Depressed, Social problems, Thought problems, Attention problems, Delinquent behaviour, and Aggressive behaviour. The T scores were computed for each participant according to gender and age, based on the distribution of normative samples from the United States, since no Spanish normative data are available for school-age children. The 1991 edition of the CBCL/TRF/YSR used in the current study and the 2001 version may be considered equivalent, since correlations between the new and previous scales are very high on most syndromes, and children obtain approximately the same percentiles and T scores (Achenbach & Rescorla, Reference Achenbach and Rescorla2001).
Conners' parent rating scale-revised: short form and Conners' teacher rating scale-revised: short form
The CPRS-R:S and CTRS-R:S (Conners, Reference Conners1997) assess the frequency of ADHD symptoms and related behaviours over the last month through 27 and 28 items, respectively. Both questionnaires include the Oppositional, Cognitive problems/Inattention, and Hyperactivity subscales, in addition to a global ADHD index. Given that norms for Spanish children and adolescents are unavailable, raw scores were converted to gender- and age-adjusted T scores using the United States norms.
Protocol for detection and management of dyslexia. Educational scope
The PRODISCAT (Col⋅legi de Logopedes de Catalunya, 2011) is a protocol developed by the Speech Therapists Association of Catalonia and aimed at teachers of preschool, primary and secondary education, and vocational training with the objective to detect possible cases of dyslexia at an early stage. It consists of 18–44 items, depending on the educational stage, some of which represent high-risk indicators that require intervention (e.g. ‘He/she has a family history of reading and writing difficulties’, ‘He/she has lexical access difficulties when speaking’, ‘He/she makes many spelling mistakes compared to the class group’, ‘His/her reading speed is slow compared to the class group’). The remaining items indicate associated difficulties that may worsen the symptomatology and that will need to be considered in the intervention plan.
Kiddie schedule for affective disorders and schizophrenia present and lifetime version
The K-SADS/PL (Kaufman et al., Reference Kaufman, Birmaher, Brent, Rao, Flynn, Moreci and Ryan1997) is a semi-structured interview that assesses current and past psychopathology in school-age children according to the DSM-IV-TR (American Psychiatric Association, 2000). Specifically, it contains five diagnostic groups: (1) affective disorders; (2) psychotic disorders; (3) anxiety disorders; (4) ADHD and behavioural disorders; and (5) substance abuse, tic, eating, and elimination disorders. The K-SADS/PL was administered to parents and children/adolescents, separately.
Wechsler intelligence scale for children
The WISC is an individually administered intelligence test for children aged 6–16 years. In addition to a global intelligence quotient, the WISC-IV (Wechsler, Reference Wechsler2003) measures four domains of cognitive ability through the verbal comprehension, perceptual reasoning, working memory, and processing speed indices, whereas the fifth edition (WISC-V; Wechsler, Reference Wechsler2014) separates the perceptual reasoning factor into visual spatial and fluid reasoning indices.
Battery for the evaluation of reading processes, revised
The PROLEC-R (Cuetos et al., Reference Cuetos, Rodríguez, Ruano and Arribas2007) is one of the most extensively used instruments to assess reading performance in Spanish children aged 6–12 years. The battery explores the perceptual, lexical, syntactic, and semantic processes involved in reading comprehension. Both reading accuracy and speed are measured.
Battery for the evaluation of reading processes in junior and senior high-school students, revised
The PROLEC-SE-R (Cuetos et al., Reference Cuetos, Arribas and Ramos2016) evaluates the reading ability and the underlying lexical, syntactic, and semantic processes of adolescents from 12 to 18 years.
Test for the analysis of reading and writing
The T.A.L.E. (Toro & Cervera, Reference Toro and Cervera1991) allows to determine the general level and specific characteristics of reading and writing in children from first to fourth grade of primary school (6–10 years).
Battery for the evaluation of writing processes
The PROESC (Cuetos et al., Reference Cuetos, Ramos and Ruano2002) aims to evaluate the main writing processes in children from third grade of primary to adolescents in secondary education (8–15 years old).
Sociodemographic variables
Parents completed a questionnaire on sociodemographic data, including child's gender, age, and country of birth. They also provided information about their educational level, occupation, and country of birth. Students who were not native Spanish or with at least one foreign-born parent were considered of foreign origin. Parents' education and occupation were weighted to compute the Hollingshead Four-Factor Index (Hollingshead, Reference Hollingshead2011), a measure of SES ranging from 8 to 66, where higher scores reflect higher SES.
Statistical analyses
All analyses were performed with SPSS 22.0. We present descriptive statistics for the prevalence of ND, already-diagnosed cases, and sociodemographic characteristics in the second-phase population. Prevalence estimates were compared by gender (male, female), age, educational stage (primary, secondary education), type of school (public, private), SES, and ethnicity (native, foreign origin) using the χ2 test for categorical variables and the Mann–Whitney U test for continuous variables. Those variables found to be significant in bivariate analyses were subsequently included in multivariate logistic regression models to determine the factors independently associated with each diagnostic category, in accordance with previous publications (Fortes et al., Reference Fortes, Paula, Oliveira, Bordin, de Jesus Mari and Rohde2016; Goldfield & Hayes, Reference Goldfield and Hayes2012; Madsen et al., Reference Madsen, Ravn, Arnfred, Olsen, Rask and Obel2018). A two-sided p value of 0.05 was set as significance level in all tests.
Results
Sample characteristics
Among the 28 participating schools, 25 were located in urban regions with more than 5000 inhabitants and a population density of above 600 inhabitants/km2 at the time of the study. The rest were in villages with populations around 1400–3000 and accounted for 2.03% (n = 139) of the second-phase sample. Specifically, the majority of students (n = 4022, 58.8%) attended schools from the Barcelona Metropolitan Area, including cities such as Rubí (n = 1286, 18.8%), Sant Cugat (n = 1860, 27.2%), and Barcelona (n = 876, 12.8%), which had an approximate population of 75 700, 88 800, and 1 600 000, respectively. The sample comprised 3852 (56.4%) boys and 2982 (43.6%) girls with ages ranging from 5 to 17 years (M = 9.40; s.d. = 2.87), 4720 (69.1%) were primary students, and 3811 (55.8%) went to public schools. Subjects had predominantly a Spanish background (80.7%), although those of foreign origin were slightly over-represented among schools placed in an urban environment (18.0% v. 12.1%). Students who were not born in Spain (n = 336) came mostly from Spanish-speaking countries (n = 141), Russia (n = 50), China (n = 30), and Morocco (n = 20). In addition, 868 native Spanish children were considered of foreign origin because they had one (n = 497) or both (n = 371) foreign-born parents, the majority of whom came from Latin America (n = 401) and Morocco (n = 117). The average Hollingshead Four-Factor Index in this sample was 43.4 (s.d. = 13.6), which corresponds to a middle-class household income.
Prevalence rates and demographics
Previous diagnoses
Four hundred and twenty-three (6.19%) participants had received a previous diagnosis of ND, including ID (0.35%), communication disorders (0.40%), ASD (0.51%), ADHD (3.92%), SLD in reading or writing (2.69%), and motor disorders (0.22%). As shown in Table 1, there were significant differences in the prevalence of already-diagnosed cases with regard to gender, age, educational stage, and type of school. Specifically, males [odds ratio (OR) 2.17, 95% confidence interval (CI) 1.73–2.72, p < 0.001], older children (OR 1.22, 95% CI 1.17–1.26, p < 0.001), and students from private schools (OR 1.62, 95% CI 1.32–1.98, p < 0.001) were more likely to report a clinically known ND, according to the multivariate regression analysis. The association with educational stage, however, did not remain significant in the adjusted model.
Table 1. Prevalence of already-diagnosed ND by sociodemographic variables
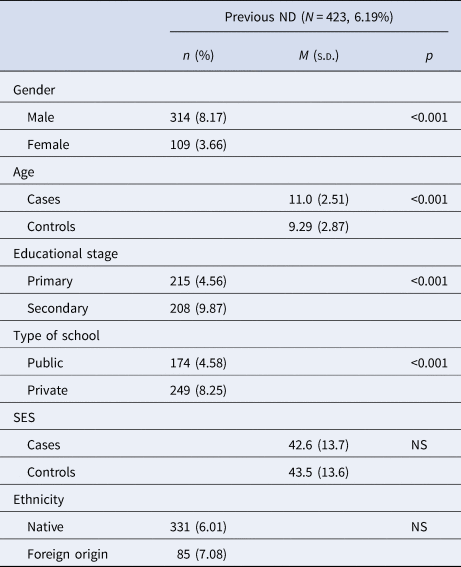
ND, neurodevelopmental disorders; M, mean; s.d., standard deviation; SES, socioeconomic status; NS, non-significant.
Prevalence estimates across sociodemographic variables were determined as the number of cases divided by the total number of students in each subgroup.
Neurodevelopmental disorders
A total of 1249 (18.3%) subjects met criteria for at least one ND based on the diagnostic assessment conducted in the second phase of the study. Table 2 presents the patterns of prevalence among the sociodemographic groups assessed. The multivariate regression model showed that male gender, age, low SES, and being of foreign origin were risk factors for a ND (Table 3).
Table 2. Prevalence of ND by sociodemographic variables
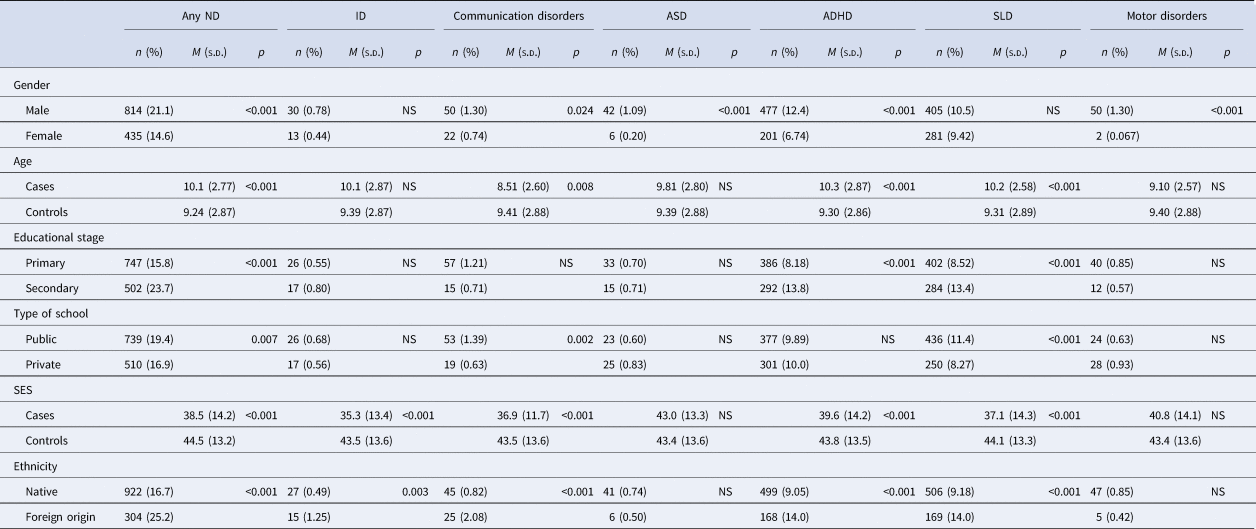
ND, neurodevelopmental disorders; ID, intellectual disabilities; ASD, autism spectrum disorder; ADHD, attention-deficit/hyperactivity disorder; SLD, specific learning disorder; M, mean; s.d., standard deviation; NS, non-significant; SES, socioeconomic status.
Prevalence estimates across sociodemographic variables were determined as the number of cases divided by the total number of students in each subgroup.
Table 3. Sociodemographic variables associated with ND in the multivariate regression analyses
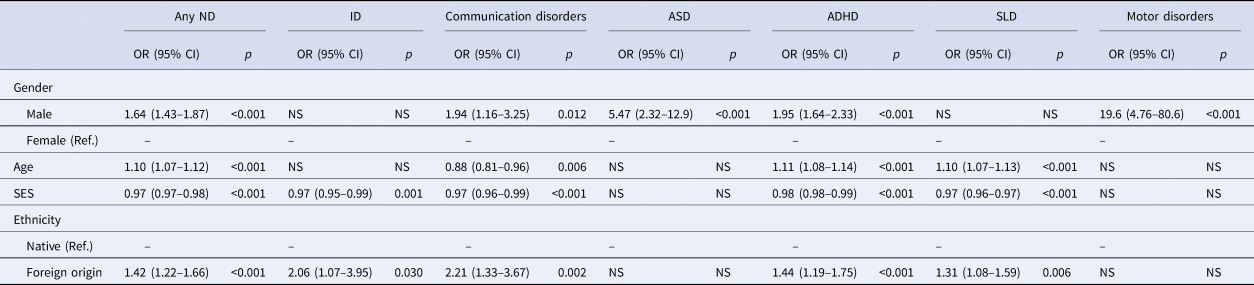
ND, neurodevelopmental disorders; ID, intellectual disabilities; ASD, autism spectrum disorder; ADHD, attention-deficit/hyperactivity disorder; SLD, specific learning disorder; OR, odds ratio; CI, confidence interval; NS, non-significant; SES, socioeconomic status.
Intellectual disabilities
Forty-three children were diagnosed with ID, resulting in a prevalence of 0.63%. Cases were equally distributed by gender, age, educational stage, and type of school, although there were differences with regard to SES and ethnicity (Table 2). In particular, the prevalence rate significantly decreased with SES, whereas students of foreign origin evidenced higher odds of having ID when both factors were taken into account (Table 3).
Communication disorders
Communication disorders were found in 72 (1.05%) participants. As shown in Table 2, the prevalence was significantly different across each of the sociodemographic groups compared, with the exception of educational stage. At the adjusted analysis, foreign origin was the strongest predictor, followed by being male, low SES, and age. School type, on the contrary, did not show association in the full model (Table 3).
Autism spectrum disorder
Forty-eight students were identified as having ASD, which represents a prevalence rate of 0.70%. Among all the assessed variables, only gender was significantly associated with ASD (Table 2). Specifically, the male to female ratio was 7:1 and boys had more than five-fold higher odds of being diagnosed (Table 3).
Attention-deficit/hyperactivity disorder
The overall prevalence of children with ADHD was 9.92% (n = 678). Of these, 47.8% (n = 324) met criteria for the combined presentation, 44.2% (n = 300) had the predominantly inattentive presentation, and 7.96% (n = 54) were diagnosed with the predominantly hyperactive-impulsive presentation. Bivariate analyses indicated that the relationship between school type and the diagnosis rates was not significant. Conversely, boys, older children, students in secondary education, those from families with low SES, and children of foreign origin appeared to have a higher prevalence of ADHD (Table 2). Of these, gender, age, SES, and ethnicity were identified as significant predictors in the multivariate regression model, whereas educational stage was no longer associated with the disorder (Table 3).
The same pattern of distribution across groups was noted for the combined and predominantly inattentive presentations (Table 4), although the results of the multivariate analyses differed slightly. Boys (OR 1.84, 95% CI 1.44–2.35, p < 0.001), students from families with low SES (OR 0.97, 95% CI 0.97–0.98, p < 0.001), and those of foreign origin (OR 1.43, 95% CI 1.10–1.87, p = 0.008) were more likely to have the combined presentation. The predominantly inattentive presentation, on the other hand, was also associated with age (OR 1.17, 95% CI 1.12–1.22, p < 0.001), in addition to gender (OR 1.85, 95% CI 1.43–2.38, p < 0.001), SES (OR 0.99, 95% CI 0.98–1.00, p = 0.010), and ethnicity (OR 1.47, 95% CI 1.11–1.93, p = 0.006). Finally, the predominantly hyperactive-impulsive presentation was significantly more prevalent in males (n = 40, 1.04%) than females (n = 14, 0.47%), so boys were at higher risk of meeting diagnostic criteria (OR 2.22, 95% CI 1.21–4.10, p = 0.008).
Table 4. Prevalence of ADHD presentations by sociodemographic variables

ADHD, attention-deficit/hyperactivity disorder; ADHD-C, attention-deficit/hyperactivity disorder combined presentation; ADHD-I, attention-deficit/hyperactivity disorder predominantly inattentive presentation; ADHD-HI, attention-deficit/hyperactivity disorder predominantly hyperactive-impulsive presentation; M, mean; s.d., standard deviation; SES, socioeconomic status; NS, non-significant.
Prevalence estimates across sociodemographic variables were determined as the number of cases divided by the total number of students in each subgroup.
Specific learning disorder
The prevalence of SLD was 10.0% (n = 686), with reading and writing difficulties being present in 9.28% (n = 634) and 5.18% (n = 354) of the sample, respectively. Bivariate analyses indicated a relationship between SLD and each of the sociodemographic variables assessed, except for gender (Table 2). The influence of educational stage and type of school did not remain significant in the full model, whereas age, SES, and ethnicity were identified as risk factors for SLD (Table 3).
Similarly, both reading and writing difficulties had a higher prevalence among older children, students in secondary education, those from families with low SES, and children of foreign origin (Table 5). Besides, there was a significant difference in the rate of reading difficulties between subjects attending public and private schools (10.7% v. 7.51%, p < 0.001). Writing difficulties, on the contrary, were more frequent in boys than girls (5.74% v. 4.46%, p = 0.018), with a male to female ratio of 1.7:1. At adjusted analyses, factors significantly associated with reading difficulties included age (OR 1.09, 95% CI 1.05–1.12, p < 0.001), SES (OR 0.97, 95% CI 0.96–0.97, p < 0.001), and ethnicity (OR 1.24, 95% CI 1.01–1.52, p = 0.037), whereas gender also predicted the occurrence of writing difficulties (OR 1.37, 95% CI 1.09–1.71, p = 0.007), in addition to age (OR 1.07, 95% CI 1.03–1.11, p = 0.001), SES (OR 0.97, 95% CI 0.96–0.98, p < 0.001), and foreign origin (OR 1.66, 95% CI 1.29–2.12, p < 0.001).
Table 5. Prevalence of SLD with difficulties in reading and writing by sociodemographic variables
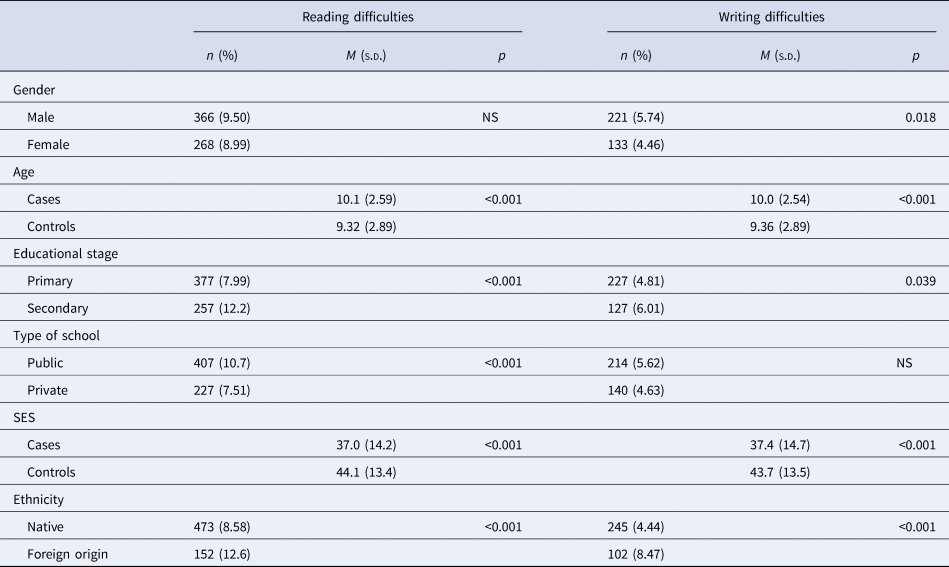
SLD, specific learning disorder; M, mean; s.d., standard deviation; NS, non-significant; SES, socioeconomic status.
Prevalence estimates across sociodemographic variables were determined as the number of cases divided by the total number of students in each subgroup.
Motor disorders
Fifty-two (0.76%) students had motor disorders, 50 (1.30%) of whom were male. Indeed, boys were more likely to meet criteria for a motor disorder than girls, whereas no significant differences were found in prevalence rates with regard to age, educational stage, type of school, SES, and ethnicity (Tables 2 and 3).
Discussion
To our knowledge, this is the first study to provide the prevalence rates and sociodemographic correlates of ND in a large school-based sample of Spanish children aged 5–17. Overall, the prevalence of students with at least one ND was estimated at 18.3%, although a substantial proportion of them (66.1%) had never been previously diagnosed.
In particular, we found the prevalence of ID to be 0.63%, which is comparable to that reported by Hughes-McCormack et al. (Reference Hughes-McCormack, Rydzewska, Henderson, MacIntyre, Rintoul and Cooper2018) for the Scotland's population. The authors identified a total of 26 349 (0.50%) people with ID, including 5234 (0.60%) children/youth from 0 to 15 years. However, it should be noted that the study from Hughes–McCormack covered a wider age range, since they examined children who were not in primary education yet. Given that they observed an increase in the identification of ID until age 5 years, our estimate might be slightly greater. In this regard, Boyle et al. (Reference Boyle, Boulet, Schieve, Cohen, Blumberg, Yeargin-Allsopp and Kogan2011) found a prevalence of 0.71% among a nationally representative sample of US children aged 3–17 using data from the 1997–2008 National Health Interview Surveys (Boyle et al., Reference Boyle, Boulet, Schieve, Cohen, Blumberg, Yeargin-Allsopp and Kogan2011). Additionally, our rate significantly decreased with SES whereas students of foreign origin evidenced higher odds of having ID. These results concur with previous research that shows an association between ID and socioeconomic disadvantage (McGuire et al., Reference McGuire, Tian, Yeargin-Allsopp, Dowling and Christensen2019).
The prevalence of communication disorders (1.05%), on the other hand, was lower than the estimated in an American sample of 8-year-olds (6.34%, 95% CI 6.04–6.62; Pinborough-Zimmerman et al., Reference Pinborough-Zimmerman, Satterfield, Miller, Bilder, Hossain and McMahon2007). Similarly, data from the 1988 National Health Interview Survey in the United States showed that 1.89% of children aged under 17 had stammering or stuttering, whereas 2.65% had other speech defects (Boyle, Decouflé, & Yeargin-Allsopp, Reference Boyle, Decouflé and Yeargin-Allsopp1994). In contrast, the Second National Sample Survey on Disability of China revealed that the prevalence of speech disability was 0.53% (Zheng, Zhang, Chen, Pei, & Song, Reference Zheng, Zhang, Chen, Pei and Song2008), thus suggesting a wide variability in prevalence rates between studies. These remarkable disparities may reflect differences in the terminology, diagnostic criteria, population characteristics (e.g. proportion of subjects with foreign language background), and methodologies applied. In this sense, previous reports mostly relied on questionnaire surveys of parents and teachers, whereas the current investigation used direct assessment by speech therapists to identify participants with communication disorders. Nevertheless, the relationship found between communication disorders and sociodemographic variables such as gender, age, SES, and ethnicity agrees with past research reporting higher rates of speech and language disabilities among boys, younger children, those socially disadvantaged, and of foreign origin (Dockrell & Hurry, Reference Dockrell and Hurry2018; Rosenbaum & Simon, Reference Rosenbaum and Simon2016).
Our estimate for ASD (0.70%) was within the expected range of 0.60–1.00% derived from systematic reviews of the epidemiological literature (Fombonne, Reference Fombonne2009; Hill et al., Reference Hill, Zuckerman, Fombonne, Volkmar, Rogers, Paul and Pelphrey2014). Similarly, the rates recently found in Spain following a two-phase design vary from 0.61% in toddlers to 1.00% in primary school children (Fortea et al., Reference Fortea, Escandell and Castro2013; Morales-Hidalgo et al., Reference Morales-Hidalgo, Roigé-Castellví, Hernández-Martínez, Voltas and Canals2018). Additionally, the over-representation of boys observed is also consistent with results from previous research, although the male to female ratio was higher than the general ratio of 4:1 (Werling & Geschwind, Reference Werling and Geschwind2013).
The ADHD prevalence provided in the present study (9.92%) was higher than the worldwide pooled prevalence for children and adolescents (5.90–7.10%; Willcutt, Reference Willcutt2012) and the average prevalence in Spain, estimated at 6.80% (95% CI 4.90–8.80) by Catalá-López et al. (Reference Catalá-López, Peiró, Ridao, Sanfélix-Gimeno, Gènova-Maleras and Catalá2012) through a meta-analysis of 14 epidemiological studies. Interestingly, however, García-Jiménez, López-Pisón, and Blasco-Arellano (Reference García-Jiménez, López-Pisón and Blasco-Arellano2005) obtained a prevalence rate of 9.00%, using a two-stage survey to determine the DSM-IV ADHD prevalence in a school population of children with ages between 6 and 12 years. Comparable figures have also been found among 4- to 18- (10.3%; Vicente et al., Reference Vicente, Saldivia, de la Barra, Kohn, Pihan, Valdivia and Melipillan2012) and 8- to 15-year-old youths (8.60%, 95% CI 7.20–10.0; Merikangas et al., Reference Merikangas, He, Brody, Fisher, Bourdon and Koretz2010), as established by the Diagnostic Interview Schedule for Children version IV. Furthermore, Wolraich et al. (Reference Wolraich, McKeown, Visser, Bard, Cuffe, Neas and Danielson2014) screened 10 427 children from four school districts in South Carolina and Oklahoma and reported rates of 8.70% (95% CI 7.20–10.5) and 10.6% (95% CI 7.50–14.9), respectively. Regarding ADHD presentations, population-based studies have yielded mixed results. In this sense, our estimates are in line with those showing a predominance of the combined presentation, followed by the inattentive and hyperactive-impulsive presentations (Angold et al., Reference Angold, Erkanli, Farmer, Fairbank, Burns, Keeler and Costello2002; Ford, Goodman, & Meltzer, Reference Ford, Goodman and Meltzer2003; Rodhe et al., Reference Rodhe, Biederman, Busnello, Zimmermann, Schmitz, Martins and Tramontina1999). Finally, the analysis of sociodemographic correlates provided evidence that add to a wealth of data from epidemiological research, since the increased prevalence of ADHD in boys and socioeconomically disadvantaged children has been well established (Willcutt, Reference Willcutt2012). Nevertheless, no significant differences were found across age, except for the predominantly inattentive presentation, which tended to persist over time, as shown in longitudinal studies.
With respect to SLD, the overall prevalence was 10.0%, which falls within the range of 5.00–15.0% proposed by the DSM-5. Reading difficulties were the most common SLD and our rate (9.28%) converged the upper end of the worldwide prevalence range for school-age children, estimated to be between 4.00% and 11.0% (Karande & Kulkarni, Reference Karande and Kulkarni2005; Sexton, Gelhorn, Bell, & Classi, Reference Sexton, Gelhorn, Bell and Classi2012). Consistently, previous studies in Spain yielded values of 8.60% and 11.8% among primary students (Carrillo, Alegría, Miranda, & Sánchez, Reference Carrillo, Alegría, Miranda and Sánchez2011; Jiménez, Guzmán, Rodríguez, & Artiles, Reference Jiménez, Guzmán, Rodríguez and Artiles2009). Writing difficulties, on the other hand, were found in 5.18% of the participants. This figure is in line with Fortes et al. (Reference Fortes, Paula, Oliveira, Bordin, de Jesus Mari and Rohde2016), who provided a prevalence of 5.40% in a representative school sample of second to sixth graders from Brazil, and slightly lower than the rate reported by González et al. (Reference González, Jiménez, García, Díaz, Rodríguez, Crespo and Artiles2010) for Spanish adolescents (6.10%), based on a semi-structured interview with the teachers. However, differences in the study population, definitions, methods, and diagnostic criteria may account for the discrepant results. Moreover, the current investigation supports the association of age and SES with learning difficulties. Indeed, previous research evidenced a higher prevalence of SLD among older students and children from lower SES, due to the increasing academic demands of the school curriculum and a less favourable environment for learning that hinders the acquisition of language skills (Abu-Hamour & Al-Hmouz, Reference Abu-Hamour and Al-Hmouz2016; Fortes et al., Reference Fortes, Paula, Oliveira, Bordin, de Jesus Mari and Rohde2016). Finally, we found a preponderance of boys with difficulties in writing, whereas the gender ratio for reading disabilities was balanced. These results replicate those from Moll, Kunze, Neuhoff, Bruder, and Schulte-Körne (Reference Moll, Kunze, Neuhoff, Bruder and Schulte-Körne2014) and are in line with data indicating that boys and girls are equally affected by dyslexia (Jiménez et al., Reference Jiménez, García de la Cadena, Siegel, O'Shanahan, García and Rodríguez2011; Pennington, Peterson, & McGrath, Reference Pennington, Peterson, McGrath and Pennington2009). The relationship between SLD and ethnicity, on the contrary, might be attributed to the language background of children with foreign origin, although a substantial proportion (86.3%) of them spoke either Spanish or Catalan at home. Therefore, we cannot rule out the influence of other sociocultural factors, especially considering that ethnicity was also a risk factor for ND such as ID and ADHD in the present sample.
The prevalence of motor disorders in the current investigation is significantly low compared to earlier reports, showing estimates of 4.00–20.0% for tic disorders (Cubo et al., Reference Cubo, Trejo Gabriel y Galán, Ausín Villaverde, Sáez Velasco, Delgado Benito, Vicente Macarrón and Benito-León2011) and 5.00–19.0% for developmental coordination disorder among school-age children (Delgado-Lobete et al., Reference Delgado-Lobete, Santos-Del-Riego, Pértega-Díaz and Montes-Montes2019). Nevertheless, it is in accordance with a recent study conducted in Spain, where only 1.09% of children received a clinical diagnosis of a neurodevelopmental motor disorder (Carballal Mariño et al., Reference Carballal Mariño, Gago Ageitos, Ares Alvarez, del Rio Garma, García Cendón, Goicoechea Castaño and Pena Nieto2018). The male dominance, on the other hand, has consistently been reported and, as expected, we found that boys were more likely to meet criteria for a motor disorder than girls (Knight et al., Reference Knight, Steeves, Day, Lowerison, Jette and Pringsheim2012).
Thus, the prevalence rates of ND in the present sample largely concur with findings from different countries. Strikingly, however, only 6.19% of the participants had received a formal diagnosis before the study, which suggests that ND are widely underestimated among Spanish school-age children. According to previous investigations, several sociodemographic and contextual factors might affect the probability of a child to be referred to diagnostic services. For instance, female gender, non-white ethnicity, rural residence, low parental education, and socioeconomic disadvantage have been identified as barriers to accessing care (Sayal, Prasad, Daley, Ford, & Coghill, Reference Sayal, Prasad, Daley, Ford and Coghill2018; Thomas, Ellis, McLaurin, Daniels, & Morrissey, Reference Thomas, Ellis, McLaurin, Daniels and Morrissey2007). Similarly, we found that males, older children, and students from private schools were more likely to report a clinically known diagnosis.
Given that children with ND are at risk for academic failure, dropout, social emotional difficulties, poorer mental health in adulthood, and unemployment (Dockrell & Hurry, Reference Dockrell and Hurry2018), our results reinforce the need for early detection and intervention programmes to improve their developmental trajectories and quality of life. In this sense, schools may offer the best environment to implement regular screening, which has shown to increase the likelihood of being identified and referred to intervention facilities in a timely manner, thus yielding positive health and educational outcomes (Guevara et al., Reference Guevara, Gerdes, Localio, Huang, Pinto-Martin, Minkovitz and Pati2013; Zwaigenbaum et al., Reference Zwaigenbaum, Bauman, Choueiri, Kasari, Carter, Granpeesheh and Natowicz2015).
The findings of this first attempt to estimate the prevalence of ND among Spanish students should be interpreted in light of some strengths and limitations. The main advantages include the use of a large sample, covering a broad age range, and the comprehensive case identification based on the administration of screening tools to different informants and standardised instruments for diagnostic confirmation by trained psychiatrists and neuropsychologists. Moreover, we considered and controlled for multiple sociodemographic factors in assessing ND. Finally, our study incorporated a school-based sample, which allowed the detection of undiagnosed children and provides a more valid reflection of the broader population than a clinically derived sample.
Nevertheless, students who screened negative did not undergo the clinical ascertainment and, therefore, false negatives might have occurred. Similarly, we might have misclassified some cases, since we computed T scores on the CBCL/TRF/YSR and CPRS-R:S/CTRS-R:S based on the distribution of normative samples from the United States and values may differ across cultures. Besides, we concentrated on scores that were clearly in the clinical range (i.e. T score ⩾70) in order to minimise the number of false positives, considering the sample size, study design, and available resources, which may have also increased the rate of false negatives. However, additional criteria were considered to screen positive, including the presence of high-risk indicators on the PRODISCAT, which is specifically designed for the Spanish school population, or a previous diagnosis of ND, thus increasing the chance to detect children with difficulties. On the other hand, we could not test whether children who refused to participate in the screening phase differed from those who eventually comprised the study population with respect to sociodemographic variables, since this information was not available for the former. Yet, we observed that students in secondary education and those attending private schools or schools located in a rural setting were over-represented among non-participants, which may have biased the estimated prevalence. Furthermore, the research was conducted in schools from seven different counties in Catalonia and thus its generalisation to other Catalan or Spanish regions is uncertain. Indeed, the selected sample included a higher proportion of boys (56.4%) and primary school students (69.1%) than that of Catalonia (51.4% and 60%) and Spain (51.5% and 59.8%), according to the most recent data from the Spanish Ministry of Education. Public schools, on the other hand, constitute 65.4% and 66.9% of the total Catalan and Spanish schools, respectively, whereas in the current study subjects from public schools were underrepresented (55.8%). Conversely, the percentage of students with foreign origin (19.3%) outnumbered that reported in Catalonia (14.4%) and Spain (9.85%), although these differences may be due to the definition established by the Ministry of Education, which refers to foreign students as those who do not have Spanish nationality. Given that these sociodemographic characteristics may affect prevalence rates, future epidemiological studies using random sampling techniques are required to increase the representativeness of the population and fully validate these results.
Acknowledgements
We are grateful to families, teachers, and staff of the public primary schools (i.e. Joan Maragall, Maria Borés, Marquès de la Pobla, Martinet, Pins del Vallès, Puiggraciós, Ramon Llull, Rivo Rubeo, Sant Jordi, Tagamanent, Teresa Bergadà, and Víctor Català), public secondary schools (i.e. Angeleta Ferrer i Sensat, Duc de Montblanc, Flos i Calcat, Manuel de Montsuar, Molí de la Vila, Vallbona d'Anoia, and Vil⋅la Romana), and private schools (i.e. Airina, Episcopal de Lleida, Garbí Pere Vergés Esplugues, La Farga, Pia Santa Anna – Mataró, Pia Sarrià-Calassanç, Pureza de María Sant Cugat, Regina Carmeli – Rubí, and Thau Barcelona), who kindly participated in this study, as well as to the Ministry of Education of Generalitat de Catalunya.
Financial support
This study was funded by ‘la Caixa’ Banking Foundation, Diputació de Barcelona, Diputació de Lleida, and Ministry of Health of Generalitat de Catalunya.
Conflict of interest
Prof. Casas has received travel grants and research support from Eli Lilly and Co., Janssen, and Shire. He has been on the advisory board and served as a consultant for Eli Lilly and Co., Janssen, and Shire. Prof. Ramos-Quiroga has served on the speakers' bureau and acted as consultant for BGaze, Bial, Ferrer, Janssen, Laboratorios Rubió, Lundbeck, Medice, Novartis, Ono, Shionogi, Shire, Sincrolab, and Takeda. He has received travel awards from Janssen, Medice, Shire, and Takeda for participating in psychiatric meetings. The Department of Psychiatry chaired by Prof. Ramos-Quiroga has received unrestricted educational and research support from BGaze, Fundació Barça, Fundació Probitas, Janssen, Laboratorios Rubió, Lundbeck, Nesplora, Oryzon, Psious, Roche, Rovi, and Shire in the past 2 years. The other authors declare no conflict of interest.


