


Ceramic remnants potentially bear significant information about ancient societies, in particular prehistoric ones. In some cases, a few sherds may indicate the technological level and knowledge of the environment, including sources of raw materials. When characterizing ceramic artefacts recovered from archaeological sites, complex scientific approaches are commonly used because a mere macroscopic investigation may not offer answers to questions regarding the raw materials, the modelling or the firing conditions. Findings from caves are particularly important as they may reflect either a permanent settlement or a temporary use of the area. The latter might have been related to various activities such as hunting, plant gathering and forest exploitation. Caves were also provisory refuges in times of danger.
The beginning of the Copper Age in Banat (the southwestern part of present-day Romania) and Transylvania (the central part of present-day Romania) is marked by the onset of the so-called ‘Foeni Group’ culture and shows distinct social and economic features (Gligor, Reference Gligor2014). More than 20 archaeological sites have been assigned to this group (Gligor, Reference Gligor2008a). The only Foeni-type sherds investigated archaeometrically so far have been those excavated at the Lumea Nouă–Alba Iulia site in southwest Transylvania (Fabbri et al., Reference Fabbri, Gualtieri, Varvara, Gligor, Cosma, Varvara and Gligor2008, 2009; Binţinţan et al., Reference Bințințan, Gligor, Dulamă, Rădulescu, Stihi, Ion, Teodorescu, Știrbescu, Bucurică and Pehoiu2019) and in some sites in Banat (Spataro, Reference Spataro2011).
The aim of this study was to obtain information on pottery production at the dawn of the Copper Age in the Southern Carpathians (Romania), an area subject to multiple cultural influences. Taking into account the general scarcity of Foeni ceramic artefacts, even a small number of sherds may offer essential social, economic and technological information. Pottery sherds excavated in the Great Cave of Cerișor (GCC) from the Southern Carpathians were studied mineralogically and petrographically using polarized light optical microscopy (OM), X-ray powder diffraction (XRPD) and electron microprobe analysis (EMPA). The OM provides information on the optical character of the matrix and the mineralogy/petrography of the clasts (Maggetti, Reference Maggetti1979, Reference Maggetti, Olin and Franklin1982), whereas the XRPD helps to determine mineral species and thermal changes (Heimann, Reference Heimann and Hunt2017). Electron microprobe analysis is a basic tool for determining the exact chemistry of phases and thus precisely identifying the minerals (Ionescu et al., Reference Ionescu, Hoeck and Ghergari2011; Ionescu & Hoeck, Reference Ionescu, Hoeck and Hunt2017). We aimed to define compositionally the sherds and to assess the technological conditions of pottery production. The results obtained were compared with previous published data on pottery found in the same cave in order to identify the raw materials potentially involved in obtaining the ceramic paste.
Archaeological context
The caves from the Poiana Ruscă Mountains in the Southern Carpathians contain various remnants of Neolithic cultures. The most famous among these caves are the Cauce Cave (Spataro, Reference Spataro2011; Drașovean, Reference Draşovean2013) and the GCC (Peștera Mare de la Cerișor in Romanian) (Fig. 1). The latter opens on the right slope of the Runc Valley at ~2.5 km northeast of Cerișor village (coordinates: N45°45′7.74″ and E22°46′18.54″). At the entry, there is a large room 20 m × 5 m × 6 m in size, with a floor covered in a layer of clay and silty clay mixed with dolomite fragments. The discovery of ceramic sherds in these cave sediments triggered subsequent archaeological investigation. From the two pits excavated in 2000, potsherds, copper adornments and lithic tools have been unearthed (Roman et al., Reference Roman, Diaconescu and Luca2000). The archaeological finds from the cave were assigned to several cultures (i.e. the late Neolithic Turdaș, the early Copper Age Foeni, the Copper Age Coțofeni and the Bronze Age Wietenberg), indicating a human presence from the late Neolithic to the Bronze Age. So far, only the pottery sherds attributed to the Copper Age Coțofeni culture have been studied (Giurgiu et al., Reference Giurgiu, Ionescu, Hoeck, Tămaș, Roman and Crandell2017).

Fig. 1. Location of the GCC (Peştera Mare de la Cerişor) on a simplified geological map (based on Gherasi et al., Reference Gherasi, Mureșan, Mureșan, Kräutner, Kräutner, Lupu, Marinescu, Savu and Drăgulescu1967; Mureşan et al., Reference Mureşan, Mureşan and Kräutner1980). The upper-right insert shows the position of the map within Romania. The image is modified from Giurgiu et al. (Reference Giurgiu, Ionescu, Hoeck, Tămaș, Roman and Crandell2017). The map also shows the area of Miocene clays sampled by Giurgiu et al. (Reference Giurgiu, Ionescu, Hoeck, Tămaș, Roman and Crandell2017) and the presumed location of pottery production in the Copper Age.
The Foeni Group culture was dated by a radiocarbon technique to a timespan between 4750 and 4400 BCE (i.e. at the beginning of the Copper Age) (Drașovean, Reference Draşovean2013; Gligor, Reference Gligor2014). In today's Romanian territory, the first signs of this culture occurred in the southwest, in the Banat region, and later spread towards the northeast, into an area known as Transylvania. This culture is regarded as a precursor to the well-known Cucuteni and Petrești Copper Age cultures (Drașovean, Reference Draşovean2013; Gligor, Reference Gligor2014). Foeni pottery is predominantly fine and semifine, rarely coarse (Gligor, Reference Gligor2007a) and consists of bowls, porringers, amphorae, cups and platters (Luca et al., Reference Luca, Roman and Diaconescu2004; Gligor, Reference Gligor2007a, Reference Gligor2008b, Reference Gligor2009a). It is typically red and black-topped (Gligor, Reference Gligor2009b, Reference Gligor2014; Bințințan & Gligor, Reference Bințințan and Gligor2016) and has plain and pattern burnished surfaces (Drașovean, Reference Draşovean1994; Gligor, Reference Gligor, Ciută, Florescu, Gligor and Mazăre2007b; Fabbri et al., Reference Fabbri, Gligor, Gualtieri and Varvara2009). Decorations include grooves, incisions, imprints, painted strips, beads and circular and conical knobs (Gligor, Reference Gligor2007a, Reference Gligor2009a).
So far, no remains from pits, surface clamps or kilns from the surroundings of the GCC or from the areas towards the north and east (Fig. 1), where potential clayey raw materials occur, have been documented. There are several reasons for this, including the fragile nature of such constructions, the intense modern agricultural work in the area and the difficulty of distinguishing the remains of firing structures from other archaeological structures (Thér, Reference Thér2004).
Geological background
The GCC is located in the Palaeozoic crystalline dolomites of the Southern Carpathians (Gherasi et al., Reference Gherasi, Mureșan, Mureșan, Kräutner, Kräutner, Lupu, Marinescu, Savu and Drăgulescu1967; Mureşan et al., Reference Mureşan, Mureşan and Kräutner1980; Balintoni, Reference Balintoni1997; Balintoni et al., Reference Balintoni, Balica, Ducea, Chen, Hann and Șabliovschi2009, Reference Balintoni, Balica, Ducea and Hann2014). Other metamorphic rocks, such as micaschists, quartzites, gneisses, graphitic schists, amphibolitic schists and crystalline limestones, crop out in the area (Fig. 1). Metamorphosed volcanic–sedimentary formations containing Fe ore (Kräutner, Reference Kräutner, Klemm and Schneider1977) occur mostly in the south and southeast. West of the town of Teliuc (Fig. 1), there are small bodies of Jurassic dolerites and basalts. Palaeozoic granodiorites have been mapped south of Zlăști village. The area towards the northeast and north is covered by the Miocene sediments of the Transylvanian Basin. The Miocene mudstone areas are currently used for various household purposes, including pottery. The riverbeds are filled with Quaternary sands and gravels. The main river in the area, Cerna, transports quartz, feldspar, muscovite, biotite and chlorite, various heavy minerals and fragments of rocks from its large catchment within the Southern Carpathians.
Samples and analytical methods
The seven sherds found in the cave that could be assigned to the Foeni Group with certainty (Fig. 2, Table 1) were too small to infer vessel typology. The sherds have a shiny appearance due to burnishing, either on the outer surface or on both outer and inner surfaces (Giurgiu et al., Reference Giurgiu, Ionescu, Šarić, Tămaș, Roman and Crandell2015). All samples, except sherd sample CE-77, which is decorated by a ‘pattern burnish’, show so-called ‘plain burnishing’ covering the entire surface (see Ionescu et al., Reference Ionescu, Hoeck, Crandell and Šarić2015). The ‘pattern burnish’ (sherd CE-77) consists of a grid of ~1 mm-wide shiny lines on a smoothed, matte surface. A similar decoration was described for potsherds assigned to the same cultural group (Foeni) and found in the southwestern part of Transylvania (Roman et al., Reference Roman, Diaconescu and Luca2000). The GCC potsherds have a dark grey to reddish–brown surface. Three samples (CE-79, CE-80 and CE-81) display a gradual transition between the reddish and the dark grey areas and are most probably parts of black-topped pots. Small (<1 mm) muscovite lamellae are visible on the surface of samples CE-79, CE-80 and CE-82. Some of the potsherds display a dark grey slip (e.g. CE-77 and CE-82) and one sample has a reddish–brown slip (CE-79). The thickness of the ceramic wall varies between 5 and 11 mm. The sherds show a homogeneous reddish–brown (CE-77, CE-78, CE-82 and CE-83) or grey (CE-81) ceramic wall. One sample (CE-80) displays a bizonal structure, half dark grey and half grey. The so-called ‘sandwich’ structure was identified in sample CE-79, with up to 1 mm-thick outer rims.
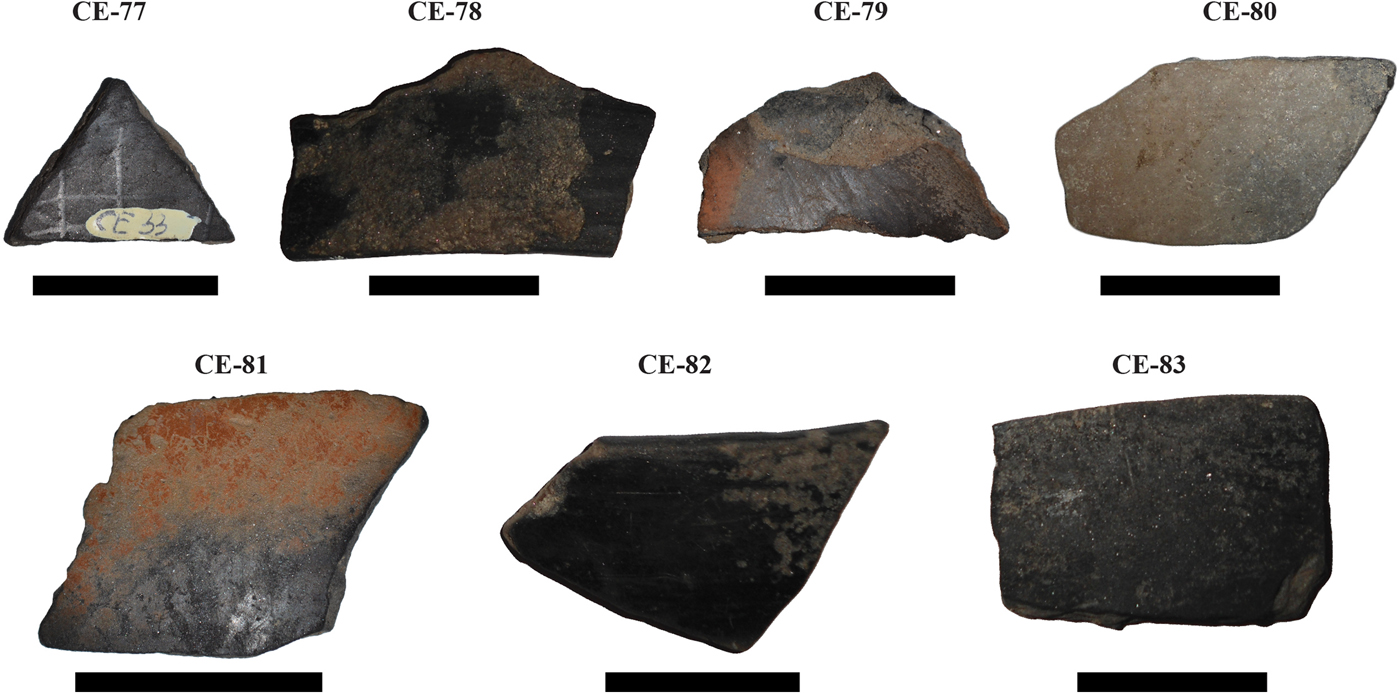
Fig. 2. Foeni Group potsherds from the GCC, consisting of patterned (CE-77) and plain burnished samples (CE-78, CE-79, CE-81, CE-82 and CE-83). Scale bars = 3 cm.
Table 1. Macroscopic characteristics of the Foeni potsherds.

The mineralogical composition and the fabric (texture and structure) of the sherds as well as the optical character of the matrix were studied by polarized light OM. Slices a few millimetres thick were cut across the ceramic wall with a diamond saw in order to prepare thin sections for OM and polished thin sections for EMPA. After cutting, the slices were cleaned with distilled water. OM was carried out at the Department of Geology (Babeș-Bolyai University Cluj-Napoca) with an Axio Imager.A2m Zeiss transmitted light-polarizing microscope equipped with a Zen 2011 Axio high-resolution digital video camera.
In order to determine the crystalline mineral phases, a few grams from each potsherd were hand-milled in an agate mortar and analysed by XRPD with a Bruker D8 Advance diffractometer with a Bragg-Brentano geometry (Department of Geology, Babeş-Bolyai University in Cluj-Napoca) at 35 kV and 45 mA using Co-Kα1 radiation (λ = 1.78897), an Fe 0.01 mm filter and a one-dimensional detector. The data were collected between 5° and 64°2θ using a 0.02°2θ step and a 0.2 s counting time per step. The SRM 1976a corundum (US National Institute of Standards and Technology reference material; www.nist.gov/programs-projects/powder-diffraction-srms) was used for calibration purposes. For mineral identification, the XRPD data were compared with Bruker's Diffrac.Eva 2.1 software, data from the International Center for Diffraction (www.icdd.com) and data from Caroll (Reference Caroll1970) and Moore & Reynolds (Reference Moore and Reynolds1997).
Two polished thin sections (CE-80 and CE-83), coated with carbon under vacuum, were analysed at Salzburg University with a JXA Superprobe 8600 electron microprobe, equipped with four wavelength-dispersive spectrometers and one Si(Li) energy-dispersive spectrometer to determine the microchemistry of the phases comprising the matrix in particular clay minerals and muscovite. Heavy minerals and Fe-rich materials were also identified by EMPA. The equipment operated at a 15 kV accelerating voltage, a 40 nA beam current and a ≤3 µm electron-beam diameter. For back-scattered electron (BSE) image acquisition, the beam current was reduced to 10–15 nA. The description of the analytical details follows Ionescu & Hoeck (Reference Ionescu and Hoeck2011). The following standards were used: quartz (for SiO2), synthetic γ-alumina (for Al2O3), synthetic iron oxide (for FeOTOT), rutile (for TiO2), apatite (for CaO and P2O5), synthetic periclase (for MgO), halite (for Na2O), sylvite (for K2O), pyrolusite (for MnO) and barium glass (for BaO). The final chemical composition was calculated following the atomic number effect correction (known as ‘ZAF’), based on the relation between concentration and X-ray intensity (Heinrich, Reference Heinrich, Heinrich and Newbury1991). The detection limits were 0.02 mass% for MgO, CaO, Na2O and K2O, 0.03 mass% for Al2O3 and MnO, 0.04 mass% for TiO2, 0.05 mass% for SiO2, 0.06 mass% for FeO and 0.07 mass% for P2O5 and BaO. The counting times were 20 s for each peak and 10 s for the background. The analytical data are presented in mass%, according to the International System of Units (Taylor, Reference Taylor2001).
Results
Optical microscopy
The potsherd bodies consist of two major components: (1) a matrix (i.e. a mixture of thermally transformed clay minerals and aplastic (micro)clasts); and (2) various aplastic (macro)clasts – referred to here as ‘clasts’ (Fig. 3a–f). The border between these components is conventionally set at either 0.015 mm (Maggetti, Reference Maggetti1979) or 0.02 mm (Ionescu et al., Reference Ionescu, Hoeck and Ghergari2011). The texture is not oriented (Fig. 3b,c,e) and has a random arrangement of phyllosilicate lamellae (Fig. 3b,c). Samples CE-80 and CE-81 locally show an oriented texture (Fig. 3d,f).

Fig. 3. Polarized light micrographs of the Foeni potsherds. (a) Iron pellet (black) showing a light diffusion aureole merging into the surrounding, translucent matrix (Mx) in sample CE-86. (b) Fragment of amphibolite schist (Amp) and a lamella of graphite (Gr) in sample CE-79. (c) Quartzo-feldspathic lithoclast marked with a dashed line, quartz (Qz), muscovite (Ms) and clinozoisite (Czo) in a birefringent matrix in sample CE-79. (d) Oriented texture in sample CE-81. (e) Quartz and micaschist (marked by a dashed line) fragments in sample CE-79. (f) Large ceramoclast (marked by a dashed line) in sample CE-83. Mineral abbreviations are according to Whitney and Evans (Reference Whitney and Evans2010) and are used throughout this paper. Images (a) and (b) were obtained with one polarizer, and all others with crossed polarizers.
Under plane-polarized light, the matrix is translucent and light to dark brown in colour (Fig. 3a,b) and sometimes contains a fine-grained opaque phase. With crossed polarizers, the matrix is highly birefringent in most samples (Fig. 3c,d,f) and shows only thin isotropic areas between the clay minerals, due to sintering. Only samples CE-77 and CE-79 show a lower birefringence and larger but isolated isotropic areas (Fig. 3e). The clay minerals are prevalent in the matrix but cannot be identified due to the limitations of OM resolution. Microclasts of quartz (Fig. 3c–f), muscovite, biotite, plagioclase, alkali feldspar, apatite, epidote, clinozoisite and unidentified opaque minerals were identified as components of the matrix (Table 2).
Table 2. Phase composition of the ceramic sherds as determined by optical microscopy.

Plus signs indicate presence; minus signs indicate absence.
Afs = alkali feldspar; Ep = epidote; Grt = garnet; P+ = crossed polarizers; Pl = plagioclase; St = staurolite.
The macroclasts (>0.02 mm in size) are mostly quartz, micas, plagioclase and alkali feldspar, besides various lithoclasts, opaque phases and heavy minerals. Quartz is angular or subangular and displays a network of cracks in some cases. Muscovite occurs as large (Fig. 3c) or small (Fig. 3d,f) lamellae. Biotite is either fresh or partly altered to chlorite accompanied by opaque minerals. Lamellae of discrete chlorite are also present. Polysynthetically twinned plagioclase is frequent. The grains of alkali feldspar are slightly altered to fine-grained muscovite (‘sericite’). Heavy minerals are diverse: epidote, clinozoisite, staurolite, amphibole, garnet and apatite. The lithoclasts are scarce and include quartzite, micaschist (Fig. 3e), amphibolitic schist (Fig. 3b) and quartzo-feldspathic rock (Fig. 3c).
Opaque material 25–50 µm in size is ubiquitous and is distributed unevenly in the ceramic body (Fig. 3a). It probably consists of iron pellets (‘bohnerz’; Maggetti, Reference Maggetti1979), Fe-rich pedogenic concretions and graphite lamellae (Fig. 3b). Clay pellets have also been identified. The ceramoclasts (i.e. fragments of chamotte) are restricted to sherds CE-82 and CE-83 (Table 2, Fig. 3f).
Granulometrically, two groups of clasts were identified, marking a so-called ‘hiatal’ structure. The first group includes grains <0.02 mm in size, within the range of the matrix. The second group includes most of the clasts, up to 0.6 mm in size, with an average of between 50 and 100 µm. The clasts from the latter group are classified within the coarse silt and the very fine sand (Wentworth, Reference Wentworth1922). Granulometrically, only sample CE-79 is semifine; the remaining samples are fine-grained.
X-ray powder diffraction
The XRPD traces show a fairly uniform mineralogical composition for the sherds, with quartz, an illite-like phase, muscovite and feldspars as the main mineral phases (Fig. 4). The 1 nm, 0.45 nm and 0.26 nm peaks are common to both an illite-like mineral and muscovite, so the term ‘illite-muscovite’ will be used hereafter. The XRPD traces are arranged according to the appearance of the 1 nm illite-muscovite peak (Fig. 4), from the most intense (at the top of Fig. 4) to the least intense (at the bottom of Fig. 4). The sharp, narrow and intense 1 nm peak of the sherds with a highly birefringent matrix (e.g. samples CE-81 and CE-82) demonstrates a crystalline structure. The CE-77 and CE-79 sherds, containing a low-birefringent matrix mixed with isotropic material, show a slightly diminished 1 nm peak due to the partial destruction of the crystalline structure during firing.

Fig. 4. XRD traces of the Foeni sherds. Fsp = feldspar; Hem = hematite; Ilt-Ms = illite-muscovite; Chl = chlorite; Qz = quartz.
The feldspar peaks are more intense for the sherds with intense illite-muscovite peaks. The wide diffraction peak at 1.4 nm may be assigned to both chlorite and montmorillonite. Weak hematite peaks (0.25 and 0.27 nm) occur in all samples.
Electron microprobe analysis
The BSE images and the energy-dispersive spectra (Figs 5a–d, 6a–c) reveal a porous ceramic body that is chemically and mineralogically inhomogeneous at a small scale. The matrix consists of a very fine-grained mixture of clay mineral and muscovite, as well as quartz, feldspars and heavy minerals. The individual clay mineral and sometimes muscovite lamellae are difficult to separate visually due to a smooth transition caused by sintering (Figs 5a–d, 6a). The microchemistry of the clay mineral and muscovite forming the matrix of the Foeni sherds (Table 3) is comparable with data obtained for the Copper Age Coțofeni pottery found in the same cave (Giurgiu et al., Reference Giurgiu, Ionescu, Hoeck, Tămaș, Roman and Crandell2017). The clay mineral is illite-like and can be distinguished from muscovite (Fig. 5b) by a darker greyish hue and a greater amount of SiO2. Overall, in the clayey part of the matrix including muscovite, SiO2 ranges from ~43 to >58 mass% and Al2O3 from ~18 to ~30 mass%. The K2O content also varies widely, from 1 to almost 8 mass%.

Fig. 5. BSE images of the ceramic body. (a) Inhomogeneous appearance of sample CE-80, with quartz (Qz), muscovite (Ms), epidote (Ep), chlorite (Chl) and ilmenite (Ilm) grains in a highly porous, illite-like matrix. (b) Fragments of quartz, alkali feldspar (Afs), muscovite, apatite (Ap), amphibole (Amp), and a quartzo-feldspathic rock (Qf) in sample CE-80. (c) Quartz, alkali feldspar and plagioclase crystalloclasts (Pl) in sample CE-83. (d) Fragment of chlorite schist in sample CE-83. The black areas in all images are pores.

Fig. 6. (a) BSE image of a clay pellet (Cp) rimmed by a contraction void in sample CE-83. (b) Energy-dispersive spectra of the clay mineral forming the pellet. (c) Energy-dispersive spectra of a plagioclase grain. The white dots in (a) marked with (b) and (c) show the locations where the energy-dispersive spectra were collected.
Table 3. Selected EMPAs (mass%) and calculated structural formulae for the illite-like matrix in the Foeni ceramics.

FeTOT as FeO.
Calculations on a 22 O basis, according to Deer et al. (Reference Deer, Howie and Zussman1992).
bdl = below detection limit; Sum T = total cations in tetrahedral sites.
In the K2O–Na2O–CaO ternary diagram (Fig. 7a), our matrix data plot is different from that of illite (Deer et al., Reference Deer, Howie and Zussman1992), towards increasing CaO. The high Al2O3 content suggests a slightly altered muscovite. On a positive correlation background between Al2O3 and K2O, two groups are separated (Fig. 7b), one related to an illite-dominated matrix (A) and another reflecting a muscovite-dominated matrix (B).

Fig. 7. Plot of the EMPA data obtained for the matrix in the (a) K2O–Na2O–CaO, (b) Al2O vs. K2O and (c) CaO vs. P2O5 discrimination diagrams. Black star = illite; black dots = Foeni samples. The dashed lines demark the groups.
The FeOTOT content in the matrix is also highly variable, between 2 and >9 mass%, whereas the amount of CaO and P2O5 is <3 mass%. The diagram in Fig. 7c shows two groups of data. The first group includes a matrix with high calcium and increasing phosphorous contents and reveals a slightly positive correlation between these elements. The second group has low phosphorous and low calcium contents and shows no correlation.
The quartz clasts in the ceramic body are almost pure, with 99.14 mass% SiO2. The alkali feldspar (Table 4, Figs 5b,c, 8) is predominantly orthoclase, with <10% albite. The albite content in the plagioclase (Fig. 5c) ranges between Ab92 (albite) and Ab67.9 (andesine), with a prevalence of oligoclase. The plagioclase does not display compositional zoning.

Fig. 8. Chemistry of feldspars in the Foeni sherds: plot of EMPA data in the feldspar classification diagram.
Table 4. Selected EMPAs (mass%) and calculated structural formulae for feldspars in the Foeni ceramics.

FeTOT as FeO.
Calculations on an 8 O basis, according to Deer et al. (Reference Deer, Howie and Zussman1992).
Afs = alkali feldspar; bdl = below detection limit; Pl = plagioclase.
Chlorite (Fig. 5a,b,d), muscovite (Table 5) and heavy minerals such as clinozoisite, epidote, ilmenite (Fig. 5a), apatite and amphibole (Fig. 5b), were determined by EMPA. Chlorite schist fragments, iron pellets/pedogenic concretions and clay pellets (Fig. 6a) were also measured microchemically.
Table 5. Selected EMPAs (mass%) for muscovite in the Foeni ceramics.

FeTOT as FeO.
Calculated structural formulae for muscovite on a 22 O basis, according to Deer et al. (Reference Deer, Howie and Zussman1992).
bdl = below detection limit; Sum T = total cations in tetrahedral sites.
The iron pellets/pedogenic concretions contain up to 20 mass% Fe2O3, ~13 mass% Al2O3, ~4.5 mass% P2O5, ~4.2 mass% CaO, ~35 mass% SiO2 and ~10 mass% TiO2. With FeOTOT up to 5 mass% and MgO up to 3.5 mass%, muscovite shows a phengitic character.
The X-ray compositional mapping (Fig. 9) shows the distribution of Si, Al, K, Ca and Fe in the ceramic sherds. The density of the tiny dots reflects the relative element concentrations in the mineral phases (Ionescu & Hoeck, Reference Ionescu, Hoeck and Hunt2017). Si is related to quartz and various silicates (illite-mineral, feldspars and muscovite). Al is the main component of aluminosilicates (illite-mineral, feldspars and muscovite), whereas K reflects minerals such as alkali feldspars and clay minerals (matrix). Calcium and iron are very finely dispersed within the matrix consisting of clay minerals and are not linked to specific phases.

Fig. 9. X-ray compositional maps of sample CE-83. (a) BSE image showing grains of quartz (dark grey), plagioclase (grey) and alkali feldspar (light grey) in a matrix consisting of an illite-like mineral and muscovite (speckled grey). (b) Distribution of Si in quartz and silicates. (c) Distribution of Al in aluminosilicates. (d) Distribution of K in the illitic matrix, muscovite and alkali feldspars. (e) Homogeneous distribution of Ca in the matrix. (f) Homogeneous distribution of Fe in the matrix. The black areas are pores. The brightness of dots for the K, Ca and Fe distributions is enhanced in order to give a clearer view. The same scale is used for all images.
Discussion
Inferring raw materials
The information on possible raw clayey materials used to produce Foeni pottery was derived from XRPD and EMPA data, whereas OM provides hints as to the temper that was used. The mineral nature and microchemistry of the clay minerals and heavy minerals are especially important, as they reflect the geological background of the area.
The XRPD traces show that the ceramic mass consists mainly of an illite-like mineral, muscovite and quartz in all Foeni sherds (Fig. 4). The EMPA microchemistry of the matrix (Table 3, Fig. 7a,b) also shows an illite-like material, but it is slightly depleted in K2O and slightly enriched in CaO compared to illite (Deer et al., Reference Deer, Howie and Zussman1992). A similar chemical composition with a tendency to incorporate calcium into the illite-like structure was described in the Copper Age ceramic matrix by Ionescu & Hoeck (Reference Ionescu and Hoeck2011). The CaO is probably due to a small amount of montmorillonite in the raw clay (see also Gál et al., Reference Gál, Ionescu, Bajusz, Codrea, Hoeck, Barbu-Tudoran, Simon, Mureșan-Pop and Csók2018). However, with <3 mass% CaO, the matrix points to a poorly carbonatic clay.
Parts of the Foeni sherds show reddish hues and contain hematite (Fig. 4). Generally, a reddish colour for ceramics is obtained when clays rich in iron oxides are used for the paste (Molera et al., Reference Molera, Pradell and Vendrell-Saz1998; De Bonis et al., Reference De Bonis, Cultrone, Grifa, Langella, Leone, Mercurio and Morra2017). No spinel lines were identified in the XRD traces of the dark grey sherds, possibly because of the small size and the small amount of spinel grains.
The EMPA data revealed a relatively large amount of P2O5 in the matrix (Table 3, Fig. 7c). The CaO vs. P2O5 diagram (Fig. 7c) displays two groups of data, one with higher calcium and phosphorous contents (A) and another with lower calcium and phosphorous contents (B). The nature of crystalloclasts and pedogenic concretions as well as the positive correlation (~0.8) between P2O5 and CaO for group A indicate apatite as the source of P for part of the matrix (see also Ionescu et al., Reference Ionescu, Hoeck and Ghergari2011; Ionescu & Hoeck, Reference Ionescu, Hoeck and Hunt2017). Alternatively, phosphorous may be due to burial (Freestone et al., Reference Freestone, Meeks and Middleton1985, Reference Freestone, Middleton and Meeks1994; Maritan & Mazzoli, Reference Maritan and Mazzoli2004; Maritan et al., Reference Maritan, Angelini, Artioli, Mazzoli and Saracino2009) in the case of the group B data.
Miocene illitic clays containing small amounts of montmorillonite cropping out towards the northeast of the cave were used for a younger pottery, namely Coțofeni (also from the Copper Age), found in the same cave (Giurgiu et al., Reference Giurgiu, Ionescu, Hoeck, Tămaș, Roman and Crandell2017). The use of the same raw material for the Coțofeni and Foeni pottery is supported by the X-ray elemental mapping (Fig. 9) and by the EMPA microchemical data for the clay minerals in the matrix of the Foeni ceramics. The latter shows the presence of a small amount of Ca. The overall composition of the Foeni matrix matches that of the matrix of the Coțofeni sherds (Fig. 10a,b). It is highly plausible that the same raw illitic material, with a minor montmorillonite content, was used by both the Foeni and the Coțofeni people. As long as the raw materials had the characteristics required to provide high-quality ceramics, people would use such known sources.

Fig. 10. Comparison of the EMPA data obtained for the ceramic matrix of the Copper Age Foeni (this study) and Coțofeni sherds (data from Giurgiu et al., Reference Giurgiu, Ionescu, Hoeck, Tămaș, Roman and Crandell2017). (a) K2O vs. Na2O vs. CaO diagram. (b) K2O vs. Al2O3 diagram. Black dots = Foeni sherds, shaded areas = fields of the Coțofeni sample plots.
The hiatal distribution of the grain size, at least for the coarser sherds, demonstrates the use of a small amount of artificial temper, added by the potter to better control plasticity (Maggetti, Reference Maggetti1979). The composition of the clasts, with quartz, feldspars, muscovite, biotite and chlorite, the heavy minerals and the rock fragments (quartzite, micaschist and amphibolitic schist) fit the mineralogical and petrographic nature of the Cerna River catchment area in the Southern Carpathians (Fig. 1). Granodiorites and gneisses are sources of quartz, feldspars and some heavy minerals, such as amphibole, epidote and apatite. The composition of plagioclase in our samples is typical of greenschist-amphibolite metamorphic facies and is common in the area. Garnets, muscovite and biotite also originate from gneisses. Mica schists provide phengitic muscovite and biotite, whereas chlorite schists are the main sources of chlorite. The iron pellets and graphite lamellae are linked to the iron ore and the graphitic schist, respectively, cropping out west of Teliuc (Fig. 1). The lack of crystalline dolomite clasts in the Foeni sherds indicates production far away from areas where such rocks crop out (i.e. in the host rock of the GCC).
The scarcity of chamotte fragments demonstrates that this kind of artificial temper was not commonly used, in contrast to the later Copper Age pottery discovered in the same cave (Giurgiu et al., Reference Giurgiu, Ionescu, Hoeck, Tămaș, Roman and Crandell2017). The presence of the clay pellets is due to an insufficiently homogenized ceramic paste (Medeghini & Nigro, Reference Medeghini and Nigro2017) or to unseasoned clay (Maritan, Reference Maritan2004).
The Foeni potters mixed Fe-rich, poorly carbonatic illitic clay with alluvial sand to model various vessels by hand. The workshops were not emplaced at the cave, which was used only as a temporary shelter, but probably further to the east, somewhere close to the Cerna River, where clays, sands and water were at hand (Fig. 1).
Firing constraints
The homogeneous bodies of four of the sherds suggest constant redox conditions of a firing atmosphere. The four sherds displaying reddish–brown colours (Table 1) and containing larger amounts of hematite (Fig. 4) were fired in an oxidizing atmosphere (Shepard, Reference Shepard1976; Murad & Wagner, Reference Murad and Wagner1996; Molera et al., Reference Molera, Pradell and Vendrell-Saz1998), whereas the dark grey sherd is due to firing in a constant but reducing atmosphere. For the three black-topped samples, the firing conditions were different. Firing experiments carried out in open air or in kilns by Davies (Reference Davies1962), Hendrickx et al. (Reference Hendrickx, Friedman and Loyens2000), Baba & Saito (Reference Baba, Saito, Hendrickx, Friedman, Ciałowicz and Chłodnicki2004), Bințințan (Reference Bințințan2013) and Bințințan & Gligor (Reference Bințințan and Gligor2016) demonstrated that this type of pottery may be obtained by arranging the vessels bottom-up on a floor covered by chaff, sawdust, oak wood or a mix of carbon and ash. The firing temperature should not exceed 950°C (Dufournier, Reference Dufournier and Gratien1986).
The thermal constraints for the pottery are provided by OM, XRPD and EMPA data. The optical characteristics of the matrix reflect the changes in the clay minerals’ crystalline structure upon firing (Maggetti, Reference Maggetti, Olin and Franklin1982). Most of the Foeni sherds show a highly birefringent matrix, consisting of clay minerals and micas sintered together. The crystal structure of the clay minerals and muscovite is only slightly affected by temperature. In the few sherds with a low-birefringent matrix and in between isotropic areas, the crystalline structure collapsed partially and the material became amorphous. Yet the temperature was not high enough to melt the material and obtain glass.
The intensity and width of the diffraction peaks also offer details about the crystalline state of clay minerals and muscovite. The illite-muscovite XRPD peaks are still present in the material fired at 800°C (Mercader et al., Reference Mercader, Garcia-Heras and Gonzalez-Alvarez2000). Illite begins to decompose at 820°C (Heimann, Reference Heimann and Hunt2017). The diminishing of the illite-muscovite diffraction peaks indicates a partial destruction of the crystalline structure and suggests firing probably at ~850°C (Broekmans et al., Reference Broekmans, Adriaens and Pantos2004; Ionescu et al., Reference Ionescu, Ghergari, Horga and Rădulescu2007). At temperatures >900°C, the peaks of clay minerals are absent (DeVito et al., Reference DeVito, Medeghini, Mignardi, Orlandi, Nigro, Spagnoli, Lottici and Bersani2014). The illite-muscovite diffraction peaks for most of the Foeni samples are intense and sharp (Fig. 4), marking a crystalline structure and a temperature at ~800°C. The sherds CE-77 and CE-79 show a diminished 1 nm peak, which is consistent with firing at ~850°C. There are no X-ray traces lacking the illite-muscovite peaks, thus pointing to firing temperatures of <900°C for all samples. The intensity of the feldspar peaks (in particular the 0.32 nm peak) reflects different amounts of feldspar in the raw material rather than feldspar formation upon firing. The lower K2O values recorded in the matrix material from Foeni are due to the dehydroxylation of illite (Guggenheim et al., Reference Guggenheim, Chang and van Gross1987; Rosenberg, Reference Rosenberg2002; Rodriguez-Navarro et al., Reference Rodriguez-Navarro, Cultrone, Sanchez-Navas and Sebastian2003; Gualtieri & Ferrari, Reference Gualtieri and Ferrari2006). The increasing CaO content is attributed to its incorporation upon firing at ~850°C (Ionescu & Hoeck, Reference Ionescu and Hoeck2011).
Consequently, the results are corroborated by the lack of specific firing phases such as spinel or pyroxene, suggesting that the Foeni sherds were fired at a temperature of <850°C (see also Murad & Wagner, Reference Murad and Wagner1996; Ionescu et al., Reference Ionescu, Ghergari, Horga and Rădulescu2007), which is within the normal range recorded in bonfires and surface clamps (Velde & Druc, Reference Velde and Druc1999). The temperature range was high enough to obtain a sintered ceramic body, holding together clay minerals, micas and various aplastic fragments. However, a homogeneous temperature is difficult to acquire (cf. Gosselain, Reference Gosselain1992; Thér, Reference Thér2004, Reference Thér2014) and differences of up to 250°C were measured in experimental clamp-kilns by Thér (Reference Thér2004). Moreover, inside the same pot, the thermal differences may reach several hundreds of degrees centigrade (Magetti et al., Reference Maggetti, Neururer and Ramseyer2011). Considering the relatively narrow temperature interval of 50°C estimated for the Foeni sherds, it is probable that the pottery was fired in similar conditions (i.e. in bonfires). The experimental production of black-topped ceramics (Hendrickx et al., Reference Hendrickx, Friedman and Loyens2000; Baba & Saito, Reference Baba, Saito, Hendrickx, Friedman, Ciałowicz and Chłodnicki2004; Bințințan, Reference Bințințan2013; Bințințan & Gligor, Reference Bințințan and Gligor2016) suggests that the primitive firing structures were temporary (used for one or a few loads) and were reconstructed seasonally.
Conclusions
The compositional and microstructural characteristics of the sherds helped to unveil the type and origin of the raw materials as well as the technological level of the potters. Despite the primitive firing conditions in bonfires or surface clamps and the relatively low temperature attained, the potters produced blacked-topped ceramics, showing care for the aesthetical aspects and a certain control of the atmosphere in the kiln. The same raw materials were probably quarried and used at different times by different people. For example, later in the Copper Age, the Coțofeni people processed essentially the same raw materials as the Foeni people, suggesting a continuity of knowledge and tradition in producing ceramic wares.
Acknowledgements
The study was financed by the Excellence Research Program (Romanian Ministry of Education and Ministry of Research) through the UEFISCDI/CNCS project PN-III-P4-ID-PCE-2016-0229 (awarded to C.I.). Dr Sorin Tincu from the Corvin Castle Museum is gratefully acknowledged for providing the sherds. C.I. also acknowledges the support within the Program of competitive growth of Kazan Federal University, awarded by the Russian Government. Comments by two anonymous reviewers significantly helped to improve the manuscript.


