

1. Introduction
The impact of fuel subsidy and taxation reform on output, inflation, and trade can be evaluated with four types of economic models:
• Input–Output Models (Price and Quantity Models),
• Dynamic Interindustry Models (INFORUM),
• Computable General Equilibrium (CGE) Models, and
• Macro-econometric Models.
In this paper, we will present the traditional price and quantity models of input–output analysis which are a useful complement for the more demanding macroeconomic models. The input–output models allow to give a first assessment of the direct and indirect economic impacts of fuel subsidy and taxation reform at the most disaggregate level of products and industries.
Six scenarios are discussed covering subsidies on products for final uses, subsidies on products for industries, increase of taxes on products, increase of net operating surplus for petroleum refining, introduction of taxes on fossil fuels, and import substitution of refined products. Depending on the measure, fuel subsidy and taxation reform affect all quadrants of an input–output table.
Traditional input–output models constitute a useful complement to Dynamic Interindustry Models and Computable General Equilibrium (CGE) Models as they make maximum use of the refined input–output data base. Before starting the input–output analysis, it is useful to briefly review other approaches and compare their potential with our analysis.
INFORUM (Interindustry Forecasting Project at the University of Maryland) describes a group of models and teams from around the world who work together to build interindustry macroeconomic models for specific countries. Technically, the INFORUM models are dynamic input–output models (INFORUM, 2019), where the interaction between relevant variables like value added, income, and private consumption is modelled by behavioural equations. These equations are based on relevant economic theory. All relevant coefficients are estimated econometrically, based on sufficiently long time series data.
In applied economics, the use of input–output models was largely abandoned in favour of computable general equilibrium (CGE) models. However, some serious questions have been raised about the empirical validity of CGE models.
Taylor and von Arnim argue that the way the World Bank uses CGE modelling is highly problematic, making implausible assumptions about trade elasticities, the exchange rate, and macro causality (Taylor and von Arnim, Reference Taylor and von Arnim2006). These are challenges which need to be resolved. The weak part of the model is the parameter setting. The parameters are often set by experts and not estimated based on long time series of empirical data. SAM adjustments, data changing, and parameter settings are rarely mentioned in publications.
In an interesting paper Mitra-Kahn is engaged in debunking the myths of computable general equilibrium models (Mitra-Kahn, Reference Mitra-Kahn2008). Computable general equilibrium (CGE) models are not based on general equilibrium theory in the Arrow, Debreu and Walras tradition. A CGE model is always based on a Social Accounting Matrix (SAM) which represents the national accounts in matrix form. In so far, it is more appropriate to call this model type a Computable National Accounts model. In other words, CGE models are macro balancing models and not general equilibrium models.
We should not forget that the national accounts, including the Social Accounting Matrix (SAM), are the result of a balancing process in which the institutional sector accounts and the supply and use tables are balanced during the compilation process (United Nations, 2018:305–350). In this balancing process discrepancies between supply and demand are eliminated. It would be interesting to know how large these discrepancies actually are. In the Balance of Payments (BOP), the statistical discrepancy of all transactions between entities of one country and the rest of the world is shown. This is a more courageous approach.
Input–output data are also used to study regional integration of the European Union (Beutel, Reference Beutel, Murray and Lenzen2013) and economic diversification and sustainable development of nations (Beutel, Reference Beutel2019). The author was a member of the international consortium which compiled the World Input–Output Database (WIOD). The initial project was funded by the European Commission (WIOD, 2019).
In 2012, the European Consortium for Modelling Air Pollution and Climate Change developed the GEM-E3 Macroeconomic model for the European Union (GEM-E3 Model, 2018). The GEM-E3 is a recursive dynamic computable general equilibrium model that covers the interactions between the economy, the energy system, and the environment.
At present, the European Commission initiated the FIGARO (Full international and global accounts for research in input–output analysis) project. The FIGARO project (Eurostat, 2019) compiles EU-inter country supply, use, and input–output tables. The FIGARO tables are part of a collaborative project between Eurostat and the European Commission's Joint Research Centre. The FIGARO tables are a tool for analysing the socio-economic and environmental effects of globalization in the European Union (EU) – through studies on competitiveness, growth, productivity, employment, environmental footprint, and international trade (e.g. global value chains).
Cambridge Econometrics developed the macroeconomic Model E3ME (Cambridge Econometrics, 2019), which is different to the CGE Model. It is a global macro-econometric model designed to address the major economic and economy–environment policy challenges we are facing today. Its econometric specification addresses concerns about conventional macroeconomic models and is not limited by many of the restrictive assumptions common to Computable General Equilibrium (CGE) Models.
As a complement to CGE models, we propose to make maximum use of exploring input–output data for analysing the immediate impacts of fuel subsidy and taxation reform.
For decades, exports and imports have been growing more rapidly in most countries than domestic production. This is a strong indication that the exchange of intermediates in production has become more and more important. Therefore, an input–output approach is more appropriate for analysing fuel subsidies reform than the traditional approach with macroeconomic data. In May 2018, the United Nations Statistics Division published the final draft of the Handbook on Supply, Use and Input–Output Tables with Extensions and Applications (United Nations, 2018), hereafter referred to as the UN Handbook. The new UN Handbook explains in detail how supply, use and input–output tables can be compiled from the main statistical sources.
Statistics Austria developed one of the finest supply and use system in the world for the national accounts. Moreover, Statistics Austria (2020) published all supply, use, andinput–output tables and all valuation matrices. This was the main reason why the editorial board of the UN Handbook decided to present the supply, use, and input–output tables for Austria for 2011 as reference data in the various chapters.
As in the new UN Handbook, I will also use the input–output database of Austria for 2011 to analyse the main aspects fuel subsidy reform. Austria is a country with low energy subsidies and high taxes on gasoline and diesel. Notwithstanding these low energy subsidies, Austria was selected as the reference country as all the detailed input–output data required for a comprehensive analysis are published. Separate valuation matrices for taxes on products and subsidies on products allow a profound analysis of subsidies reform. In addition, energy taxes and subsidies granted to industries are reported in supply, use, and input–output tables as components of gross value added. Our approach is to analyse the economic impact of fuel tax and subsidy reform with the standard input–output models.
More information about input–output modelling for fuel subsidy analysis can be found in Hubacek and Ogarenko (Reference Hubacek and Ogaronko2013), Grainger, Zhang, and Schreiber (Reference Grainger, Zhang and Schreiber2015) and in Harun (Harun, Reference Harun2018). Hubacek and Orgarenko applied the price model of input–output analysis to estimate price changes resulting from subsidy elimination for end-users of electricity and gas in the Ukraine. Graininger, Zhang and Schreiber applied the Leontief price model and a computable general equilibrium model to evaluate the short-term and long-term impacts of energy subsidies in transition countries such as Belarus for the World Bank. Harun applied the Leontief price model to analyse the impact of a subsidy removal policy on production cost in Malaysia. These examples indicate that the Leontief Price Model is still used in applied economics for a first approximation of fuel subsidy reforms on prices and inflation.
2. Supply and Use Tables
2.1 What Are Supply and Use Tables
Supply, use, and input–output tables have received much attention in recent years. They offer new opportunities to fully understand the ‘global value chain’ and their impact on production, consumption, employment, and environment. Supply and use tables are an integral part of the national accounts (Beutel, Reference Beutel and ten Raa2017). While they mainly serve statistical purposes, the system of supply and use tables ensures the consistency of data obtained from different kinds of sources, such as industrial surveys, household expenditure inquiries, investment surveys, foreign trade statistics etc.
The supply table shows the supply of goods and services for each product type found in an economy for a given period further distinguishing between the output of domestic industries and imports by type of product. Domestic output of products and imports of products are aggregated to total supply of products at basic prices. The supply at basic prices is then transformed to the supply at purchaser prices, through the addition of valuation adjustments represented by valuation matrices containing trade margins, transport margins, taxes on products, and subsidies on products.
The use table at purchaser prices shows the use of goods and services by product and by type of use for intermediate consumption by industry, final consumption expenditure, gross capital formation, and exports. The use table also shows the components of gross value added by industry for compensation of employees, other taxes less subsidies on production, consumption of fixed capital, and net operating surplus and net mixed income. The term ‘mixed income’ is used when operating surplus cannot be distinguished from wage income, for example, in the case of sole proprietorships (e.g. farmers).
Symmetric input–output tables are square tables with the same number of products and industries in columns and rows. The Statistical Offices of the European Union publish product-by-product input–output tables or product-by-product input–output tables which were derived from the supply and use tables. Input–output tables are also a part of the system, serving as a well-established tool for various analytical purposes related to production. While supply and use tables are data-oriented in nature, the symmetric input–output tables are always constructed using certain analytical assumptions associated with the transformation of the existing supply and use tables into an input–output format.
The System of National Accounts 2008 recommends that the statistical supply and use tables should serve as the foundation from which the analytical input–output tables are constructed. A comprehensive system of supply, use, and input–output tables comprises the following tables:
• Supply and use tables at purchasers’ prices
1. Supply table at basic prices, including a transformation into purchasers' prices
2. Use table at purchasers' prices
• Trade and transport margins
3. Wholesale trade margins table
4. Retail trade margins table
5. Inland transport margins table
6. Water transport margins table
7. Air transport margins table
• Taxes less subsidies on products
8. Non-deductible VAT
9. Taxes on products excluding VAT
10. Subsidies on products
• Supply and use tables at basic prices
11. Supply table at basic prices
12. Use table at basic prices
13. Use table of domestic production at basic prices
14. Use table of imports at basic prices
• Symmetric input–output tables at basic prices
15. Input–output tables at basic prices
The supply table provides a detailed picture of the supply of products from domestic production and imports. The use table shows how products are used for intermediate consumption in industries and final use for consumption, gross capital formation, and exports. The use table also shows how the components of value added (compensation of employees, other net taxes on production, capital consumption, and net operating surplus) are generated by industries in the domestic economy. Thus, supply and use tables together provide detailed information on production, the interdependencies in production, the use of products, and the generation of income in production.
Supply and use tables are closer to the original statistical sources than input–output tables. They contain the same information as input–output tables but provide the detail on primary and secondary activities of industries. The supply table includes the information on taxes and subsidies on products (e.g. fuels) and the use table the information on other taxes and other subsidies on production of industries (e.g. fuel industries).
2.2 Availability of Supply and Use Tables
Supply and use tables are an integral part of the national accounts, but they are not always publicly available, thereby reducing the ability to research the trade impacts of fossil fuel subsidies. A full implementation of the System of National Accounts 2008 (United Nations, 2009) requires that national Statistical Offices compile annual supply and use tables. An example of the published size and internal working level of supply, use and input–output tables is given for 31 countries in the in the UN Handbook (United Nations, 2018: 91). Eurostat, the Statistical Office of the European Union, published on the official website the supply, use, and input–output tables and the valuations matrices for trade and transport margins and taxes less subsidies for 24 member countries of the European Union. Supply, use and input–output tables including the valuation matrices for trade and transport margins and taxes less subsidies of products are available for 2005–2015 for all member countries of the European Union (Eurostat, 2018).
The National Statistical Offices of most nations compile supply and use tables with many more products than industries. For the specific purposes of this paper, I aggregated the supply, use, and input–output tables for Austria that included 74 products and 74 industries, to supply and use tables with 11 products and 9 industries. A special feature of all tables is that the energy sectors are shown in separate rows and columns for coal, oil, gas and mining, coke and refined products and electricity.
2.3 Detailed Content of Supply and Use Tables
Supply and use tables are reported at purchasers’ prices. The first part of the supply table shows the production matrix in which, column wise, primary and secondary activities of industries are shown. The column vectors for trade margins, transport margins, VAT, other taxes on products and subsidies were derived from the valuation matrices. They allow a transformation of supply at basic prices to supply at purchasers’ prices.
In the supply and use system, the valuation concepts are important elements. The System of National Accounts 2008 (United Nations, 2009) distinguishes two main valuation concepts of the flows of goods and services: basic prices and purchasers’ prices.
The difference between these two basic valuation concepts relates to trade and transport margins on the one hand, and to taxes less subsidies on products on the other. Trade and transport margins are the difference between purchasers’ and producers’ prices, and taxes less subsidies on products are the difference between producers’ prices and basic prices.
The relationship between the different types of prices is the following:
Purchasers’ prices (excluding any deductible VAT)
– Non-deductible VAT
– Trade and transport margins
= Producers’ prices
– Taxes on products (excl. VAT)
+ Subsidies on products
= Basic prices
In Austria, taxes on products excluding VAT mainly comprise taxes on gasoline and diesel, tobacco and alcoholic beverages. Subsidies on products are quite limited in Austria and mainly comprise subsidies for agricultural products, subsidies for manufactured products, and subsidies for transport services for trains. Please note that large rectangular supply and use tables have the benefit that specific taxes and subsidies on products can be allocated to more homogenous product groups.
The valuation matrices (Beutel, Reference Beutel, Rueda-Cantuche, Amores and Remond-Tiedrez2018) show separate information for trade margins, transport margins, value added tax, taxes on products excluding VAT, and subsidies on products.
If we deduct the valuation matrices from the supply and use tables at purchasers’ prices, we obtain the supply and use tables at basic prices. Products are now valued at basic prices. Therefore, a separate row for taxes less subsidies on products is added to the table to arrive for products at purchasers' price.
The transformation of supply and use tables to input–output tables requires splitting the use table at basic prices into a use table for domestic output and a use table for imports and aggregation to symmetric supply and use tables.
3. Input–Output Tables
The supply and use tables were transformed to symmetric input–output tables because the latter are commonly used as a data base of input–output models and other macroeconomic models. In this section, we will present the main input–output models that will then be used to assess the trade impacts of fuel subsidies and taxation reform.
The database for the transformation of supply and use tables to input–output tables includes the following tables: supply tables at basic prices, use tables at basic prices, use tables for domestic output at basic prices, and use tables for imports at basic prices. Four basic models (A–D) can be used for the transformation of supply and use tables to symmetric input–output tables. For this paper, we decided to use Model D for the transformation of supply and use tables to industry-by-industry input–output tables. The approach is explained in the Handbook (United Nations, 2018: 351–408).
In table 1 the input–output table is shown which we will use for our analysis. Note that the matrices for domestic products and imported products were integrated in this table. Domestic products are shown in rows 1–10 while imported products follow in rows 11–20.
Table 1. Input–output table at basic prices
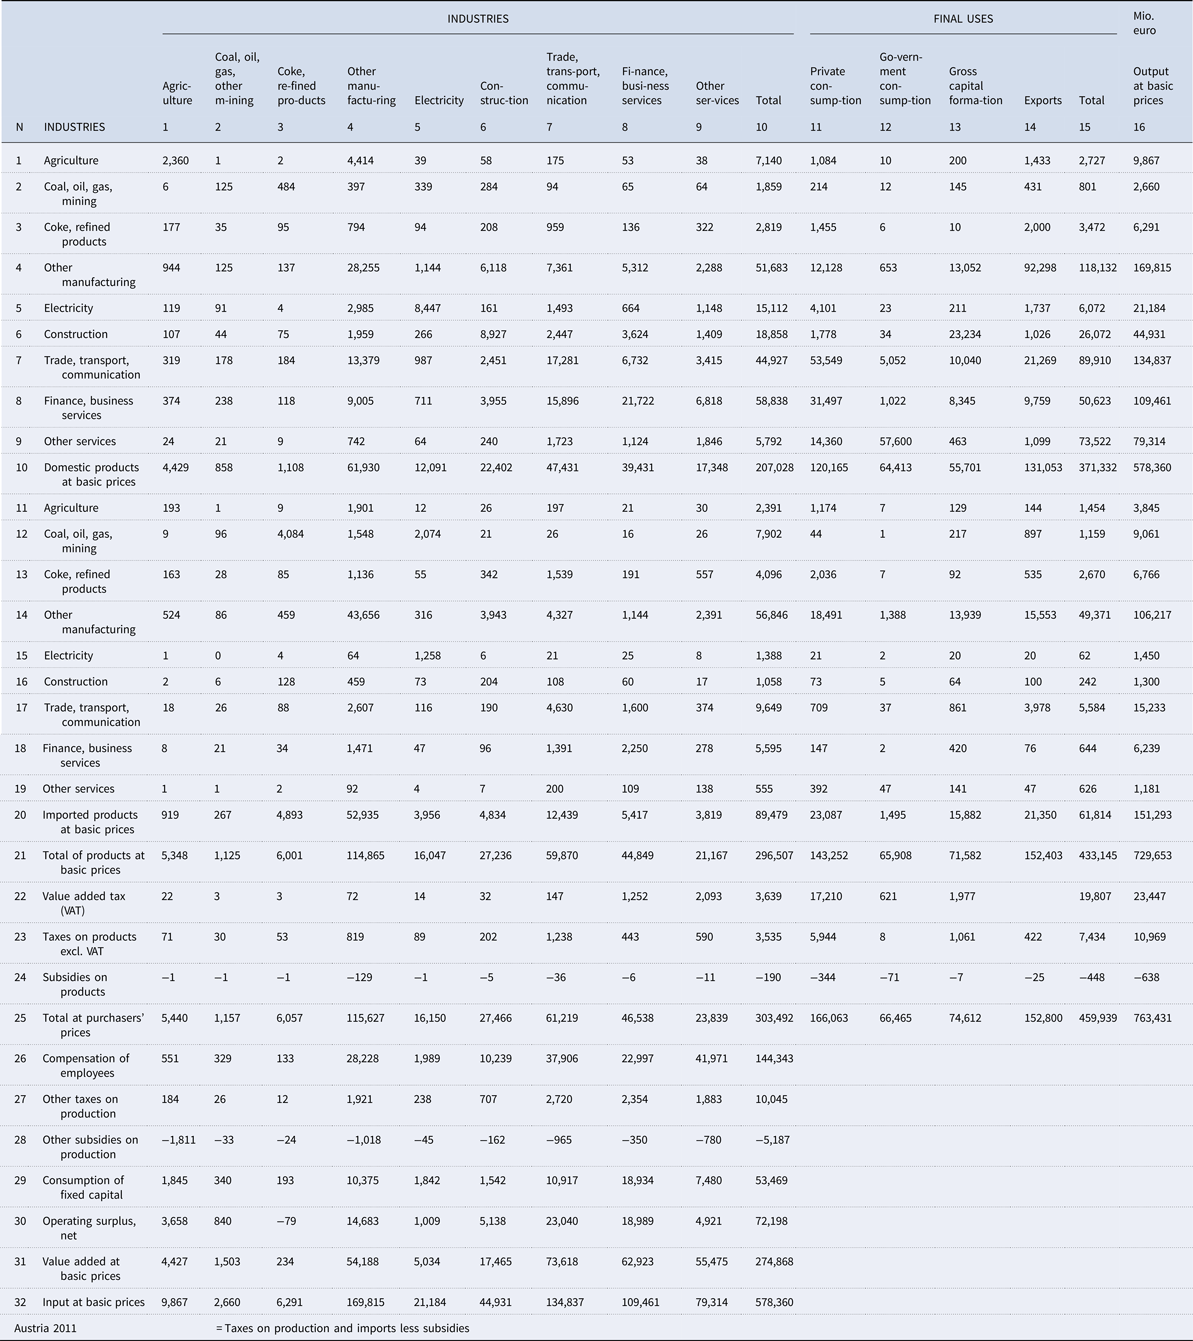
The use of domestic and imported products is shown with explicit reference to energy sectors and trade services. Coal, oil gas, and other mining sectors covering all fossil fuels are shown as an industry (column 2) and the use of its domestic products (row 3) and imported products (row 12) in the import matrix below. We also display industries that are producing secondary energy, shown as separate industries – coke and refined products (column 3) and electricity (column 5).
Valuable information is given on taxes and subsidies on products and production which I marked in blue. In rows 22–24 VAT, taxes on products excluding VAT and subsidies on products are reported. As part of value added, other taxes and subsidies on production follow in rows 27–28 which must be paid or are received by industries.
In the following sections, input–output data and the associated model will be used to analyse the impact of fuel subsidy reform with the traditional quantity model and price models of input–output analysis.
4. Input–Output Analysis
Input–output analysis was developed by Wassily Leontief (Leontief, Reference Leontief1966). In 1973, he received the 5th Nobel Prize in Economic Sciences for the development of the input–output model. The basics of input–output analysis are explained in Miller and Blair (Reference Miller and Blair2009) and ten Raa (Reference Ten Raa2017). In addition, the UN Handbook (United Nations, 2018: 577–613) presents basic applications of input–output analysis.
Input–output analysis starts with the calculation of input coefficients. These coefficients are calculated by dividing, column-wise, each entry of the input–output table by the corresponding column total. The input coefficients of production activities can be interpreted as the corresponding cost shares for products and primary inputs in total output. One could also say that each column of an input–output table for industries represents an analogous ‘Cooking Recipe’ for the creation of products in an industry.
As the input coefficients of industries cover all inputs, including net operating surplus, they add up to unity. The same holds true for the input coefficients of the categories of final uses. In this case, the input coefficients represent the commodity composition of each component of final demand.
The basic input–output models that will be used in this sector are presented in the UN Handbook (United Nations, 2018, pp. 529–537).
4.1 The Quantity Model of Input–Output Analysis
The quantity model of input–output analysis is a linear model that is based in Leontief production functions and a given vector of final uses. The objective is to calculate the unknown gross outputs for the individual industries (endogenous variables) for the given final uses (exogenous variables). The Leontief inverse is multiplied with the vector of final uses to estimate the unknown output levels of industries. This model is often used to study the impact of exogenous changes of final demand on the economy. A prominent application of the quantity model of input–output analysis is the evaluation of a Keynesian public expenditure program to fight a recession or unemployment.
The quantity model reproduces the output for all industries of the given input–output table. The column sums of the Leontief inverse can be interpreted as output multipliers that reflect the cumulative revenues of industries that are induced by one additional unit of final demand of a certain product.
A numerical example of the Leontief Quantity Model is given in the appendix.
4.2 The Price Model of Input–Output Analysis
Prices are determined in an input–output system from a set of equations that states that the price that each sector of the economy receives per unit of output must equal the total costs incurred during its production. The outlays comprise not only payments for inputs purchased from domestic industries, they also cover the expenses for imported products and the components of gross value added representing all payments made for example for capital, labour, land, and residual profits. In the input–output table, the costs of production are reported for each industry in the corresponding column of the matrix.
The objective of the price model is to calculate the unknown product prices (price indices) for exogenously given primary input coefficients that are weighted with the factor prices. For the monetary input–output table for Austria, no information on quantities and prices is available. Therefore, the input coefficients for primary inputs must be weighted with a unit factor price of 1.0. The primary inputs of an industry include all imported products, taxes on products (VAT and other taxes on products), subsidies on products, and the component of gross value added (compensation of employees, other net taxes on production, consumption of fixed capital, and net operating surplus).
The price model may be used to study the impact of changes in primary inputs (input coefficients, factor prices) on product prices. When the price model is applied, it is assumed that in competitive markets, higher prices for primary inputs will result in higher product prices. The approach can simulate the impact of cost-driven inflation. For example, the price model can be used to study the impact of an increase of the tax on gasoline on other product prices.
Given this overview, the next section will address the way in which an input–output system can be used to analyse fuel subsidy reform.
A numerical example of the Leontief price model is given in the appendix.
5. Fuel Subsidy and Taxation Reform
Types of fossil fuel taxes and subsidies are:
1. Price-gap of energy prices (where the price gap is the difference between the end-user price and international reference price).
2. Financial transfers (grants to producers and consumers, preferential loans to producers, subsidies, e.g. for agriculture, health, water, electricity, coal, steel, ship building and railways).
3. Preferential tax treatments (VAT, import duties, depreciation rates, royalties)
4. Trade restrictions (quota, embargo).
5. Regulations (price controls, market access, access to resources).
6. External costs (neglecting environmental damage and security risks).
7. Depletion allowances (compensation for depletion of natural resources and environmental damage).
A clear distinction between primary and secondary energy is quite important for fuel subsidy analysis. Input–output tables and specifically extended input–output tables allow to make a clear distinction between primary and secondary energy. Primary fuels are coal, lignite, crude oil, and natural gas. These primary fuels can be transformed into secondary energy in the form of briquettes, coke, produced gas, petroleum products, and electricity. In the World Energy Outlook, the International Energy Agency (IEA, 2019) seems to ignore the distinction between primary and secondary energy by presenting fossil-fuel consumption subsidies by country for oil, electricity, natural gas, and coal.
5.1 Prominent Examples for Direct and Indirect Subsidies in Selected Countries
For decades, the prices for gasoline, water, and electricity in Saudi Arabia were well below the domestic production cost. In recent times, these indirect subsidies were reduced by raising the prices both for gasoline, electricity, and water. In December 2015, the government increased the prices for gasoline, electricity, and water by more than 50%. Saudi Arabia followed similar measures of the United Arab Emirates and other Gulf states.
In the USA, the major federal subsidies are oil subsidies, farm subsidies, subsidies for the strategic petroleum reserve, ethanol subsidies, export subsidies for farms, housing subsidies, and Obama care subsidies. Most farm subsidies went to large farmers of grains, such as corn, wheat, and rice. Between 1978 and 2010, the corn industry received 20 billion dollars in federal subsidies to divert the production into ethanol. The corn subsidy ended in 2012. The oil industry subsidies have a long history in the United States. Some estimates indicate that subsidies for the oil industry can reach between 10 and 40 billion dollars per year. Housing subsidies promote home ownership and support of the construction industry with a total of about 15 billion dollars per year (in the form of tax deductions for mortgage interest payments). Obama care subsidies are mainly designed to support middle- and low-income families through subsidizing medical insurance costs.
For over 65 years, the Egyptian government has subsidized food for the Egyptian population. Egypt's food subsidy system is part of the government's long-term policy of promoting social equity and political stability. An extensive system of food subsidies helps to provide bread and other basic staples to the population at low prices. In recent times, the cost of the system has considerably declined. The contemporary system includes the two components of baladi bread and ration cards, but continues to face challenges, including shortages of some basic commodities in recent times.
5.2 Taxes and Subsidies on Products and Production of Reference Country Austria
Taxes on products in Austria comprise the value added tax (VAT), taxes, and duties on imports and exports and other taxes on products, such as product taxes on gasoline and diesel, tobacco. and alcohol. Other taxes on production must be paid by industries. They comprise taxes other than those incurred directly as a result of engaging in production; consisting mainly of current taxes on the labour or capital employed in the enterprise, such as payroll taxes, or current taxes on vehicles or buildings.
Subsidies on products comprise import and export subsidies and other subsidies on products (e.g. subsidies on products used domestically and subsidies to public corporations to compensate for persistent losses that they incur because of charging prices below average costs of production). Other subsidies on production consist of subsidies, except subsidies on products, that resident enterprises may receive because of engaging in production (e.g. subsidies on payroll or workforce or subsidies to reduce pollution).
The distribution of taxes on production and subsidies for Austria is shown in table 2 for 2011. 5.825 billion euro were spent on subsidies of all kinds (1.9% of GDP). Included are subsidies on products of 638 million euro (0.2% of GDP) and other subsidies on production of 5.187 billion euro (1.9% of GDP).
Table 2. Taxes on production an imports less subsidies
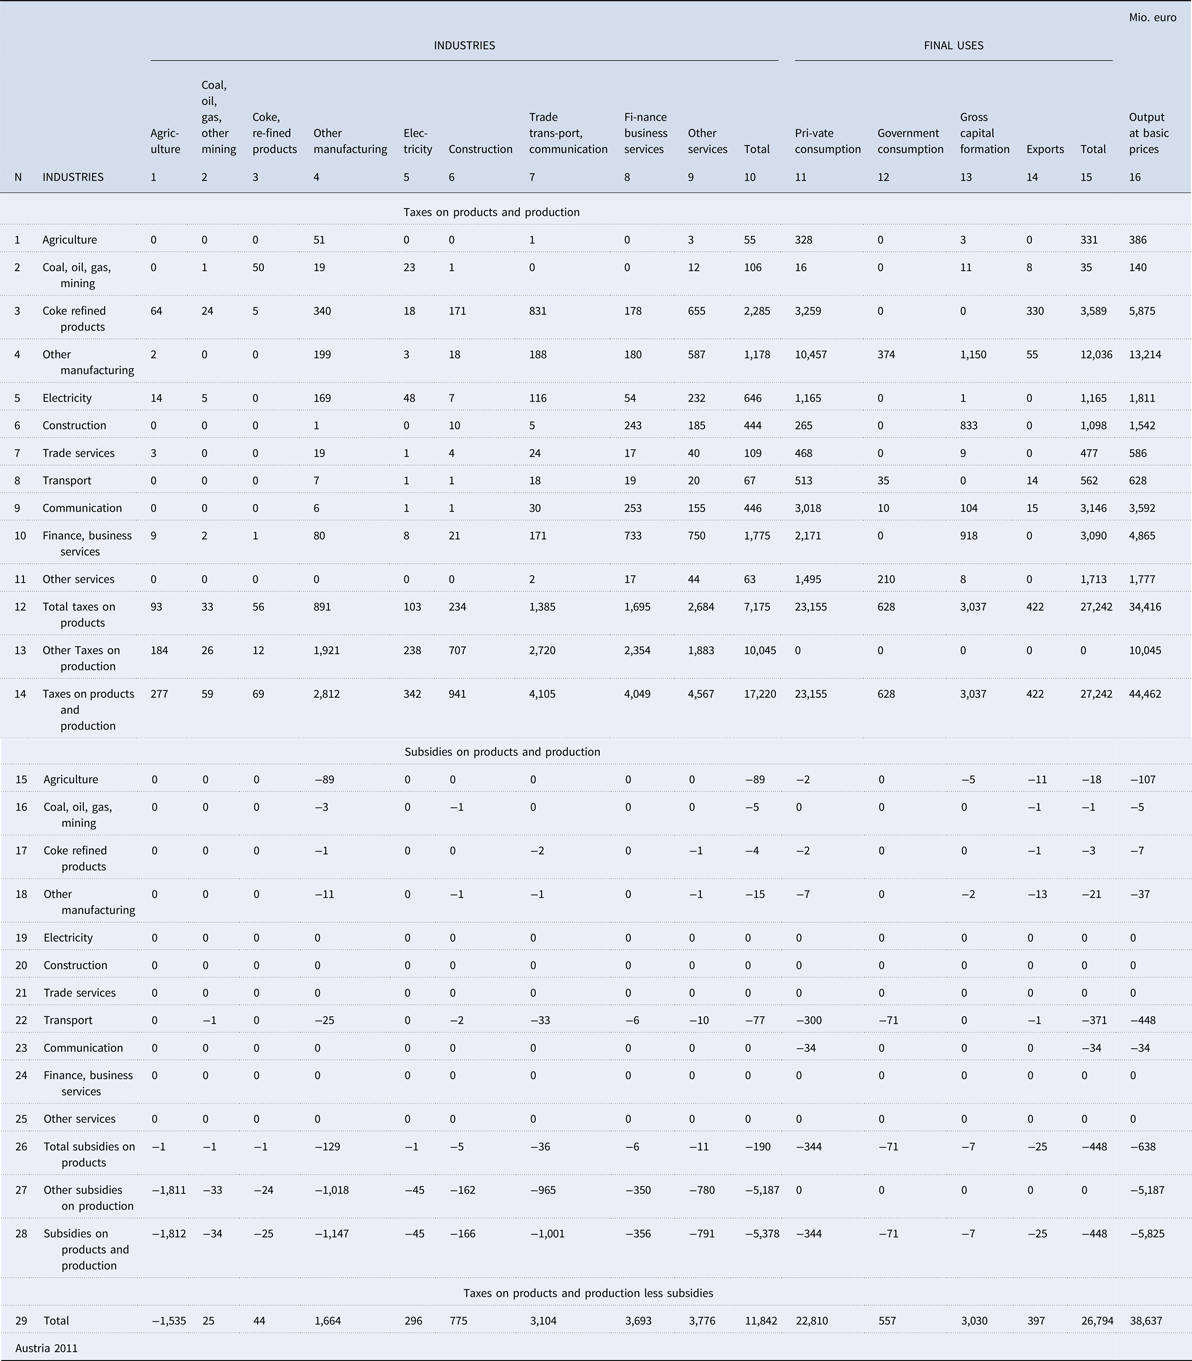
The direct subsidies include significant amounts for agriculture and land transportation. As in other member countries of the European Union, subsidies for agriculture are mainly funded by the European Union. Subsidies for land transportation are financed by the government to support the national railway, reducing the costs for commuters on their journey to work. If we include direct and indirect subsidies including capital transfers, Austria's subsidies are among the highest in the EU (International Monetary Fund, 2017, 12).
6. Input–Output Analysis of Fuel Subsidy and Taxation Reform
All types of fuel subsidies noted in the previous section can be analysed using input–output analysis. However, it should be noted that only the short-term impact on output of industries, product prices, and gross domestic product can be evaluated with input–output models. A more profound analysis covering the long-term implications of fuel subsidy reform on growth and sustainable development should be conducted with computable general equilibrium (CGE) models or macroeconomic models that are based on input–output data (supply and use tables, input–output tables, social accounting matrix). The CGE analysis has an additional benefit in that it can be used to estimate the distributional impacts of any subsidy program.
In this section, we conduct the input–output analysis for aggregate input–output tables for Austria for 2011 with nine products and nine industries to demonstrate how valuable input–output analysis is for the analysis of fuel subsidy reform. A more detailed analysis could be conducted by using the larger supply, use and input–output tables for Austria for 2011 with 74 products and 74 industries; this approach will generate more disaggregate results with better precision. Input–output analysis is capable for analysing the impact of all kind of subsidies on the economy provided that an input–output database is available that is fully integrated into the national accounts. The results for the small input–output tables with nine products and nine industries are first estimates for direct subsidies on products indicating the magnitude of the effects leaving more detailed analyses to be conducted with the more disaggregated tables covering 74 products and industries.
Using the following six scenarios, we would like to demonstrate the potential of input–output analysis for analysing different aspects of fuel subsidy reform, for direct subsidies on products. The focus of our analysis will be on the impacts on energy and trade.
6.1 Six Scenarios for Fuel Subsidy and Taxation Reform
In this section, we evaluate the impact of fuel subsidies reform on the economy for the following six scenarios:
1. Withdrawal of all subsidies on products
2. Withdrawal of all subsidies on products and industries
3. Increase in taxes on products
4. Increase in net operating surplus of petroleum refining
5. Introduction of taxes on fossil fuels
6. Enforcement of import substitution for refined products
Scenario 1: Withdrawal of all Subsidies on Products
The impact of subsidy reform is evaluated in two different scenarios. In the first scenario, we assume that all subsidies on products are withdrawn. In Austria, subsidies on products are rather limited. They mainly include subsidies for products of ‘Other manufacturing’ (129 million euro) and products of ‘rrade, transport and communication (36 million euro). This scenario is useful for a fuel subsidy reform in oil producing countries that grant substantial subsidies for domestic final consumption of energy. We apply the price model of input–output analysis to evaluate the impact on prices.
In 2011, the Austrian government provided subsidies of 638 million euro on products. Output of all industries is expected to inflate by 0.05% through higher prices if all subsidies on products are eliminated. Quantities will not change. As a substantial amount of subsidies on products is allocated to private consumption (344 milliom euro), prices of private consumption will increase by 0.2%.
The price increase in GDP is expected at 0.2%. The results are summarized in Table 3, column 1.
Table 3. Summary of results for fuel subsidy and taxation reform

Scenario 2: Withdrawal of all Subsidies on Products and Industries
In the next scenario, we assume that all subsidies on products and other subsidies for production are abolished. Total subsidies for coal, oil, and gas (34 million euro), coke and refined products (25 million euro), and electricity (45 million euro) are small. This scenario is useful for the fuel subsidy reform in countries that grant substantial subsidies for the energy consumption of industries. In this case, we again apply the price model of input–output analysis. The results are summarized in table 3, column 2.
For agriculture, subsidies of 1.812 billion euro are granted; for manufacturing, 1.147 billion euro; and for trade, transport, and communication, 1.001 billion euro. If all subsidies for industries are abolished, product prices are expected to increase by 1.6%. Due to heavy subsidies, agriculture is affected more than other industries by the complete elimination of subsidies.
Similar results must be expected for foreign trade. In this scenario, we assume that subsidies are only granted for domestic products. The prices of exported products would increase by 1.6% because of the intermediate price increases. The import prices would not change. The price increase of GDP with 1.9% is now significant. In this scenario, we assume that the technology does not allow a change in quantities.
A similar analysis could be conducted for countries with high subsidies for fuels. In this case, we would simulate the impact of a removal of fuel subsidies on output, GDP, and foreign trade.
Scenario 3: Increase in Taxes on Products, Excluding VAT
Taxes on products comprise import duties, taxes on gasoline, tobacco and alcoholic beverages, and some other smaller taxes on products. In this scenario, we assume that all taxes on products except for VAT increase by 100%. This scenario is useful to evaluate the impact of fuel subsidy reform in countries that plan to increase the tax on gasoline and diesel or raise the price for electricity. It can also be used to study the introduction of specific import duties for primary and secondary energy, such as coal, oil, natural gas, refined products, and electricity.
Again, we apply the price model of input–output analysis to evaluate the impact on prices. In this model, we assume perfect competition for all industries, which forces all companies to increase product prices if primary inputs increase in price. The results are shown in table 3, column 3.
The largest price increase is expected for coal, gas, other mining (+1.4%), followed by trade, transport, and communication (+1.3%), and agriculture (+1.2%). All in all, product prices are expected to increase by 0.9%. The impact on foreign trade reveals that only exports become more expensive. Export prices are expected to increase by 1.0%. Import prices are not affected.
Scenario 4: Increase in Net Operating Surplus of Petroleum Refining
Many oil producing countries sell fuels in the domestic market well below international prices, sometimes even below their own production costs. This is an indirect subsidy for refined products. In this situation, the oil and gas industry have the option of asking higher feedstock prices for crude oil and natural gas for refineries and the petrochemical industry and of raising the prices for refined products.
In the input–output table for Austria for 2011, the industry ‘Coke and refined products’ reports a net operating deficit of 79 million euro. In this scenario, we would like to increase the net operating surplus to 250 million euro.
For this simulation, we used the price model of input–output analysis and applied the goal seek procedure of Excel to attain the result by raising the input coefficient for net operating surplus to the required level. The results are shown in table 3, column 4.
The price for refined products should increase by 5.3% to reach the target of 250 million euro for the net operating surplus of the refining industry. All other product prices are hardly affected by this decision (+0,1%). Due to the consumption of diesel in agriculture, the prices for agricultural products will increase by 0.14%.
The impact of foreign trade is small. Imports are not affected by the decision to increase the domestic price for refined products. Export prices for refined products are expected to increase by 4.2% and for all products by + 0.1%.
Scenario 5: Introduction of Taxes on Fossil Fuels
In this scenario, we assume that a general tax on fossil fuels of 50% is imposed on domestic and imported coal, gas, and products of other mining. The implementation of such a scenario is a little more complicated than the previous ones. In a first step, the input coefficients for domestic and imported fossil fuels of the input–output table are multiplied for industries with a scaling factor of 0.5 reflecting the 50% tax on fossil fuels. In a second step, the taxes on fossil fuels for industries are added to the taxes on products excluding VAT. The direct purchases of domestic and imported fossil fuels by final users are also weighted with the tax rate of 50% and then added to the taxes on products excluding VAT paid by final users.
We applied the price model of input–output analysis for this scenario and the results are shown in table 3, column 5.
The tax on fossil fuels of 50% is expected to increase the price of refined products by 37.4% and of electricity by 10.1%. The price index for coal, oil, gas, and other mining is expected to increase by 5.4%. In sum, product prices are expected to increase by a more moderate 1.6%. The new tax on fossil fuels is included in the row of taxes on products that increases in value from 10.969 billion euro to 17.668 billion euro by (+6.655 billion euro or + 61.0%).
We should keep in mind that all products in the input–output table are shown at basic prices without taxes less subsidies on products. Taxes and subsidies on products are shown in separate rows. In the system, the new tax on fossil fuels is added to row 23 (taxes on products excluding VAT) of the input–output table (table 1). The introduction of a fossil fuel tax will increase the costs of primary inputs, which, in a competitive market, induces a general price increase of 1.6% for the economy. Coal, oil, gas, and other mining are only affected by a price increase of 5.4% as the inputs of fossil fuels in this sector are limited. However, prices for coke and refined products are expected to increase by 37.4% as the input of coal, oil, and gas in this industry are substantial. For electricity, a price increase of 10.1% is expected. These findings are possibly the most interesting of our analysis.
In a final step, a revised input–output table is compiled that reflects the new prices indexes and the tax on fossil fuels. The revised input–output table is used to evaluate the impact of the fossil fuel taxes on GDP.
If a general tax on fossil fuels of 50% is introduced, the GDP deflator is expected to increase by 2.2%. Private consumption is affected by 1.4% and exports by 2.1%, reflecting the larger increase in intermediates (+3.0%) that are more expensive, and these additional costs are passed through to the final products. However, output prices (+1.6%) will not increase as much since value added is not affected by a price increase.
For this type of analysis, it would be very useful to implement extended input–output tables (United Nations, 2018: 518) with satellite systems in physical units. The extended input–output table comprises separate matrices for employment (1,000 persons), energy use (petajoule), air emissions (1,000 tons), global warming, acid deposition, and tropospheric ozone formation (1,000 tons), and waste, sewage, and water (1,000 tons, Millions cubic meters).
Scenario 6: Enforce Import Substitution for Refined Products
In this scenario, we assume that all refined products are produced in the domestic economy. To build up the domestic refining industry, all imports of refined products are banned. In this case, we apply the quantity model of input–output analysis as the Leontief inverse is affected by this drastic enforcement of import substitution. In addition, we also assume that final users cannot buy imported refined products any longer. This is a scenario to evaluate a policy towards autarky in a specific sector.
In table 1, we presented the input–output table for Austria with separate information on domestic products (rows 1–9) and imported products (rows 11–19). In the Leontief quantity model, we assume that the Leontief production function with constant input coefficients is defined for products without regard for where they come from. In other words, any company in Austria has a high flexibility to buy intermediates at home or abroad depending on prices, transportation costs, and regulations. However, for intermediates as such (combined domestic and imported intermediates) and other primary inputs, we assume that the Leontief technology of fixed input coefficients applies in the short run. We could easily change the scenario to a less dramatic assumption on refined products by assuming that for security reasons only 20% of all imported refined products should be produced in the domestic market.
The impact of import substitution of refined products on GDP is shown in table 3, column 6. In this situation, it is expected that GDP will increase by 0.4% and imports decline by 0.8%. This reprepresents physical growth in quantities as prices do not change. Stronger growth of 2.5% is expected for intermediates as the rapid growth of the refining sector requires more intermediates at all stages of production. In this situation, the refining industry will grow by 111.2% and the coal, oil, and gas industry by 21.3%. The overall impact on economic growth is modest with an increase of output by 1.5%.
The policy to build up a domestic refining industry by reducing all imports of refined products affects foreign trade. Imports are expected to decline by –0.8%. Exports are not affected. In this scenario, import of fossil fuels increases by 4.569 billion euro, and is required to provide the feedstock for the growing refining industry. At the same time, imports of refined products are reduced by 6.766 billion euro as they are now produced in the domestic economy.
6.2 Summary of Results for Fuel Subsidy and Taxation Reform
In table 3, we present the main findings for fuel subsidy and taxation reform. Depending on the measure, reform is affecting all quadrants of an input–output table, intermediates, value added, and final demand. If subsidies for final users are reduced, final users must pay higher prices for domestic products. Domestic intermediates become more expensive if subsidies on fuels are reduced for industries. If the import of refined products should be reduced, more refineries need to be built to meet domestic demand and output will grow.
In this paper we assume that domestic refineries have enough capacity to produce the former imported refined products. However, if the capacity of domestic refineries needs to be enlarged accordingly, more time and investment are required. We could tackle this problem with a dynamic input–output model, but it is beyond the scope of this paper.
To fight the negative operating surplus of the refining industry, the price of petroleum products was increased to attain sustainable levels. Finally, the introduction of a tax on fossil fuels had a significant impact on all other prices.
By applying the quantity model and price model of input–output analysis, we conducted a partial equilibrium analysis. Decreasing subsidies open new opportunities for the government to redirect revenues to other welfare-enhancing projects (education, infrastructure) or by reducing taxes and thereby increasing the disposable income of consumers. These reallocations of government funds will also have system-wide impacts.
7. Conclusions
Input–output data offer new opportunities for analysing fuel subsidy reform. Most Statistical Offices compile supply, use, and input–output tables as an integral part of their national accounts, including valuation matrices trade and transport margins and taxes less subsidies on products. This database allows a profound assessment of fuel subsidy reform for products and industries. This paper mainly dealt with fuel subsidies and taxation reform aimed at taxes less subsidies on products, production, and imports. However, indirect subsidies of industries, such as capital transfers, are not covered.
Would Austria win or lose by introducing a fuel subsidy reform? Austria has already moved along this path by reducing subsidies on products for fuels. Such a reform would hardly be relevant for Austria as the subsidies for fuels in 2011 were small. However, subsidies for industries are more substantial.
If, however, we conducted the same analysis for Saudi Arabia, the results would be highly relevant for a discussion on the reform. Unfortunately, the data for the large input–output tables of Saudi Arabia are still confidential and can only be used internally. For Kuwait supply, use and input–output tables are available but the critical data on the imposition of taxes and subsidies on products as well as the allocation of other taxes on production and other subsidies on production are not known.
The duration of such effects can be evaluated by comparing a time series of supply, use, and input–output tables. These data are available for all member countries of the European Union and selected other countries, such as Canada and Norway.
The main findings are: Input–output models can be used to evaluate the impact of a withdrawal or reduction of taxes and subsidies on products on economic development in a disaggregated approach for products and industries. We evaluated six scenarios for the fuel subsidy reform which cover all aspects of supply and demand and foreign trade. Detailed results are shown for output, inflation, and GDP, including exports and imports.
On the demand side, we implemented one quantity model of input–output analysis. This model can be used if final demand and intermediate consumption of products is directly affected. In Scenario 6, we evaluated complete import substitution for refined products that resulted in changes in the production input structure and the associated Leontief inverse.
On the supply side, we developed five price models of input–output analysis for the evaluation of a fuel subsidy reform. In Scenario 1, we studied the consequences of a complete reduction of all subsidies for specific products. In Scenario 2 we studied the consequences of a complete withdrawal of all subsidies for industries. In Scenario 3, we tested an increase of all taxes on products excluding VAT by 100%. In Scenario 4, we evaluated what needs to be done if prices for fuels were introduced in a nation which tries to cover at least the production costs for fuels. This grant of an indirect subsidy could also be easily implemented for electricity. In Scenario 5, we presented the most interesting results of the analysis. It concerns the introduction of a general tax on fossil fuels of 50%. If such a tax were imposed in Austria in the year 2011, the price index for secondary energy is expected to increase by 37.4% for coke and refined products and for electricity by 10.1%, a large margin as most primary fuels are imported. The expected impact on price indexes for output of all industries (+1.6%), private consumption (+1.4%), and GDP (+2.2%) is more moderate. Finally, as noted above, in Scenario 6 we applied the Quantity Model of input–output analysis to find out how an import substitution of refined products will affect the domestic economy.
Appendix: Input–Output Models
Leontief Quantity Model

Leontief Price Model


