Introduction
A great deal of research in the exercise sciences has focused on how the human exercise response, and the response to training, is conditioned by such factors as age, maturation, gender, nutrition, hypoxia, temperature and so forth. A seldom examined question, following the general hypothesis of Barker and colleagues,Reference Hales, Barker and Clark1–Reference Barker, Martyn and Osmond3 is whether variation in the human exercise response is conditioned by the powerful influence of the prenatal and early-life environment? Barker's studies first documented an association of poor fetal growth with an increased risk for chronic disease later in life, suggesting that intrauterine growth restriction (IUGR) during critical periods of development had the effect of reprograming developmental pathways to permanently alter adult metabolism. Skeletal muscle may be particularly susceptible to these fetal programing (FP) effects as restricted nutrients during fetal development tend to be partitioned preferentially to the heart, brain and other more vital organ systems. Myogenesis occurs at a very early stage during embryo formation, is particularly sensitive to environmental perturbation, and ultimately determines a number of relatively fixed traits in adulthood including the muscle fiber number, the fiber size and the fiber-type distribution.Reference Maltin, Delday and Sinclair4 Animal data show fairly clearly a reduction in the overall muscle fiber number associated with nutrient restriction and poor fetal growth, as well as increases in type I v. type II fibers in adulthood.Reference Ward and Stickland5–Reference Bauer, Gedrange and Bauer7
In humans, studies of children and adults show that low birth weight is associated with a reduction in the relative amount of lean tissue compared with body fat.Reference Labayen, Moreno and Blay8–Reference Gale, Martyn and Kellingray10 With respect to human performance, several studies show that small size at birth predicts decreased muscle strength,Reference Sayer and Cooper11–Reference Thompson, Sanderson and Sandeman14 and recent work by our research group suggests increased muscle fatigability and poor strength gains after resistance training.15 One study of the isolated finger flexors using 31P magnetic resonance spectroscopy (31PMRS) showed that low ponderal index (g/cm3) at birth, a measure of infant thinness, which can characterize babies with and without linear growth restriction, was associated with a reduced exercise duration and a faster rate of phosphocreatine (PCR) depletion.Reference Taylor, Thompson and Kemp13 Another study, using near-infrared spectroscopy, showed an increase in the rate of forearm muscle reoxygenation in low ponderal index subjects after finger flexion exercise.Reference Thompson, Sanderson and Sandeman14
In the aforementioned studies, muscle performance was evaluated on the finger flexors only, or on an isolated muscle mass. To date, only a few studies have examined the association of poor fetal growth with whole-body measures of physical performance. For example, a number of epidemiological studies have described the association of birth size with measures of cardio-respiratory fitness, but there is no clear consensus that poor fetal growth results in a decreased maximal oxygen consumption (VO2max).Reference Boreham, Murray and Dedman16–Reference Laaksonen, Lakka and Lynch22 This may be because study populations have differed (from children to the elderly) and because the methods of fitness assessment have varied, from direct to indirect, that is, VO2max v. shuttle run tests. Also, there has been little attention paid to the potential confounders of cardio-respiratory fitness, including physical activity levels, training effects and body size, all of which directly impact the absolute VO2max or the expression of VO2max normalized for body size. For this reason, the specific aim of the present study was to test the hypothesis that low ponderal index at birth is associated with a reduction in VO2max in later life, after controlling for weight and/or fat-free mass (FFM) and the pre-study physical activity patterns and training status of participants. In addition, lactate profiles were measured during a separate incremental exercise test in order to test the hypothesis that low ponderal index is associated with an altered metabolic response to exercise, consistent with the findings of the 31PMRS and spectroscopy studies referenced above.Reference Taylor, Thompson and Kemp13, Reference Thompson, Sanderson and Sandeman14
To meet these study goals, 36 college-aged men and women, born to term (37–42 weeks gestation), were recruited to participate in an 8-week aerobic training program. Exercise response measures were made before and after training. Study participants comprised two study groups, high ponderal index (HIGHPI) and low poneral index (LOWPI; n = 18/group), identified as falling above and below the 10th percentile of the ponderal index-for-gestational age distribution, respectively. The HIGHPI and LOWPI subjects were matched pair-wise on age, sex, body mass index (BMI) and pre-study physical activity patterns. We used the ponderal index as a marker of poor fetal growth for two reasons. First, the 10th percentile cutoff is an externally validated threshold criterion, which has a relatively high sensitivity and specificity to predict IUGR.Reference Vintzileos, Lodeiro and Feinstein23 Second, several previous studies, described above, used ponderal index as an independent variable, and were successful at detecting FP effects on exercise performance outcomes in a relatively modest number of study participants. The alternative to the ponderal index is birth weight, but the birth-weight-for-gestational-age as a marker of poor fetal growth is more problematic in correctly identifying IUGR infants. That is, not all IUGR babies are small-for-gestational-age, and not all small-for-gestational-age babies are small due to growth restriction. Also, the ponderal index appears to be better associated with rapid catch-up growth in the 1st year of life and with obesity and insulin resistance later in adulthood,Reference Phillips, Barker and Hales2 and these are also hallmarks of the FP complex.
Methods
Subjects and recruitment
Thirty-six healthy male and female undergraduates born to term (37–42 weeks gestation) were recruited into the study on the basis of birth measures and sorted into two study groups who were matched pair-wise by age, sex, BMI and pre-study physical activity patterns (see ‘Study design’ section below). The LOWPI group (n = 14 females and 4 males) were defined as falling below the 10th percentile of ponderal index-for-gestational age compared with an external reference standard. As described, this cutoff has a high sensitivity and specificity to predict IUGR.Reference Vintzileos, Lodeiro and Feinstein23 The HIGHPI group (n = 14 females and 4 males) were defined as falling in the upper normal range above the 10th percentile of ponderal index-for-gestational age. Mean ponderal indices were 2.2 ± 0.1 and 2.7 ± 0.1 g/cm3 for LOWPI and HIGHPI groups, respectively. Participants were required to document birth measures via a hospital record and/or a birth certificate. Gestational age was determined from the documented due date, if it was available in the medical record, or if not, from maternal recall. Maternal recall of birth measures has been demonstrated as reliable for both clinical and epidemiological use,Reference Adegboye and Heitmann24 and our data showed the expected increase in both birth weight and ponderal index with increasing gestational age from 37 to 42 weeks compared with standard reference populations. All participants were interviewed to obtain a medical history. Exclusion criteria included current pregnancy or pregnancy within the previous year, asthma, cardiovascular disease, diabetes, musculoskeletal problems that would have contraindicated participation in the training program or study protocols and anemia measured via a spot measure of hemoglobin concentration from finger-tip blood using a point-of-care hemoglobin analyzer (Hemocue, Angelholm, Sweden). The Institutional Review Board of the University at Albany, SUNY, approved the study, and participants gave written informed consent and were compensated for their time.
Study design
On entry into the study and before performance evaluation, diet and physical activity patterns were assessed. To evaluate activity patterns, participants wore GT1M Actigraph accelerometers (Pensacola, FL, USA) during waking hours over 3 continuous days (2 weekdays and 1 weekend day). Accelerometer count data were processed to produce metabolic equivalent of task (MET) values of daily energy expenditure. Diet was assessed via the diary method and detailed instructions were given on how to record all caloric intake over 2 weekdays and 1 weekend day. Analysis of the dietary data was by the same investigator using the N2 Nutrition IV software package (N-Squared Computing, Salem, Oregon). After baseline evaluations, participants completed an 8-week training program with pre- and post-training evaluations of body composition and exercise performance as detailed below. A venous blood sample was drawn after an overnight fast in the pre-trained state to measure glucose and insulin. Serum glucose was measured using a hexokinase/glucose-6-phophatase dehydrogenase assay (Synchron LX20, Beckman Coulter Inc., Miami, FL, USA) or the glucose oxidase reaction (Beckman Oxygen Electrode, Beckman Coulter Inc., Miami, FL, USA). Serum insulin was assayed using the Immulite 1000 Insulin Kit (LKIN1) on the Immulite 1000 (Seimens Medical Solutions Diagnostics, Los Angeles, CA, USA). The homeostasis model assessment (HOMA) index for insulin resistance was calculated according to the following equation: HOMA = (fasting plasma insulin) × [(fasting plasma glucose)/22.5].Reference Matthews, Hosker and Rudenski25
Training
Training consisted 40-min interval spin-bicycle sessions, three times a week, for 8 weeks, with the goal of increasing VO2max. Participants wore heart-rate (HR) monitors and were required to keep HR values within target limits during structured intervals that included warm-up/warm-down periods, as well as intervals of varying intensity that lasted from 1 to 4 min. In total, training was structured so that 25% of time was spent in light cycling (HR range at 50–70% of VO2max), 50% of time in moderate cycling (70–80% of VO2max), and 25% in hard cycling (80–90% of VO2max). All participants kept a training log, and all participants completed the 24 sessions of the training program. For the measures described below the same equipment and protocols were used both before and after training.
Body composition
Body density was determined by hydrodensitometry. The underwater weight was obtained using a suspended seat attached to an LC105 250/S Omega beam load cell force transducer (Omega Engineering, Stamford, CT, USA). The load cell was calibrated before and after each measurement and a continuous force signal was acquired by an REM/400M data acquisition system (CB Sciences, NH, USA). Subjects were required to exhale to residual volume (RV) before submerging, and the underwater weight was ascertained once stable and replicable weight values were obtained from multiple trials (typically 5–10 trials per subject). The RV was measured outside of the water tank in a seated position using an oxygen dilution technique. The Siri equation was used to calculate body fat percentage from body density and fat and FFM were calculated from the total body weight.
VO2max
Aerobic capacity was measured on a stationary cycle ergometer (Monarch 874E) using an incremental protocol. Subjects started with a workload of 1.0 kg resistance at 70 rpm for 3 min. For the second workload (also 3 min), resistance was incremented by 0.5 kg for females and 1.0 kg for males. For the third workload (2 min), resistance was incremented by 0.5 kg. Thereafter, the workload was incremented every minute by 0.25 kg until subject volitional fatigue for both men and women. VO2max was defined as the highest level of oxygen consumption averaged over the final minute of the test concomitant with at least two of the following conditions: (1) a nonlinear increase in exercise ventilation resulting in a respiratory exchange ratio greater than 1.10, (2) a plateau in the VO2–work rate relationship, or (3) a maximal HR within 10% of the age predicted maximum. During VO2 testing, subjects breathed through a low-resistance breathing valve (Hans-Rudolph). The expired ventilation (l/min BTPS) as well as the fractional concentrations of O2 and CO2 in the expired air were processed by a Parvo-medics TrueMax metabolic measuring system (Sandy, UT, USA) to produce 1-min interval calculations of VO2. Gas analyzers were calibrated with standard gases before each exercise test. The pneumotach used to measure ventilatory flow was also calibrated prior to each test with a 3-l calibration syringe. HR was continuously monitored via telemetry (Polar Electric Oy, Sweden) interfaced with the metabolic measuring system.
Lactate levels during exercise
On a separate day, after the VO2max test, subjects returned to the laboratory for measurement of lactate levels at rest, and during cycle ergometry exercise at 30%, 60% and 90% of the previously determined pre-training VO2max. Exercise bouts were incremental and were 5 min in duration. Arterialized blood was obtained from an earlobe between the 4th and 5th minute of each workload and immediately analyzed using a Lactate Scout analyzer (EKF Diagnostic, Magdeburg, Germany). Five minutes after completion of the 90% work bout, an additional earlobe sample was obtained for recovery assessment. After training, the identical protocol was again administered with work settings at 30%, 60% and 90% of the pre-training VO2max, that is, at the same external work settings that were prescribed in the pre-trained state.
Statistical analysis
All outcome measures were evaluated for normality using the Kolmogorov–Smirnov test against a standard normal distribution using the Lilliefors two-tail probability and were not significantly different from normal. Analysis of variance (ANOVA) and analysis of covariance (ANCOVA) were used to test for mean differences by ponderal index group. Covariates were introduced as explained in the ‘Results’ section below. Repeated measures ANCOVA was also used to test for overall ponderal index group differences in lactate levels. For all ANCOVA models, variables representing the change (Δ) with training were evaluated by controlling for the baseline (pre-training) values of these measures. This is the suggested approach for dealing with change variables, rather than performing analyses on percentage change or absolute change from baseline.Reference Kaiser26 For all tests, statistical significance was indicated at P < 0.05 for both main and interaction effects. Values are presented in both tables and figures as means ± s.e.m. All statistical analyses were performed using SPSS statistical software, version 17.0 for Macintosh (SPSS Inc., Chicago, Il, USA).
Results
General characteristics
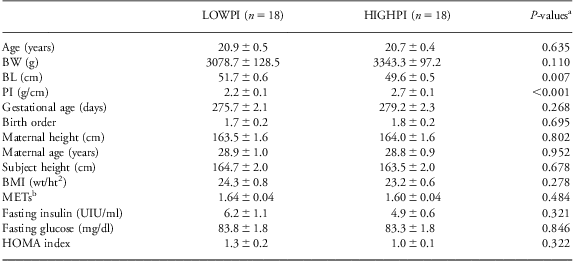
Study group descriptive data are given in Table 1, including birth and perinatal information. The LOWPI group had lower PI due to both increased birth length (P = 0.007) and a trend toward decreased birth weight (P = 0.110). In contrast, LOWPI and HIGHPI subgroups were well matched on a number of other potential confounders including age, gestational age, birth order, maternal height, maternal age, subject height, BMI (m/kg2), pre-study physical activity, that is, energy expenditure (METs), fasting insulin and glucose and the HOMA index as a marker of insulin sensitivity. Also, in the week preceding entry into the study, there were no significant differences detected between ponderal index groups in the caloric intake of carbohydrates, fats or proteins expressed either as kcals/day or as a percentage of the overall caloric intake (dietary data not shown).
Table 1 General characteristics of study samples

BW, birth weight; BL, body length; PI, ponderal index; BMI, body mass index; METs, metabolic equivalent of tasks; HOMA, homeostasis model assessment; ANOVA, analysis of variance.
aP-values from ANOVA.
bMET values are the average of three 24-h days of activity monitoring.
Body composition
As expected, body composition was responsive to training. Although the total body weight changed minimally with training, the overall mean FFM of participants increased by 0.79 kg (P < 0.01), while body fat percentage decreased by 1.44 percentage points (P < 0.01). However, LOWPI v. HIGHPI subgroups did not differ significantly for pre-training, post-training or Δtraining values of body composition (Table 2).
Table 2 Pre- and post-training body composition and VO2max
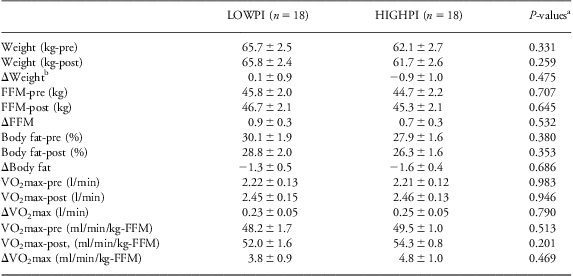
VO2max, maximal oxygen consumption; FFM, fat-free mass; ANOVA, analysis of variance; ANCOVA, analysis of covariance.
aP-values from ANOVA.
bANCOVA models testing for change (Δ) control for the pre-training value.
Aerobic capacity
As expected, VO2max expressed as l/min or ml/min/kg-FFM increased by ∼11% with training (P < 0.01; Table 2). However, there were no significant PI-group differences in pre-training, post-training or Δtraining values.
Lactate profiles during exercise
Lactate levels in blood measured at rest, during steady-state exercise (30%, 60% and 90% of an individual's pre-training VO2max) and after recovery from exercise are shown in Fig. 1. With increasing exercise intensity lactate levels rose following the expected profile, that is, lactate levels increased significantly over resting values starting at about 60% of VO2max. As expected, after training, lactate values were significantly lower at the same levels of external work compared with the pre-trained state, and also during the recovery phase (P < 0.001). There were slight differences in the overall lactate values between males and females, with females showing lower lactate values from 60% VO2max on, but there was no interaction effect (sex-by-PI) to warrant independent analyses by sex.
Fig. 1 Blood lactate at rest, during steady-state exercise and after 5-min recovery, in LOWPI v. HIGHPI subjects. The x-axis exercise settings were at 30%, 60% and 90% of a subject's predetermined VO2max. *P < 0.05 for the comparison of ponderal index subjects groups before training. There were no significant group differences after training.
In the pre-trained state, LOWPI v. HIGHPI had significantly lower lactate levels at 90% of VO2max (P = 0.032) and in recovery P = 0.012). Repeated measures ANOVA at 60% and 90% of VO2max, and recovery, also revealed significantly lower lactate levels in the LOWPI group in the pre-trained state (P = 0.016), and a significantly smaller Δlactate with training (P = 0.044). In contrast, the post-training lactate levels did not differ significantly between the PI-groups.
Across the entire study sample, Δlactate was negatively correlated with the ΔVO2max values. That is, participants with larger aerobic capacity gains also showed larger decreases in lactate levels at a fixed level of external work, for example, see Fig. 2 (R = −0.58, P < 0.001, at the 90% of VO2max level). To be certain that PI-group differences in lactate were not due to individual differences in aerobic fitness or fitness gains with training, the above analyses were repeated, but with the inclusion of pre-training VO2max, post-training VO2max or ΔVO2max covariates, as appropriate. Interestingly, the inclusion of these covariates had the effect of strengthening rather than diminishing the association of ponderal index group with lactate levels. This is shown for the Δlactate at 90% of pre-training VO2max in Table 3, which presents two ANCOVA models, one with and one without the ΔVO2max as a covariate. In the unadjusted model (model 1), ponderal index group is significantly associated with Δlactate and explains 11.4% of the variance, that is, LOWPI subjects have a smaller decrease in lactate at a fixed level of external work after training. In model 2, adjusting for the ΔVO2max, the P-value was lowered and the proportion of the variance in Δlactate explained was increased to 14.6%. Fig. 2, which plots Δlactate v. ΔVO2max, provides additional insight into this difference. Although both ponderal index groups showed the expected inverse relationship between Δlactate with ΔVO2max, the correlation was only borderline significant in LOWPI (P = 0.05) and the slope and strength of association were greater in the HIGHPI, that is, P = 0.041 for the interaction of ponderal index group and ΔVO2max, and correlation coefficients of R = −0.70 and R = −0.47 in the HIGHPI and LOWPI groups, respectively.
Fig. 2 Change (Δ) in lactate levels by change in VO2max after 8 weeks of aerobic training in LOWPI v. HIGHPI groups. Shown is the lactate level measured at 90% of VO2max. P = 0.041 for the interaction of ponderal index group and ΔVO2max.
Table 3 Repeated measures ANCOVAFootnote a: the association of study group (LOWPI v. HIGHPI) and VO2max response to training (ΔVO2max) with lactate levels during exercise
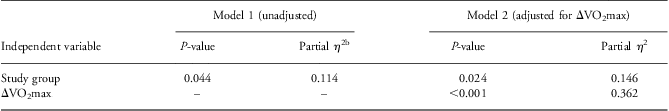
ANCOVA, analysis of covariance; VO2max, maximal oxygen consumption; ANOVA, analysis of variance.
a Repeated measures on lactate levels at 30% and 60% of VO2max and in recovery.
b Partial η 2 in repeated measures ANOVA is analogous to R 2 in ANOVA, that is, the proportion of total variation attributable to a factor, excluding other factors in the model.
Discussion
Contrary to our hypothesis, VO2max and the VO2max response to a training intervention were not dependent on the ponderal index at birth, that is, there were no differences in the pre- or post-training VO2max (expressed either as l/min or ml/min/kg-FFM), or in the training response (ΔVO2max), between two groups of well-matched young adults who differed by ponderal index-for-gestational age. In contrast, the exercise blood lactate levels and the lactate response to a training intervention were dependent on the ponderal index. Because the lower 10th percentile of the ponderal index distribution (which defined the LOWPI group) is considered to be a valid marker of IUGR,Reference Vintzileos, Lodeiro and Feinstein23 these findings are discussed below with respect to Barker's general hypothesis and FP.
Regarding Barker's hypothesis, there is now an extensive body of human an animal data that supports the idea that environmental stress can reprogram developmental pathways during formative periods to permanently affect the adult phenotype.Reference Hales, Barker and Clark1–Reference Barker, Martyn and Osmond3, Reference Armitage, Khan and Taylor27 Three points are worth emphasizing. First, FP has a graded effect and operates across the entire range of normal human birth measures. For chronic diseases at least, there is a dose–response of risk across the full range of birth measures, not just increased risk below a lower critical threshold.Reference Hales, Barker and Clark1, Reference Barker, Martyn and Osmond3 The same could be true for exercise response measures, and so FP should be considered as a possible mechanism to explain some of the normal variation in human physical performance outcomes. Second, many FP effects are evident early in life. For example, insulin disturbances and insulin resistance have been documented in children and young adults born with low birth weight and/or low ponderal index.Reference Law, Gordon and Shiell28 Thus, it is a reasonable expectation to find exercise performance differences among healthy young adults who have experienced IUGR, especially given the strong effects of FP on muscle tissue and body composition. Finally, despite the extensive empirical support for Barker's hypothesis, the lifelong pathways and mediating factors that lead from IUGR to increased adult disease risk are largely unknown. It has been suggested that skeletal muscle plays a critical mediating role,Reference Jensen, Storgaard and Madsbad29, Reference Ozanne, Jensen and Tingey30 but the relationship of muscle in this regard with other important health correlates, including cardio-respiratory fitness and physical activity levels, remains poorly understood.
With respect to VO2max, our findings are generally consistent with previous research. To date, only a few studies have examined the association of birth measures with either a direct or indirect measure of cardio-respiratory fitness, and the results of these studies have been mostly negative. Of several epidemiological studies evaluating fitness correlates,Reference Boreham, Murray and Dedman16–Reference te Velde, Twisk and van Mechelen18 only one showed evidence that poor fetal growth diminished exercise performance.Reference Boreham, Murray and Dedman16 In that study, with a cohort of n = 1015 male and female adolescents, and controlling for body size, maturation and physical activity level, birth weight was positively associated with a fitness index score that was derived from an individual's performance on a shuttle run test. We are aware of only four FP studies that have directly measured VO2max in humans,Reference Baraldi, Zanconato and Zorzi19–Reference Laaksonen, Lakka and Lynch22 and all of those were negative, including the study of Baraldi et al.,Reference Baraldi, Zanconato and Zorzi19 which found similar VO2peak values adjusted for body size even in very low birth-weight children born pre-term (<1500 g). The present study was similar to the study of Laaksonen et al.Reference Laaksonen, Lakka and Lynch22 in that we used ponderal index as a marker of FP rather than birth weight, but unlike that study, which evaluated a cohort of n = 462 middle-aged men, we used an experimental approach with fewer subjects that allowed for better control of physical activity level, diet and FFM. Despite the smaller number of subjects, a post hoc power analysis revealed sufficient study power (i.e. 80%) to detect ∼5% differences between groups in VO2max outcomes. Differences smaller than 5% are unlikely to be physiologically relevant given the myriad other factors that determine individual aerobic capacity.
This study is also the first FP study to report VO2max values per unit FFM. The literature is fairly consistent that VO2max per unit body mass or FFM is maintained even after severe fetal growth restriction. This maintenance of the relative VO2max (i.e. normalized for body size or FFM) occurs despite well-known decrements with IUGR in the overall FFM,Reference Labayen, Moreno and Blay8–Reference Gale, Martyn and Kellingray10 decrements in muscle strengthReference Sayer and Cooper11–Reference Thompson, Sanderson and Sandeman14 and clear changes in muscle morphology.Reference Maltin, Delday and Sinclair4–Reference Bauer, Gedrange and Bauer7 It should be noted that our subject groups had similar body size and FFM, but this was likely due to the matching protocol on BMI. The ability to maintain a normal relative VO2max is consistent with the findings of Brons et al.Reference Brons, Jensen and Storgaard21 who showed that in vivo mitochondrial function was normal in low birth weight subjects. Thus, IUGR and FP do not likely affect the capacity for peripheral O2 use. However, central deficits affecting O2 delivery should still be considered. For example, one study showed body size-independent deficits in forced vital capacity associated with low birth weight.Reference Canoy, Pekkanen and Elliott31 Such deficits in gas exchange capacity/efficiency would be more likely to limit elite athletes or very well-trained individuals,Reference Dempsey and Wagner32 and although our subjects were trained, no subject achieved a post-training VO2max greater than 50 ml/min/kg.
In contrast to VO2max, we found marked group differences in the pre-training lactate levels and Δlactate. At the same level of relative work output in the pre-trained state, the LOWPI group had lower blood lactate levels compared with the HIGHPI group. After training, blood lactate levels decreased (for a fixed level of absolute work) in both study groups, but the decrease was significantly greater in the HIGHPI group. These pre-training and Δlactate differences persisted, and indeed were strengthened, after statistical control for the pre-training variation in VO2max or the ΔVO2max, respectively. Thus, group differences in the pre-training lactate were not likely due to individual differences in pre-training cardio-respiratory fitness, or to individual differences in the overall cardio-respiratory response to 8 weeks of training. Similarly, the lactate differences were not likely due to diet as this was similar between groups at the beginning of the study. The respiratory exchange ratios during submaximal exercise were also similar between groups, suggesting no differences in fuel substrate utilization, and the pre-training fasting glucose and insulin levels were similar between the two study groups.
One possibility to explain the dependence of the lactate response on the ponderal index is that IUGR reprograms some aspect of the complicated dynamic between aerobic and anaerobic energy provisioning. This possibility has some support in the literature. Two studies on isolated muscle groups in vivo, by the same investigators, one using 31PMRS, and the other near-infrared spectroscopy, have both concluded that low ponderal index at birth leads to a delay in the activation of glycolysis/glycogenolysis at the commencement of strenuous muscle contraction.Reference Taylor, Thompson and Kemp13, Reference Thompson, Sanderson and Sandeman14 This in turn results in a rapid depletion of PCR stores. However, how rapid PCR depletion leads to decreased lactate production and/or increased lactate clearance during steady-state exercise in LOWPI subjects is not clear?
Another possibility is that FP effects on lactate are mediated through changes in muscle morphology, including changes in muscle fiber number, fiber size and fiber composition. In animals, poor fetal growth induced by nutrient restriction reduces overall muscle fiber number, fiber density, muscle capillary density and alters fiber-type proportions.Reference Costello, Rowlerson and Astaman6, Reference Fahey, Brameld and Parr33–Reference Zhu, Ford and Means35 Changes in fiber-type proportions could be particularly important. Type I fibers have a higher oxidative capacity compared with type IIx (IIb) and IIa fibers. The animal literature shows that fetal nutrient restriction reduces the total muscle fiber number, primarily as a consequence of a reduction in the formation of secondary v. primary muscle fibers during myogenesis.Reference Ward and Stickland5, Reference Zhu, Ford and Means35, Reference Dwyer, Stickland and Fletcher36 Because secondary muscle fibers are the precursors of adult type II fibers, fetal nutrient restriction may also increase the proportion of type I to type II fibers in neonatal animals.Reference Bauer, Gedrange and Bauer7 Given the high oxidative and low glycolytic capacity of type I fibers, this could certainly explain the lower lactate levels of LOWPI subjects. However, the one study in the human FP literature that has evaluated muscle fiber types is inconsistent with this hypothesis.Reference Jensen, Storgaard and Madsbad29 In that study, young men born below the 10th percentile for birth-weight-for-gestational-age showed an increased proportion of type IIx fibers at the expense of IIa fibers, with no significant differences in the proportion of type I fibers. In humans, IIx fibers express a higher glycolytic and lower oxidative capacity compared with type IIa fibers, and so this is not consistent with lower lactate levels. However, again, it should be emphasized that the present study used ponderal criteria to establish IUGR, not the birth weight.
One serious potential confounder to consider is the pre-study and/or lifelong physical activity patterns of the study participants given the clear association of physical activity with exercise outcomes. This is a concern as several animal studies now show reduced voluntary wheel running behavior in rats who have experienced IUGR.Reference Vickers, Breier and McCarthy37, Reference Vickers, Breier and Cutfield38 We consider confounding based on physical activity patterns to be unlikely. The pre-study physical activity levels, as assessed by accelerometry, were not different between the LOWPI and HIGHPI groups. Also, no compelling link between birth measures and later-life physical activity patterns in humans has been established. In adults, the literature is conflicted with studies both supportingReference Andersen, Angquist and Gamborg39–Reference Hovi, Andersson and Eriksson41 or failing to supportReference Laaksonen, Lakka and Lynch22, Reference Eriksson, Yliharsila and Forsen42 the hypothesis that IUGR leads to a decrease in physical activity. Similarly, studies of physical activity in adolescents are conflicted.Reference Hallal, Wells and Reichert43, Reference Mattocks, Deere and Leary44 In the Pelotas cohort of 10–12-year-old Brazilian adolescents (n = 634), using a retrospective questionnaire administered to mothers, children of low birth weight had slightly fewer minutes of total activity per week, but no differences in sedentary behavior, defined as less than 300 min/week of physical activity.Reference Hallal, Wells and Reichert43 In the Avon Longitudinal Study of Parents and Children (ALSPAC) study of 11–12-year-old UK adolescents (n = 5451), each child was assessed via accelerometry for 7 days. ALSPAC was an ambitious study using a validated method of activity assessment, but few early-life biological factors were shown to predict physical activity levels at age 11–12, including low birth weight and/or low ponderal index.Reference Mattocks, Deere and Leary44
In summary, the absolute and relative VO2max (adjusting for FFM) both before and after training were similar between a group of subjects born below the 10th percentile of the ponderal index-for-gestational age and well-matched controls. Thus, aerobic capacity and the response to training do not depend on the ponderal index, and the putative effects of IUGR and FP do not appear to greatly affect the capacity for O2 utilization at the level of the muscle, despite other well-known effects on muscle morphology. This negative finding applies to healthy normal college-aged adults only, but may not be the case for very well-trained individuals or elite athletes where specific components of central O2 delivery or peripheral O2 use may be more important in limiting performance. It is also unknown whether similar results would obtain for other populations, particularly the elderly where rates of ageing have been postulated to depend on intrauterine experience.Reference Sayer, Cooper and Evans45 In contrast, lactate levels and the lactate response to a training intervention were dependent on the ponderal index, a finding that lacks a specific mechanistic explanation, but which may be due to early-life metabolic reprograming due to IUGR.
Acknowledgments
The authors would like to thank the research subjects for their time and effort, Diane Sisto from the Albany Medical Center, and Walter Ensel from the Center for Social and Demographic analysis, University at Albany, SUNY. This research was supported by NIH 1 R03 HD055314 to T.D.B. and T.B.G. The study sponsors had no role in the study design, in the collection, analysis and interpretation of data; in the writing of the manuscript; and in the decision to submit the manuscript for publication.