

Public perceptions of climatic change and variability have been greatly influenced by regional climatic trends and extreme events. Climate change has become one of the most serious challenges posed to the world in the 21st Century (Bekryaev et al. Reference Bekryaev, Polyakov and Alexeev2010; Ackerley et al. Reference Ackerley, Booth, Knight, Highwood, Frame, Allen and Rowell2011; Williams & Funk Reference Williams and Funk2011; Wild Reference Wild2012). In order to contribute to the understanding of this problem, it is necessary to consider climate simulations and predictions (Dole Reference Dole2012). Understanding past climates is difficult because records of climate change are limited and there are not enough data to establish a comprehensive and reliable system for climatic simulation. Palaeoclimatic data are mainly derived from natural sources, including lake sediments, stalagmites, corals, tree rings, oceans, glaciers and dated loess–palaeosol sequences (Mintzer Reference Mintzer1992; Jansen et al. Reference Jansen, Overpeck, Briffa, Duplessy, Joos, Masson-Delmotte, Olago, Otto-Bliesner, Peltier, Rahmstorf, Ramesh, Raynaud, Rind, Solomina, Villalba, Zhang, Solomon, Qin, Manning, Chen, Marquis, Averyt, Tignor and Miller2007), which are mainly related to past climates in the Holocene (An et al. Reference An, Kukla, Porter and Xiao1991a, Reference An, Kukla, Porter and Xiaob; Sun et al. Reference Sun, Lu and An2006). Research on palaeoclimatic variations in the middle and late Pleistocene are less abundant and, overall, are less understood. Many processes affecting climatic change predate the Holocene. Thus, long-term data are needed to assist with the interpretation and prediction of climatic change over longer timescales.
Quaternary loess–palaeosols have an extensive global distribution (Pye Reference Pye1984), record long-term climatic changes (Fink & Kukla Reference Fink and Kukla1977) and have been widely applied to studies of palaeoclimate (Heller & Liu Reference Heller and Liu1982; Liu Reference Liu1985; Liu & Ding Reference Liu and Ding1998). Some researchers have made remarkable achievements in their studies of palaeoclimate, using loess–palaeosols from central China (Liu & Ding Reference Liu and Ding1998), central United States (Hall & Anderson Reference Hall and Anderson2000) and central Europe (Fink & Kukla Reference Fink and Kukla1977). However, Quaternary climatic changes are varied and complex (Ding et al. Reference Ding, Xiong, Sun, Yang, Gu and Liu1999). Therefore, much more data are needed from different sites to enable the simulation and prediction of global climatic changes (Dole Reference Dole2012).
The East Asian monsoon is an integral part of the global climatic system (An Reference An2000) and its evolution is a principal and direct factor which controls palaeoenvironmental changes in East Asia (Liu Reference Liu1985; Yang & Xu Reference Yang and Xu1985; An Reference An2000). The East Asian monsoon has two seasonally alternating monsoon circulations – the East Asian summer monsoon (EAS) and the East Asian winter monsoon (EAW) (Zhang & Lin Reference Zhang and Lin1987). China is located in East Asia and has been controlled by the East Asian monsoon climate over the last 2600 ka BP (Liu & Ding Reference Liu and Ding1998; An Reference An2000). Research on loess–palaeosols from central China has shown that palaeosols are associated with a southerly moisture-bearing EAS (An et al. Reference An, Kukla, Porter and Xiao1991b), and loess is deposited dust which is transported by the northerly EAW under cold and dry conditions (Liu Reference Liu1985; An et al. Reference An, Kukla, Porter and Xiao1991a). These results help towards a better understanding of the evolution of the East Asian monsoon (An Reference An2000). In 2006, an exposed loess–palaeosol section was discovered during investigations in the northwest of Liaoning province in China, about 1000 km from the Chinese Loess Plateau (CLP). The 19.85-m section was formed since 0.423 Ma BP, and contains many different loess and palaeosol layers. It was previously called the Fenghuangshan section (Chen et al. Reference Chen, Wang and Han2009a, Reference Chen, Wang, Han and Wub) and has been renamed the Chaoyang section to reflect recent research on the CLP (Kalm et al. Reference Kalm, Rutter and Rokosh1996; Gylesjö & Arnold Reference Gylesjö and Arnold2006). Grain size can be used as a proxy indicator of the sedimentary environment (Sun et al. Reference Sun, Lu, Rea and Sun2000; Ding et al. Reference Ding, Sun, Yang and Liu2001). Chen et al. (Reference Chen, Wang, Han and Wu2009b) have conducted a systematic and intensive study of grain size characteristics of the Chaoyang section, using high resolution sampling (2 cm intervals). The dust source area is very sensitive to changes in continental aridity related to variations in global or regional atmospheric circulation (Vandenberghe et al. Reference Vandenberghe, An, Nugteren, Lu and Van Huissteden1997; Kukla & An Reference Kukla and An1989). Dust deposits in thick loess can provide some of the most complete and detailed information on the effects of climatic change (Liu Reference Liu1985; Pye Reference Pye1987). The Chaoyang loess–palaeosol sequence was determined to be of aeolian dust origin and is very suitable for palaeoclimatic research (Chen et al. Reference Chen, Wang, Han and Wu2009b). This section originates from aeolian dust deposits and, thus, ought to record palaeoclimatic changes which occurred during the Quaternary. Because grain size should not be used on its own, more firm evidence from other proxies is also needed to reveal palaeoclimatic variations in the Chaoyang section over the Late Middle Pleistocene.
Previous studies have demonstrated that clay minerals can serve as sensitive and reliable proxies of climatic change, and can aid in understanding the evolution of the monsoon climate (Zhang & Yuan Reference Zhang, Yuan and Liu1987; Peng Reference Peng1988; Wang Reference Wang1988; Kalm et al. Reference Kalm, Rutter and Rokosh1996; Huang et al. Reference Huang, Zhao, Liu, Tan and Koopal2011, Reference Huang, Zhao, Li, Tan and Wang2012). Given that loess is a consistent parent material, any differences should indicate variations in weathering (Liu & Ding Reference Liu and Ding1998), as reflected in the successive stages of mineralogical evolution (Turpault et al. Reference Turpault, Righi and Utérano2008). Clay minerals can be taken to be a reliable proxy of palaeoclimates, because the morphology and substructure of clay minerals are very sensitive to environmental changes and have been demonstrated to record these changes in crystal structures (Wilson Reference Wilson1999; Chadwick et al. Reference Chadwick, Gavenda, Kelly, Ziegler, Olson, Elliott and Hendricks2003; Velde & Meunier Reference Velde and Meunier2008; Velde Reference Velde2012).
This study of the Chaoyang section is based on high-resolution sampling to investigate clay mineralogy, in order to identify variations in the monsoon climate and to evaluate the suitability of the Chaoyang section for palaeoclimatic research. The overall aim was to investigate the paleoclimate during the Late Middle Pleistocene and to propose a palaeoclimatic sequence for the CLP. Comparisons are made with climate changes as recorded in other proxies at the Chaoyang section, along with other palaeoclimatic records such as oxygen isotopes from oceanic sediments and from loess–palaeosol sections on the Chinese Loess Plateau (CLP).
1. Materials and methods
The Chaoyang section is situated at Chaoyang (N 41°33′9.6″, E 120°30′ 20.8″; Fig. 1), and is located in the northeast area of China's loess area. The modern mean annual temperature and mean annual precipitation are 9°C and 450–500 mm, respectively. The Chaoyang section is about 1334 km northeast of the Lingtai section (N 35°00′75″, E 107°30′33″; 9.1°C, 600 mm) (Gylesjö & Arnold Reference Gylesjö and Arnold2006), about 1414 km northeast from the section at Baoji (N 34°24′, E 107°18′; 13°C, 700 mm) (Kalm et al. Reference Kalm, Rutter and Rokosh1996), about 1349 km northeast from the Wugong section (N 34°19′17″, E 108°07′07″; 12–14°C, 650–750 mm) (Huang et al. Reference Huang, Zhao, Li, Tan and Wang2012), and about 1542 km northeast of the Longxi section (N 34°56′, E 104°41′; 5.5–7.5°C, 400–600 mm). There is a climatic gradient from north to south with Chaoyang (9°C, 450–500 mm), Lingtai (9.1°C, 600 mm) and Baoji (13°C, 700 mm). The sections at Lingtai, Baoji, Wugong and Longxi are loess deposits on the Chinese Loess Plateau, and have been widely investigated as a continuous terrestrial palaeoclimate archive. The base rocks at Chaoyang are of Archean and Presinian age (Liaoning Geology Bureau, Hydrogeology Brigade 1983) and these underlie Paleozoic sedimentary rocks. The Paleozoic sedimentary rocks are mainly limestone and dolomite of Cambrian and Ordovician age (Liaoning Geology Bureau, Hydrogeology Brigade 1983). The Chaoyang section above these older formations originated as aeolian deposits (Chen et al. Reference Chen, Wang, Han and Wu2009b), with no pedogenic relationship with the underlying basal layer (Hu et al. Reference Hu, Wei, Du, Xu, Wang, Zhang, Ye and Zhu2010).
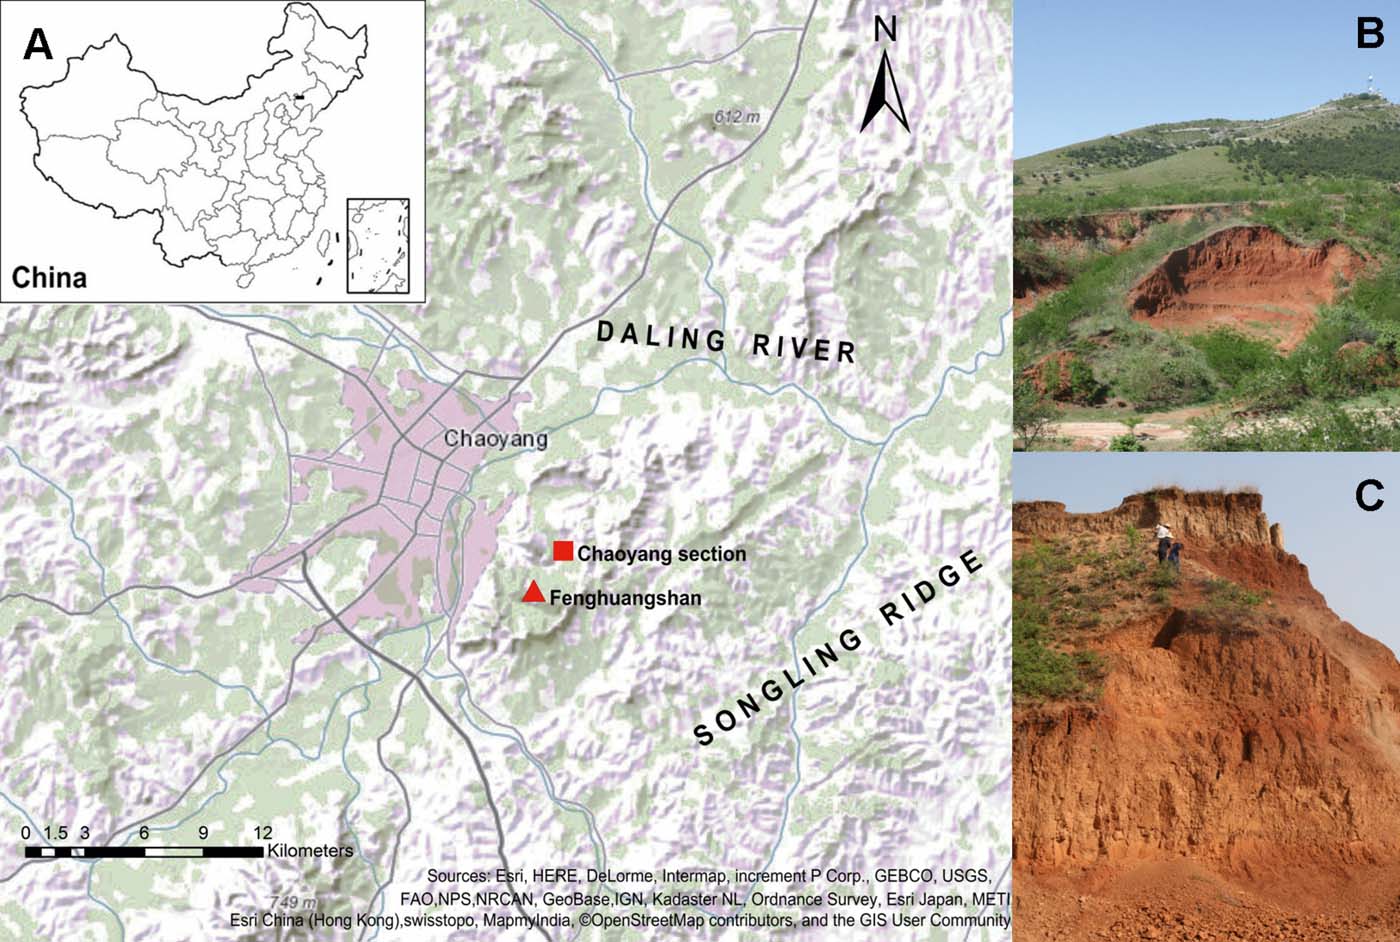
Figure 1 (A) Schematic map showing the location of the Chaoyang loess–palaeosol section. The black square on the inset map shows the location of Chaoyang in China. The schematic map was plotted using Arc GIS 10.2.2. (B) An image of the Chaoyang section and its associated landscape. (C) An image of the Chaoyang section.
The studied profile was in a closed basin of the Fenghuangshan area that occurs at a midpoint on the Song Ling Ridge in the hilly area of western Liaoning. It was close to the drainage divide and was not subject to water erosion (Fig. 1). The catchment area is also small, and does not display evidence of human impact or accelerated erosion (Liaoning Geology Bureau, Hydrogeology Brigade 1983). As a result, the section and the palaeosols are well preserved.
Field stratigraphic correlation was by Chen et al. (Reference Chen, Wang, Han and Wu2009b), based on widely applied stratigraphic markers for Chinese loess (Liu Reference Liu1985; Kukla Reference Kukla1987). The Chaoyang section consists of a 19.85 m-thick loess deposit, comprising five soil couplets with 42 genetic horizons, with no observed bottom boundary. Layer S0 is a modern soil formed during the Holocene. The loess–palaeosol sequence was numbered from top to bottom as L1, S1, L2, S2, L3, S3, L4, S4 and L5 (Fig. 2a), where L represents loess and S stands for palaeosol. Stratigraphic descriptions were provided by Chen et al. (Reference Chen, Wang, Han and Wu2009b) and 42 genetic horizons were described in detail by Sun et al. (Reference Sun, Owens, Han, Chen, Wang and Wang2016). In order to characterise the stratigraphy of the loess–palaeosol sequence, a Bartington susceptibility meter (MS2), equipped with a MS2F probe, was used to directly measure mass magnetic susceptibility of the whole section in the field, with a precision of 1–2 %. The face of the profile was cleaned to create a fresh and smooth surface. Then we gently used a probe to vertically contact the measured surface every 2 cm in triplicate, in order to calculate the average value of magnetic susceptibility for each depth. The magnetic susceptibility data illustrate boundaries that generally correlate with the lithologic changes as differentiated in the field. The palaeosols within the Chaoyang section can easily be recognised by peaks in the magnetic susceptibility curve and laboratory data, which show increases in the <2 μm grain size (Fig. 2b). During field examination, the S0 and L1 were considered to have been reworked by water. Therefore, the top 2 m should be interpreted with care (Chen et al. Reference Chen, Wang, Han and Wu2009b; Sun et al. Reference Sun, Owens, Han, Chen, Wang and Wang2016).

Figure 2 (a) Schematic logs of the stratigraphy with corresponding time constraints of the Chaoyang section. (b) The magnetic susceptibility and <2 μm grain size contents of the Chaoyang loess–palaeosol sequence.
The chronology of the Chaoyang section was dated by optically stimulated luminescence (OSL) and electron spin resonance dating (ESRD). Ten samples for dating were collected from the layer boundaries which were considered to be of significance. Samples were taken after dusk in order to avoid sunlight contamination. We removed a whole block of soil (about 500–1000 g) and immediately sealed it with aluminium foil, labelled the sample and placed it in a thick black plastic bag. The analysis was carried out in the State Seismological Bureau of China. There were no time reversal problems detected in the ten dating samples. After analysis, a chronology for the Chaoyang section was determined using ten reliable age controls, as interpolated from a susceptibility age model using the accumulation rate (Kukla & An Reference Kukla and An1989); the age–depth relationship for the Chaoyang section based on the age model of Kukla & An (Reference Kukla and An1989) is depicted in Figure 3. The dating results for the Chaoyang section correlate well with the loess sequence on the Chinese Loess Plateau (Chen Reference Chen2009). For example, the Lingtai section includes a loess formed during 0.039–0.071 Ma BP, which is consistent with the loess of L1 in the Chaoyang section.

Figure 3 A diagram showing the age–depth relationship for the Chaoyang section, based on the age model of Kukla & An (Reference Kukla and An1989).
Rare earth element (REE) concentrations of loess were measured using a Vista-MPX inductively coupled plasma atomic emission spectroscopy (ICP-AES) at Shenyang Agricultural University. A 100-mg sample powder was dissolved in a Teflon crucible, using HCl–HNO3–HF–HClO4. The standard reserve liquid from the China National Analysis Center for Iron and Steel was used to calibrate elemental concentrations in the samples. Analytical uncertainties involved in measurements are less than ±5 % for REEs.
Twenty-two loess and 20 palaeosol samples from different genetic horizons were collected for mineralogical analysis, which should correlate well with the time series. First, <2 μm clay fractions were separated from the bulk sample. Organic matter was oxidised in 5 % H2O2 solution and calcium carbonate was removed by 1 M sodium acetate (pH5). The clay fractions were then collected by repeated settling in deionised water. Secondly, free Al- and Fe-oxides from clay fractions were removed by dithionite–citrate–bicarbonate treatment (Mehra & Jackson Reference Mehra and Jackson1958) and centrifuging. Then, for mineralogical analysis, clay samples were (1) air-dried; (2) saturated with 0.5 M Mg2+; (3) saturated with 1 M K+; and (4) treated with 2 M HCl. After the clay treatments, oriented mounts were prepared as slurries on glass slides by smearing a clay paste onto a glass slide (Theisen & Harward Reference Theisen and Harward1962; Gibbs Reference Gibbs1965). The Mg solutions were evaluated in the air-dried state and then glycerol saturated at 25°C for 24 h (Mg-glycerol). The K-saturated samples were run in the air-dried state at 25°C for 24 h (K-25°C), heated to 300°C for 2 h (K-300°C), and then heated to 550°C for 2 h (K-550°C). The specimens were treated with 2 M HCl in an air-dried state at 80°C for 2 h. Rehydration was avoided by cooling the specimen in a desiccator. Finally, samples from different treatments, including Mg-glycerol, K-25°C, K-300°C, K-550°C and HCl-80°C, were examined respectively by a Bruker D8 X-ray Diffractometer, using CuKα radiation generated with 40 kV, 40 mA tube currents, and scanned from 2° (2θ) to 30° (2θ) at a scanning speed of 2° (2θ) min–1. The individual phyllosilicate minerals were identified by their basal reflection characteristics as listed in Table 1.
Table 1 X–ray diffraction characteristics of several major clay minerals (nm)

Notes, data were cited from Brown & Brindley (Reference Brown, Brindley, Brindley and Brown1980), Srodon & Eberl (Reference Srodon and Eberl1984), Thorez (Reference Thorez1976), Moore & Reynolds (Reference Moore and Reynolds1989), and Li (Reference Li1997).
For semi-quantitative analysis, the integrated characteristic peak areas of individual mineral reflections (Pai et al. Reference Pai, Wang, Wang and Houng1999) were converted into percentage relative abundances by using empirically estimated weighting factors (Reference Brindley, Brindley and BrownBrindley 1980). The relative quantities aid comparisons with other results.
2. Results
2.1. Clay mineralogy of the Chaoyang section
The clay mineral compositions of the Chaoyang section as a function of depth are plotted and listed in Figure 4. In general, illite (40–70 %) dominates the clay fraction, as compared to vermiculite (20–40 %), kaolinite (6–15 %) and chlorite (2–15 %), and minor amounts of smectite (0–10 %) occur throughout the entire section. The average weight percentages of clay minerals in the entire section are illite (45 %), vermiculite (38 %), chlorite (4 %), kaolinite (11 %) and smectite (2 %).

Figure 4 Mineralogy in weight percent of the clay fraction and the weight percent of <2 μm grain size fraction from the loess–palaeosol sequence of the Chaoyang section.
2.2. Trends in illite content
On average, the illite concentration (48 %) in the Chaoyang section is similar to that in the Lingtai section (49 %) and lower than the 66 % for the Baoji section in S1–L5. The illite contents in loess (L1–L5) and palaeosols (S0–S4) are 39 % and 53 %, respectively, which is similar to the abundance of illite in the Lingtai section (46 %, 51 %) (Gylesjö & Arnold Reference Gylesjö and Arnold2006), and also to the Longxi section (50–70 %) (Zheng Reference Zheng and Liu1982). However, the Chaoyang section has lesser amounts of illite when compared to the Baoji section (71 % loess, 63 % palaeosol) (Kalm et al. Reference Kalm, Rutter and Rokosh1996). On average, the illite concentrations of all layers in L2–L5, S1–S4 and L1 are around 47 %. The average illite contents in loess layers in L2–L5 and palaeosol layers in S1–S4 in the Chaoyang section are about 38 % and 61 %, respectively. The average illite content of L2–L5 loess in the Chaoyang section is similar to that in the Lingtai section, but significantly less than in the Baoji section (72 %). The S1–S4 palaeosol is similar to the Baoji section (63 %), but significantly greater than the Lingtai section (51 %).
Illite concentrations exhibit an increase throughout L5 to L2 and a decrease in palaeosols from S3 to S1 (Fig. 4). The S0 (20 %) has the lowest illite concentration when compared to the whole Chaoyang section. Lower illite concentrations were found for loess compared to palaeosols (except S0) in Chaoyang, and this difference is consistent with the Lingtai loess section during 0.039 to 0.423 Ma BP (Fig. 4). Variations in clay minerals can generally be noted around the transition between different units. As with the Lingtai section, there is a stepwise decrease in illite across the S1–L1 boundary (52–46 %), whereas the chlorite content increases. Also, in L1 the chlorite abundance exhibits the greatest average value. The S3 has the lowest average kaolinite concentration (8 %) within the whole Chaoyang section (Fig. 4). There is an increase in illite from L4 to S3 and there is a maximum of up to 77 % at S3. The same trends were observed in both the Lingtai and Baoji sections, where S3 has an illite content of around 50 %. These data indicate that S3 should be a key location for investigating the relationship between clay mineralogy and climate as reflected in temperature and precipitation. A significant increase in illite is shown in S0 across the Chaoyang (20 %), Lingtai (48 %) and Baoji (65 %) sections along the climate gradient, in accordance with the average illite concentrations in S1–L5.
2.3. Trends in chlorite
A significant decrease in chlorite is shown in S1–L5 and S0 in the Chaoyang (3.2 %, 4.3 %), Lingtai (2.3 %, 2.6 %) and Baoji (≤2 %, <1 %) sections. The average chlorite abundance in palaeosols of the Chaoyang section is about 4 %, which is only slightly greater than for loess (3.6 %). L1 has the greatest percentage of chlorite among the units; contrarily, S1–L5 contain the lowest on average, which is similar to the Lingtai and Baoji sections. Vermiculite concentrations in L1 exhibit an abrupt decrease from the initial layer S0 at about 40 %, whereas the chlorite content increases to approximately 30 % during the last 0.071 Ma BP. Similarly, Huang et al. (Reference Huang, Zhao, Li, Tan and Wang2012) found the same regular pattern in the Wugong section. However, there is a decrease to the lowest chlorite content in L4. There is a general trend, with an increase that is evident upwards in the section to the L2 loess.
2.4. Trends in smectite
Smectite was found in small amounts and with little change, varying from trace to less than 10 % throughout the section, and displaying a decrease to nearly zero in the palaeosol when compared to loess. For the Lingtai section, the value is similar to the Chaoyang section and is around 3 % for loess. An abrupt decrease was found from L2 to S1 in the Chaoyang section, and this pattern was also observed in both the Lingtai and Wugong sections.
2.5. Trends in kaolinite
The entire section shows little change in the relative proportions of kaolinite which ranges from 9 % to 15 % (Fig. 4) and is not more than 15 % for the Baoji (Kalm et al. Reference Kalm, Rutter and Rokosh1996), Heimugou (Zheng Reference Zheng and Liu1982) and Lingtai sections (Gylesjö & Arnold Reference Gylesjö and Arnold2006). The average quantities are slightly greater in palaeosols (12 %) than in loess (10 %). S1–L5 is characterised by approximately 3 % less kaolinite in loess than in palaeosols (Fig. 4). This trend coincides with the Baoji section. It is notable that the amounts of kaolinite in L1 and L2–L5 increase progressively in the Chaoyang, Lingtai and Baoji sections along the climate gradient, which parallels decreasing chlorite.
Figure 4 displays a greater amplitude in mineral phase variability; this can be generally observed within palaeosols compared to loess, with the largest and smallest amounts in S3 and L4 respectively. The characteristics of the detailed mineralogical distribution in the Chaoyang section in terms of illite and clay fraction show broadly the same trend, with different amplitudes in palaeosols and decreases in loess. Chlorite concentrations demonstrate a trend which is opposite to the illite trend (Fig. 4).
3. Discussion
3.1. Clay weathering
Four other lines of evidence support comparison of clay mineral trends. First, throughout the Chaoyang section, the rare earth element (REE) distribution patterns are very similar, including negative slopes where the main enrichment was found in Ce (Fig. 5). In Figure 5, the Eu–Lu curve is relatively smooth and the La–Eu curve is steep. The similar trends between the loess and palaeosols indicate they have similar provenance during the last 0.423 Ma BP. Analogous patterns can be observed with the REE distribution of the Linghui section (Feng et al. Reference Feng, Hu, Ju and Zhu2011) from the CLP. Although the source region is poorly known in detail, the Chaoyang section should be comparable with sections on the CLP. There should be no distinct alteration before loess deposition (Jeong et al. Reference Jeong, Hillier and Kemp2008). The S1 to L5 part of the Chaoyang section has typical properties for loess with a uniform parent material, in terms of field morphology, particle size distribution, geochemistry and micromorphology (Sun et al. Reference Sun, Owens, Han, Chen, Wang and Wang2016). Post deposition, the clay mineralogy changes were derived from weathering (Schaetzl & Anderson Reference Schaetzl and Anderson2005). Therefore, for this study it is assumed that the processes of pedogenesis are more important than the loess source. Secondly, the constituents of phyllosilicate minerals in the Chaoyang, Lingtai (Gylesjö & Arnold Reference Gylesjö and Arnold2006) and Baoji (Kalm et al. Reference Kalm, Rutter and Rokosh1996) sections are dominated by illite, with different abundances of chlorite, kaolinite and smectite throughout the profiles. These results accord with results from other loess–palaeosol research on the CLP, such as that on the Wugong section (Huang et al. Reference Huang, Zhao, Li, Tan and Wang2012). Thirdly, the loess source was completely mixed before final deposition, to form the rather uniform mineralogy (Jeong et al. Reference Jeong, Hillier and Kemp2011) with very little weathering occurring during transportation (Jeong et al. Reference Jeong, Hillier and Kemp2008). Fourthly, there are identical trends in magnetic susceptibility in the Chaoyang, Lingtai and Baoji sections. Thus, we can conclude that clay minerals from these sections are comparable.

Figure 5 Chondrite-normalised rare earth element patterns of the Chaoyang section. Data are cited from Chen et al. (Reference Chen, Wang and Han2009a). Abbreviations along the X axis: La = Lanthanum; Ce = Cerium; Pr = Praseodymium; Nd = Neodymium; Sm = Samarium; Eu = Europium; Gd = Gadolinium; Tb = Terbium; Dy = Dysprosium; Ho = Holmium; Er = Erbium; Tm = Thulium; Yb = Ytterbium; Lu = Lutetium. The symbols for different loess–palaeosol sections can be found in the Methods section and Figure 2.
In East Asia, the palaeoenvironmental changes were primarily controlled by the evolution of the East Asian monsoon (An Reference An2000). As a particular climate and soil environment are necessary for the formation or preservation of certain clay minerals (Folkoff & Meentemeyer Reference Folkoff and Meentemeyer1987; Amundson et al. Reference Amundson, Doner, Chadwick and Sowers1989; Velde Reference Velde2012), the major differences between the loess–palaeosol sequences are related to the mineralogical changes in phyllosilicate composition (Jeong et al. Reference Jeong, Hillier and Kemp2011) and are sensitive to environmental change to affect pedogenesis. Clay mineralogy is very much influenced by parent material under a specific bioclimate (Folkoff & Meentemeyer Reference Folkoff and Meentemeyer1985, Reference Folkoff and Meentemeyer1987). With increasing time, the ions in the parent material determine the potential for specific clay mineral formation. In this slow process, chemical weathering affects the soil mineralogy, subject to any constraints imposed by the climate. Environmental conditions can determine which clay mineral suites may develop. Therefore, clay mineralogy usually reflects climatic conditions (Arkley Reference Arkley1963, Reference Arkley1967; Van der Merwe & Weber Reference Van Der Merwe and Weber1963; Grim Reference Grim1968; Folkoff & Meentemeyer Reference Folkoff and Meentemeyer1987; Velde Reference Velde2012), but can also be modified by the biota (Schaetzl & Anderson Reference Schaetzl and Anderson2005). In a classic study on soil data for 99 US representative pedons by the National Soils Testing Laboratory in Lincoln, Nebraska, Fiskell & Perkins (Reference Fiskell and Perkins1970) and Folkoff & Meentemeyer (Reference Folkoff and Meentemeyer1987) used regression equations to demonstrate the strong link between clay mineralogy and climate. The primary link between clay minerals and environment is dependent on the leaching and weathering regimes (Beaven & Dumbleton Reference Beaven and Dumbleton1966; Rai & Lindsay Reference Rai and Lindsay1975). Increased leaching tends to decrease silica activity and increase weathering. In this region of China, leaching and weathering are primarily driven by monsoon-associated precipitation under a continental monsoonal climate. Temperature mainly affects the rate of the weathering, not the direction within a mineralogical suite (Rai & Lindsay Reference Rai and Lindsay1975; Li et al. Reference Li, Ji, Zhao, Mao and Chen2008). Precipitation and temperature are the main controls on seasonal leaching and drying in soils, also affected by clay mineralogy (Folkoff & Meentemeyer Reference Folkoff and Meentemeyer1985; Chadwick et al. Reference Chadwick, Nettleton and Staidl1995). In China, the magnitude of seasonal leaching and drying are closely associated with the East Asian monsoon climate, with distinct seasonal changes in precipitation and air temperature between cold-dry (winter monsoon) and hot-humid (summer monsoon) (Ding & Yu Reference Ding and Yu1995; An Reference An2000). Thus, variations in phyllosilicate composition in loess–palaeosol sequences can be used to infer temporal and spatial changes in mineral evolution and the strength of the summer/winter monsoon.
3.2. The evolution of clay minerals
As has been demonstrated by other researchers (Table 2), smectite prevails in areas with poor drainage in temperate soils (Dixon & Weed Reference Dixon and Weed1989); whereas illite commonly dominates in cold climate soils (White & Blum Reference White and Blum1995; Velde & Meunier Reference Velde and Meunier2008). Chlorite can be relatively unstable and easily changed under intense precipitation (Chadwick et al. Reference Chadwick, Gavenda, Kelly, Ziegler, Olson, Elliott and Hendricks2003; Velde & Meunier Reference Velde and Meunier2008). Kaolinite can form under intense weathering in warm and moist environments, and is common in areas with subtropical or tropical climates (Dixon & Weed Reference Dixon and Weed1989; White & Blum Reference White and Blum1995). Vermiculite is a fast-forming and unstable intermediate mineral which is derived initially from mica and can be transformed to form smectite or other minerals, depending on the environment (Wilson Reference Wilson1999; Velde & Meunier Reference Velde and Meunier2008). Therefore, palaeosols formed under a warm and humid climate should contain smaller amounts of chlorite and greater amounts of illite and kaolinite.
Table 2 General relationships between clay types and climatic conditions

Illite is generally the most common mineral in the Chaoyang section, as well as at Lingtai and Baoji, which indicates that weathering has had a marked effect on illite content (Gylesjö & Arnold Reference Gylesjö and Arnold2006). The phyllosilicate composition does exhibit some differences between loess and palaeosols. The average illite content is higher in palaeosols as compared to loess. The most developed soil, as expressed in degree of weathering, has the greatest illite content; as in the Lingtai and Baoji sections, but also for the S3 palaeosol in the Chaoyang section. This, together with the relatively lower abundances of chlorite in palaeosols, may indicate that weathering mainly associates with illite through pedogenesis (Kalm et al. Reference Kalm, Rutter and Rokosh1996). Thus, palaeosols with an average illite content of 61 % have experienced more intensive mineral weathering under a humid-warm climate than loess (38 %) during 0–0.423 Ma BP. At a large scale, there is an increased illite content from north to south, when the three loess sections at Chaoyang (48 %), Lingtai (49 %) (Gylesjö & Arnold Reference Gylesjö and Arnold2006) and Baoji (66 %) (Kalm et al. Reference Kalm, Rutter and Rokosh1996) are compared. The differences in illite from north to south indicate a trend of increased weathering.
Lower abundances of smectite were detected in the palaeosol when compared to the loess, and an abrupt decrease is exhibited from L2 to S1, as well as in the Lingtai and Wugong sections, during the last 0.423 Ma BP. This is likely due to the high permeability in most aeolian sediments that favours leaching of secondary minerals and chemical weathering (Chamley Reference Chamley1989). This difference may be triggered by an increase in base cation leaching (Borchardt Reference Borchardt, Dixon and Weed1989), due to the increased precipitation in S1. The difference coincides with the increase in vermiculite in S1, whose formation is favoured due to the interlayer K+ cations that are removed from mica by increased leaching (Folkoff & Meentemeyer Reference Folkoff and Meentemeyer1987). This means that loess formed under a dry climate has been subject to less leaching, whereas a palaeosol formed under a wet climate has had greater leaching (Beaven & Dumbleton Reference Beaven and Dumbleton1966; Birkeland Reference Birkeland1969; Ojanuga Reference Ojanuga1979).
S3 has a striking colour difference and has likely been subjected to relatively strong pedogenesis (Sun et al. Reference Sun, Owens, Han, Chen, Wang and Wang2016). Contrary to expectations, the kaolinite contents were the lowest in S3, which is one of the most developed layers in the Chaoyang section, and displays the same pattern in the Lingtai (Gylesjö & Arnold Reference Gylesjö and Arnold2006) and Baoji sections (Kalm et al. Reference Kalm, Rutter and Rokosh1996). An opposite trend can be observed in the clay content with depth (Fig. 4). The reason is that the constant addition of aeolian dust with high base saturation materials has restricted palaeosol weathering intensity over time (Sun et al. Reference Sun, Owens, Han, Chen, Wang and Wang2016). Weathering contributes greatly to differences in illite content. Further weathering of soil material was suppressed, due to the maintainance of high base saturation conditions for the constant addition of aeolian dust. Changes in source area mineralogy may play a more important role in the variability of kaolinite in S3 during 0.225–0.243 Ma BP than do changes in pedogenesis.
S0 shows the lowest illite concentration in the whole Chaoyang section and displays significantly less vermiculite. This may be due to an effect of water redistribution on the surface creating a dissimilar and altered parent material. Chen et al. (Reference Chen, Wang, Han and Wu2009b) suggest that S0 has experienced some secondary reworking by local slope processes, including transportation by water during the Holocene. The dominant grain size fraction is 10–50 μm, which is common in aeolian loess. However, a fluctuating and relatively large content of coarse size sands, together with a larger median size, indicates greater transport energy which exceeds the limits of aeolian wind speeds for loess deposits (Liu Reference Liu1985; Sun et al. Reference Sun, Lu, Rea and Sun2000). Hence, the absolute concentrations of illite probably changed substantially along with the introduction of the coarse size fraction. This would explain the relatively lower percentage of illite in the clay fractions of S0. Although the absolute content of illite was less in S0 than its actual value, the relative content in clay changed little, because the amount of total phyllosilicates was relatively low. Therefore, the trends and variations in illite within the different sections must be evaluated in the context of other data and our understanding of depositional processes.
L4 has the least illite content, and one of the greatest smectite concentrations and lowest chlorite abundance. The trend for more illite in cooler wetter climates may be used to infer that L4 has been subject to weak leaching and weathering, as well as cold-dry conditions; therefore, L4 may represent one of the coldest and driest periods during the last 0.423 Ma BP. We can infer that interlayer K+ was extracted from the unit structure of mica as the soil was becoming very dry (Scott & Smith Reference Scott and Smith1968), which created conditions for the greatest vermiculite content within the drier climate. As there is a weak relationship between chlorite content and climate (Folkoff & Meentemeyer Reference Folkoff and Meentemeyer1987), the lowest concentration of chlorite present here is limited to the L4 that was weakly developed loess and commonly formed in cooler climates (Gao & Chen Reference Gao and Chen1983; Yemane et al. Reference Yemane, Kahr and Kelts1996).
From L4 to S4, the illite content increases from 34 % (L4) to 66 % (S4). The trend in illite in S4 first decreases, then increases and, finally, decreases (Fig. 4). This suggests that the weathering environment, including temperature and precipitation conditions, changed during 0.311–0.243 Ma BP of S4 formation. This accords with Wang & Zheng (Reference Wang and Zheng1989), in that a dry environment alternating with periods of moist conditions can be inferred from the illite content within the range 65–80 %.
In summary as shown in Figure 6, the palaeosols correlate with a strengthened summer monsoon, whereas the loess correlates with a strengthened winter monsoon. This suggests that the 0.225–0.243 Ma BP period was characterised by the strongest summer monsoon, whereas 0.243–0.311 Ma BP had the strongest winter monsoon. The climate was warm and wet at the following stages: 0.071–0.159 Ma BP, 0.176–0.208 Ma BP, 0.225–0.243 Ma BP and 0.311–0.403 Ma BP; and the climate was cold and dry at the following stages: 0.159–0.176 Ma BP, 0.208–0.225 Ma BP, 0.243–0.311 Ma BP and 0.403–0.423 Ma BP.

Figure 6 The trends in regional monsoon climate variability and change in the Chaoyang section, obtained from integrating data of clay using a time series with a moving average. The continuous line is the smoothed data using a moving average function. Here, the I/C (illite/chlorite) ratio model was employed as an integrated index to evaluate the monsoon influence (Chamley Reference Chamley1989; Zhao Reference Zhao2005). SM = summer monsoon influence; WM = winter monsoon strength.
3.3. Magnetic susceptibility and grain size related to clay mineralogy
Magnetic susceptibility can serve as an important environmental proxy for pedogenic intensity in aeolian deposits and changes in the East Asian summer monsoon throughout the Quaternary (Zhou et al. Reference Zhou, Oldfield, Wintle, Robinson and Wang1990; An et al. Reference An, Kukla, Porter and Xiao1991a; Maher & Thompson Reference Maher and Thompson1991). Greater magnetic susceptibility values can indicate a stronger summer monsoonal influence (Ding & Yu Reference Ding and Yu1995). Research on the grain size features of the loess–palaeosol sequence has shown that greater amounts of the coarse fraction and a coarser median grain size are generally the result of a stronger Asian winter monsoon (Liu Reference Liu1985; An et al. Reference An, Kukla, Porter and Xiao1991a; Xiao et al. Reference Xiao, Zheng and Zhao1992; Ding et al. Reference Ding, Yu, Rutter and Liu1994; Zhang et al. Reference Zhang, An, Chen, Zhang, Arimoto and Ray1994; An & Porter Reference An and Porter1997; Lu & An Reference Lu and An1998). Consequently, grain size parameters (Ding et al. Reference Ding, Derbyshire, Yang, Yu, Xiong and Liu2002), such as mean or median grain size, can be used as proxy indicators to reconstruct variations in the influence of the winter monsoon (Vandenberghe et al. Reference Vandenberghe, An, Nugteren, Lu and Van Huissteden1997). Interpretations of a stronger influence of the winter monsoon can be based on coarser median grain size and mean grain size.
As shown in Figure 7, changes in clay minerals correlate well with the variations in magnetic susceptibility, median grain size and mean grain size suggestive of pedogenic cycles. Variations in clay minerals reflect a series of monsoonal changes, which are also reflected in both grain size distribution and magnetic susceptibility. Fluctuations in the intensity of the East Asian winter and summer monsoons are expressed in a shift in the same phase between grain size and magnetic susceptibility. Lesser values of magnetic susceptibility, and of the I/C ratio and a coarser median and mean grain size, were detected in loess. On the other hand, greater values of magnetic susceptibility and of the I/C ratio and a finer median and mean grain size were observed in palaeosols (Fig. 7). The fluctuations in the loess–palaeosol sequence at Chaoyang show the same trends as at Lingtai, which suggests strong winter monsoons alternating with strong summer monsoons.

Figure 7 Variations in clay minerals compared to mean grain size, median grain size and magnetic susceptibility data in the Chaoyang loess–palaeosol sequence. The section above 2 m was reworked by water.
3.4. Trends in the monsoon climate
From the base of L5 to the base of S4 there is (1) a decrease in illite; (2) an increase in smectite and chlorite; and (3) an increase in illite and a decrease of chlorite. The same trends can be observed in clay but are much less than in S4 (Fig. 4). The trend in clay in L5 indicates that the winter monsoon influence became stronger during the period characterised by decreases in illite, and then an increasing summer monsoon influence occurred towards the base of S4, during the period characterised by increased illite in L5. But the period of 0.423–0.403 Ma BP was still mainly controlled by the winter monsoon climate. The L5 formation period of 0.423–0.403 Ma BP correlates well to MIS12, with an increasing ice volume reflected both in the SPECMAP δ18O curve (Imbrie et al. Reference Imbrie, Hays, Martinson, Mcintyre, Mix, Morley, Pisias, Prell, Shackleton, Berger, Imbrie, Hays, Kukla and Saltzman1984) and the LR04 δ18O curve (Lisiecki & Raymo Reference Lisiecki and Raymo2005) (Fig. 8).

Figure 8 General clay mineral trends in the Chaoyang section and correlation with LR04 δ18O (‰) records from Lisiecki & Raymo (Reference Lisiecki and Raymo2005) and SPECMAP δ18O records (Martinson et al. Reference Martinson, Pisias, Hays, Imbrie, Moore and Shackleton1987). The figures of LR04 δ18O (‰) and SPECMAP δ18O were obtained from a figure which was cited from Ding & Yu (Reference Ding and Yu1995).
In the S4–L4 portion of the Chaoyang section, clay, illite and kaolinite concentrations decrease between S4 and the overlying L4 unit (Fig. 4). L4 is represented by the least illite concentration and one of the least kaolinite concentrations which, as one of the most stable phyllosilicates, is often used as an indicator of weathering (Bühmann Reference Bühmann1994).
The strength of winter and summer monsoons shifts synchronously (Liu & Ding Reference Liu and Ding1992; An & Porter Reference An and Porter1997). This suggests that weaker weathering, triggered by climatic deterioration with a weak summer monsoon and a strong winter monsoon, occurred during 0.311 to 0.243 Ma BP. The occurrence of the greatest amount of coarse grains (19.9–52.6 μm) and least amount of super-fine grains (0.5–1.0 μm) (Chen et al. Reference Chen, Wang and Han2009a) can indicate the winter monsoon influence and summer monsoon strength, respectively (Liu & Ding Reference Liu and Ding1998).
The general trends in clay content of L4 parallel those of MIS8, both in the SPECMAP δ18O (Imbrie et al. Reference Imbrie, Hays, Martinson, Mcintyre, Mix, Morley, Pisias, Prell, Shackleton, Berger, Imbrie, Hays, Kukla and Saltzman1984) and the LR04 δ18O curves (Lisiecki & Raymo Reference Lisiecki and Raymo2005) (Fig. 8), which indicates a larger oceanic ice volume and, also, significant cold weather at the global scale. From 0.423 to 0.243 Ma BP, the summer monsoon influence decreased and the winter monsoon grew stronger to peak at L4, coinciding with the increasing percentage of coarse grains.
The section from the top of L4 to the top of S3 (0.243–0.225 Ma BP) is characterised by an increase in illite to a maximum of around 77 % at S3 in the entire Chaoyang section; the same trend described in the Lingtai and Baoji sections during the last 0.423 Ma BP. Changes in the illite content within 65–80 % imply that periods of a dry environment alternated with periods of moist conditions (Wang & Zheng Reference Wang and Zheng1989). In S3 of the Chaoyang section, there is only one clearly defined soil. This is because of the small accumulation rate and, thus, Chaoyang appears to reflect a shorter period under a sub wet-dry-climate during 0.243–0.225 Ma BP. The summer monsoon influence grew more marked as the illite content increases to the maximum at S3, followed by a substantial increase in the clay coincident with an increase in fine grain sizes (Chen et al. Reference Chen, Wang and Han2009a). This correlates with the oxygen isotopic data from deep-sea records of MIS7, both in the SPECMAP δ18O curve and in the LR04 curve (Fig. 8).
From the top of S3 to the base of S1, another decrease in illite is accompanied by a significant decrease in the concentrations of vermiculite and an increase in chlorite, together with a decrease in concentrations of clay (Fig. 4). This illustrates that there is also a decrease in the summer monsoon strength and an increase in the winter monsoon influence. This is consistent with the decrease in the abundance of coarse grains (as an indicator of the winter monsoon) and the increase in super-fine grains (as an indicator of the summer monsoon), which matches well with MIS7 and MIS6 (Fig. 8).
The relatively thick S1 has an increased illite, kaolinite and smectite contents, with a smaller chlorite concentration. This provides evidence for a major shift from a cold to a mild continental climate from L2 to S1, which coincides with the changes in concentrations of coarse and super-fine grains. These observations suggest a stronger summer monsoon. Palaeosol S1 interbedded between L1 and L2 is consistent with a period of relatively mild climate during 0.159–0.071 Ma BP. However, there is a relative increase in smectite in L1 and L2, which illustrates that the presence of greater amounts of K, Na and an increased pH could be needed to promote smectite genesis (Wilson Reference Wilson, Schultz, Van Holphen and Mumpton1987; Pickering Reference Pickering1986). The mean annual temperature and the mean annual precipitation were reported as greater than 9.1°C and 600 mm respectively, should a summer monsoon have occurred between 0.159 and 0.071 Ma BP (S1), with a temperature and precipitation that exceeded that of the modern climates of the Lingtai section (N 35°00′75″, E 107°30′33″; 9.1°C, 600 mm) and of the Baoji section (N 34°24′, E 107°18′; 13°C, 700 mm).
A major change occurs in the Chaoyang section in terms of mineralogy across S1–L5 to the L1 boundary around 0.071 Ma BP. From the boundary of S1 to L1, there is a significant decrease in illite and clay, whilst an increase in chlorite also can be observed. This illustrates a stronger winter than summer monsoonal influence, which is consistent with grain size characteristics, and may correspond to MIS5/4. Rousseau & Kukla (Reference Rousseau and Kukla2000) and Gylesjö & Arnold (Reference Gylesjö and Arnold2006) also conclude that there was a weaker summer monsoon at the boundary across S1 to L1 at 0.071 Ma BP.
Palaeosols S4–S1 have greater average illite and kaolinite amounts than L2–L5 loess. This may reflect increased weathering contributing to the illite abundance under a stronger summer monsoon influence within S4–S1. The same trends were observed by Ding et al. (Reference Ding, Xiong, Sun, Yang, Gu and Liu1999) and Gylesjö & Arnold (Reference Gylesjö and Arnold2006). Since chlorite is unstable in soils, the increased chlorite content can imply a decrease in weathering intensity (Righi et al. Reference Righi, Velde and Meunier1995). But sometimes the average chlorite abundances and smectite contents do not correlate well with the trends in illite, magnetic susceptibility and grain size. Variations in source mineralogy are sometimes more important than pedogenesis in explaining chlorite content, as also proposed by Gylesjö & Arnold (Reference Gylesjö and Arnold2006) for the Lingtai section. An increase in chlorite, as well as an increase in coarse grains, suggests that the wind speed during the winter monsoon had a greater intensity. The average chlorite abundance within S1–L5 in the Chaoyang section is greater than at Lingtai and Baoji, suggesting a drier environment at Chaoyang.
3.5. Determining the specific position for S3 over the last 2.6 Ma BP
Since clay mineral data should not be used on their own, magnetic susceptibility and median grain size data are also considered, in order to propose the position of the summer monsoon during 0.225–0.243 Ma BP. In Figure 9, magnetic susceptibility and median grain size in the Chaoyang section agree very well with the Lingtai section. As discussed above, S3 was characterised by clay mineral features as the strongest summer monsoon in the last 0.423 Ma BP, and indicates some possibilities for its position during the last 2.6 Ma BP. In general, the largest amplitude in variation can be observed around S3 at Chaoyang, as well as at Lingtai, and seems to correlate well with the lowest peak in the time series of median grain size, the highest magnetic susceptibility (Fig. 9), illite abundances (Fig. 4) and the I/C ratio (Fig. 7).

Figure 9 Median grain size and magnetic susceptibility in the Chaoyang section (a, b) corresponded to general trends in the Lingtai section (c, d). (c) and (d) were obtained from a figure cited from Gylesjö & Arnold (Reference Gylesjö and Arnold2006).
This also can imply that the strongest summer monsoon occurred in S3 in the last 0.423 Ma BP, coinciding with Lingtai. Ding et al. (Reference Ding, Xiong, Sun, Yang, Gu and Liu1999) determined that the strongest summer monsoon occurred in the last 0.48 Ma BP, on the basis of the pedogenic characteristics in the last 2.6 Ma BP. Through comparison with the median grain size and magnetic susceptibility data from Lingtai (Fig. 9), we can propose that one of the strongest summer monsoons during the last 2.6 Ma BP was during 0.225–0.243 Ma BP.
Some mineral differences may be due to local factors such as temperature and moisture in the same period. Even in modern soil, these differences can be observed. The general trends in the mineralogical changes closely correlate with the climatic trends, as determined using CLP loess–palaeosol sequences and ice volume features in oxygen isotopes from deep-sea records. This implies that the Chaoyang section provides a detailed record of palaeoclimate change in northeast China.
4. Conclusions
1. The clay mineralogy in the Chaoyang section records the development of the loess–palaeosol sequence. In the Chaoyang section, illite (40–70 %) dominates the clay fraction, as compared to vermiculite (20–40 %), kaolinite (6–15 %) and chlorite (2–15 %), with minor amounts of smectite (0–10 %) throughout the entire section. A greater variability can be generally observed within palaeosols as compared to loess, with the largest and smallest amounts of different minerals in S3 and L4 respectively. The increase in pedogenic processes, or the lack of pedogenic processes, strongly controlled illite evolution. In general, the palaeosols contain more illite, total clay and kaolinite, together with less chlorite than in the loess. The variations in phyllosilicate composition of loess–palaeosol sequences indicate temporal and spatial changes in mineral evolution and the strength of the summer/winter monsoon. Of course, there were potential influences from the local environment; but, nevertheless, we observed differences in mineral variation for the period 0–0.071 Ma BP, despite different thicknesses of the lithologic units among the Chaoyang, Lingtai and Baoji sections. However, the general trends of mineralogical changes are synchronous with the distinctive mineralogical trends in the CLP.
2. Based on the mineralogical composition and the clay content of each horizon in the Chaoyang section, the paleoclimate changes over the last 0.423 Ma BP in the Chaoyang area can be summarised. From 0.423 Ma BP to 0.243 Ma BP, the summer monsoon influence decreased and the winter monsoon grew stronger. The strongest winter monsoon was found to occur during 0.311–0.243 Ma BP. Between 0.243 Ma BP and 0.225 Ma BP, the strength of the summer monsoon started to increase again, which was one of the strongest summer monsoons in the last 2.6 Ma BP. From 0.225 Ma BP to 0.071 Ma BP, a decrease in the summer monsoon strength and an increase in the winter monsoon influence occurred. At 0.071 Ma BP, the summer monsoon strength decreased.
3. The reconstruction of the palaeoclimate, based on the Chaoyang section and using the clay mineral proxy, accords with proxies including magnetic susceptibility, median grain size and mean grain size, and has a very high similarity to the glacial–interglacial cycles, as reflected in the marine δ18O records as well as in the loess-palaeosol sections in the CLP. These relationships further suggest that the Chaoyang section provides a record for global climate changes. Palaeoclimate variations as recorded in the Chaoyang section complement records from the CLP and contribute significantly to a better understanding of global paleoclimate changes during the Late Middle Pleistocene.
5. Acknowledgments
The authors sincerely thank Professor Donald Davidson, University of Stirling, UK, for reviewing an earlier version of the paper; Martha R. Winters at Purdue University, USA, for language help; and all the students and staff who provided their input to this study. Thanks also go to the National Natural Science Foundation of China (No. 40971124 and No. 41371223) and the China Scholarship Council (201408210121 and 201508210201) for funding this project. Our acknowledgements also extended to the two anonymous reviewers for their constructive reviews of the manuscript.


