Introduction
Imprinted genes are a small subset of about 0.3% of the transcribed human genome and are uniquely monoallelically expressed according to the parent-of-origin. Imprinted genes are key regulators of fetoplacental development.Reference Bressan, De Bem and Perecin 1 – Reference Lambertini, Marsit and Sharma 5 Accordingly, the expression of over 70% of imprinted genes can be detected in the placenta.Reference Court, Tayama and Romanelli 3
The placenta is the key organ that supports and drives embryonic development by providing the environment for fetal growth, coordinating the different phases of embryogenesis and serving as the interface for maternal–fetal interactions.Reference Wolpert, Tickle and Lawrence 6 The placenta is a very dynamic organ that undergoes constant phenotypic and morphological changes over the course of gestation.Reference Hu and Cross 7 Such plasticity is largely driven by the unique set-up and function of imprinted genes.Reference Perry, Lins, Lobie and Mitchell 8 , Reference Schroeder, Blair and Lott 9
Imprinted genes have been extensively studied for their functions and accordingly classified in three main groups including (1) placental genes that control allocation of maternal resources to the fetus, (2) fetal genes that regulate newborn metabolism in the early postnatal period and (3) placental/fetal genes that prenatally determine the metabolism of fetal metabolism-setting organs such as the pancreas, muscle, fat cells and the hypothalamus.Reference Bressan, De Bem and Perecin 1 , Reference Charalambous, da Rocha and Ferguson-Smith 2 Imprinted genes are also characterized by low placental transcriptional noiseReference Kappil, Green and Armstrong 4 suggesting tight regulatory control. Disruptions of the expression profile of low transcriptional noise genesReference Newman, Ghaemmaghami and Ihmels 10 , Reference Zaitoun, Downs, Rosa and Khatib 11 have been associated with increased likelihood of affecting the phenotypeReference Kaern, Elston, Blake and Collins 12 , Reference Sanchez, Choubey and Kondev 13 and even determine lethality.Reference Blake, Kaern, Cantor and Collins 14 , Reference Fraser, Hirsh, Giaever, Kumm and Eisen 15 Together with their low transcriptional noise, the constitutional haplo-insufficiency of imprinted genes further highlights the potential role of the fine control of their expression on impacting the phenotype.Reference Ruiz, Lopez-Contreras and Gabut 16
We previously showed that alterations of placental imprinted gene expression were associated with suboptimal perinatal growthReference Kappil, Green and Armstrong 4 and responded to environmental stimuli, including both chemical exposuresReference Kappil, Li and Li 17 and socio-economical determinants.Reference Chen, Li and Rialdi 18 Among the different socio-economical determinants, maternal psychosocial stress during pregnancy (MPSP) has been shown to affect fetal growth and lead to suboptimal birthweight supporting the formulation of what is today known as the developmental origin of health and disease (DOHaD) theory.Reference Grote, Bridge and Gavin 19 – Reference O'Donnell and Meaney 21
This extensive body of knowledge suggests a possible role of imprinted gene expression in the placenta in mediating the effects of MPSP on fetal growth. In this study, we set out to test this hypothesis in a well-characterized birth cohort, the Stress in Pregnancy (SIP) Study. The SIP study, which builts an extensive placenta biobank, aims at examining the influence of in utero exposure to MPSP on infant growth, temperament and neurodevelopment.Reference Finik and Nomura 22
Material and methods
The SIP study population
The SIP study enrolls pregnant women at Icahn School of Medicine at Mount Sinai and New York Presbyterian Queens, as previously described (see http://sipstudy.com and ref Reference Finik and Nomura22 for additional information). The current study includes the subsample of the SIP study cohort with stored placentas tissues that were collected at delivery from enrolled mothers (n = 341) and later underwent imprinted gene expression analysis at our laboratories. For 273 of the 341 samples, tested data on MPSP and infant birthweight were available for the current analysis.
The MPSP analysis provided additional data on maternal ethnicity, education, marital status and age. Birth-related information was collected by medical chart abstraction and included, among others, gestational age at birth, infant gender and birthweight.
Scores of MPSP
MPSP determination was based on a battery of self-administered questionnaires from all pregnant mothers enrolled by the SIP study. MPSP questionnaires included the Edinburgh Postnatal Depression Scale (EPDS), the Pregnancy Related Anxiety (PRAQ-R), the Perceived Stress Scale (PSS-14), the State/Trait Anxiety (STAI) and the Psychiatric Epidemiology Research Interview Life Events Scale (LES). These validate and widely used MPSP tests measures, respectively: prenatal depression, pregnancy related anxiety, perceived stress during pregnancy, state/trait anxiety during pregnancy and negative stressful events during pregnancy.
MPSP was computed as previously described.Reference Zhang, Li and Deyssenroth 23 Briefly, MPSP was determined by scoring the normative psychosocial stress during pregnancy categorized into a composite latent measure using latent profile analysis by Mplus (available at https://www.statmodel.com). This method yielded three maternal stress classes that were named low, moderate and high MPSP. A summary of the MPSP scores for the samples analyzed here can be found in Table S1.
Placental tissue collection and RNA isolation
Placentas were sampled by excising one full-thickness cylindrically shaped biopsy from each of the four placenta quadrants midway from the cord insertion and the placental rim, within 2 h from the delivery. Biopsies were processed by removing the maternal decidua and fetal membranes and abundantly washing the tissue in cold (4°C) sterile phosphate-buffered saline. Biopsies were then blotted dry, snap-frozen in liquid nitrogen and stored at −80°C.
RNA extraction was carried out by first grinding frozen tissue in a liquid nitrogen-cooled mortar. Pulverized tissue was then processed for RNA extraction with RNeasy Plus Minikit (Qiagen, Valencia, CA, USA), quantified with Nanodrop spectrophotometer (Thermo Electron North America, Madison, WI, USA) and stored at −80°C.
Imprinted gene expression profiling
Placental RNA was profiled using a custom-designed code set (Nanostring Technologies, Seattle, WA, USA) as previously described.Reference Kappil, Green and Armstrong 4 , Reference Green, Kappil and Lambertini 24 Briefly, 100 ng RNA was incubated in the presence of reporter and capture probes overnight at 65°C. Following hybridization, unbound probes were removed, and the purified complexes were aligned and immobilized on imaging cartridges using an nCounter Prep station. Cartridges were then sealed and scanned in an nCounter Digital Analyzer for code count detection.
Statistical analysis
All statistical analyses were conducted using R 3.0.2. 25 Gene expression data were handled as previously described.Reference Kappil, Green and Armstrong 4 Briefly, the NanoString ‘Norm’ R packageReference Waggott 26 was used to normalize nCounter data. Specifically, raw nCounter code counts were first normalized against the geometric mean of spike-in controls to account for differences in hybridization and recovery. Differences in sample content were accounted for by normalizing the data against the geometric mean of standard housekeeping genes (GAPDH, RPL19 and RPLP0). Finally, the background threshold of detection was set at the value of the limit of detection divided by the square root of 2 to maintain sample variability. Genes where more than 50% of the samples fell below the limit of detection were considered unexpressed.
We devised our analysis as follows: (1) we assessed the correlation between MPSP classes and birthweight by analysis of variance test as a preliminary step that allows conducting the mediation analysis; (2) we identified genes differentially expressed by MPSP category by using the Linear Models for Microarray (LIMMA) R package, which employs an empirical Bayes method to fit linear models for each gene in the data set with a moderated standard error, generating a moderated F-statistic; (3) we assessed the relationships among imprinted gene expression and birthweight by using Pearson’s correlation; and (4) we conducted the mediation analysis by using the ‘mediation’ R package limited to those imprinted genes that were associated with both MPSP and birthweight.
We also conducted a factor analysis to provide additional validity to our findings. We replaced individual genes in the statistical workflow outlined above with gene clusters generated using the ‘psych’ R package. We used the scree plots generated by the ‘nFactor’ R package to determine the number of factors underlying the data. Correlation plots were generated using the ‘corrplot’ R package.
Gene network analysis
Lists of imprinted genes found associated with MPSP and birthweight were separately fed to the Ingenuity Pathway Analysis (IPA) online engine for the analysis of ‘omics data (available at: https://www.qiagenbioinformatics.com/products/ingenuity-pathway-analysis/). By using the commonly available set-ups of IPA for network analyses, 70-gene networks were generated for both MPSP and birthweight gene sets. A comparative IPA was also conducted comparing the results of the MPSP and birthweight individual analyses.
Results
Population demographics and characteristics of the variables analyzed are presented in Table 1. Covariates distribution is similar between the 273 samples with data on MPSP and infant birthweight and the full cohort of placenta samples from the SIP study (Table 1).
Table 1 Stress in Pregnancy study cohort demographics

GED, general educational development.
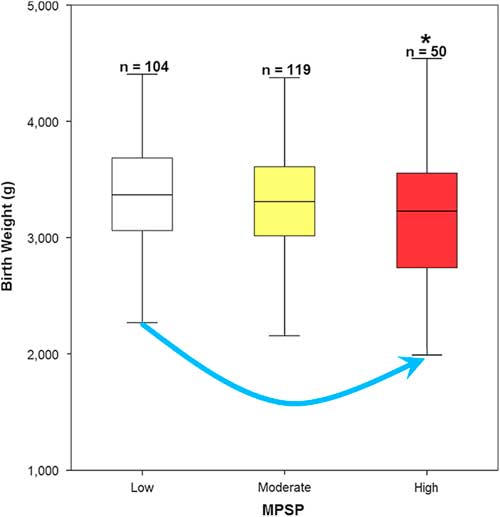
The subdivision of the cohort in low, moderate and high MPSP according to the MPSP questionnaires administered to mothers during pregnancy yielded three classes of, respectively, 104 low, 119 moderate and 50 high MPSP mothers (Table S1). A statistically significant negative correlation between MPSP and birthweight was detected between the low and high MPSP classes (Fig. 1 and Table S2). A non-significant trend was also observed suggesting a birthweight decrease with increasing MPSP (Fig. 1).

Fig. 1 Correlation between maternal psychosocial stress during pregnancy (MPSP) Classes and Birthweight. A statistically significant negative association was detected for birthweight between the high and low MPSP classes. A non-significant negative trend can also be observed with birthweight decreasing as MPSP increases. See Tables S1 and S2 for additional details.
We analyzed the expression of a panel of 109 imprinted genes (Table S3). The imprinted gene expression profile generated was comparable to those that we obtained from other placenta cohorts.Reference Kappil, Green and Armstrong 4 , Reference Green, Kappil and Lambertini 24 Similar distributions were detected for the 10 highest expressed imprinted genes (Figure S1) and the imprinted genes were removed from the analysis (16 genes) because of a detectable expression limited to <50% of the samples (Table S3). Additional investigations also showed that the distribution of the removed imprinted genes did not differ among the three MPSP classes and was not correlated to birthweight (Figures S2 and S3).
A total of 23 imprinted genes were found differentially expressed in pairwise comparisons between the three MPSP classes (Fig. 2). Of those 23 genes, eight genes showed significant higher expression in the high MPSP class v. both low and moderate MPSP classes (group I); five returned significant higher expression in the high v. low MPSP class (group II); seven had significant higher expression in the high v. moderate MPSP class (group III);two had significant higher expression in the low v. moderate MPSP class (group IV); and one imprinted gene had significant higher expression in the moderate v. both low and high MPSP classes (group V) (Fig. 2b and Tables S4 and S5).

Fig. 2 Maternal psychosocial stress during pregnancy (MPSP) statistical analysis. A total of 23 imprinted genes were found associated with the different MPSP classes. (a) Venn diagram for the distribution of the significant imprinted genes across MPSP classes. (b) Breakdown of the imprinted genes associated with MPSP classes according to their significant differential expression. Color coding expresses the change in log2 gene expression. See Tables S4 and S5 for additional details.
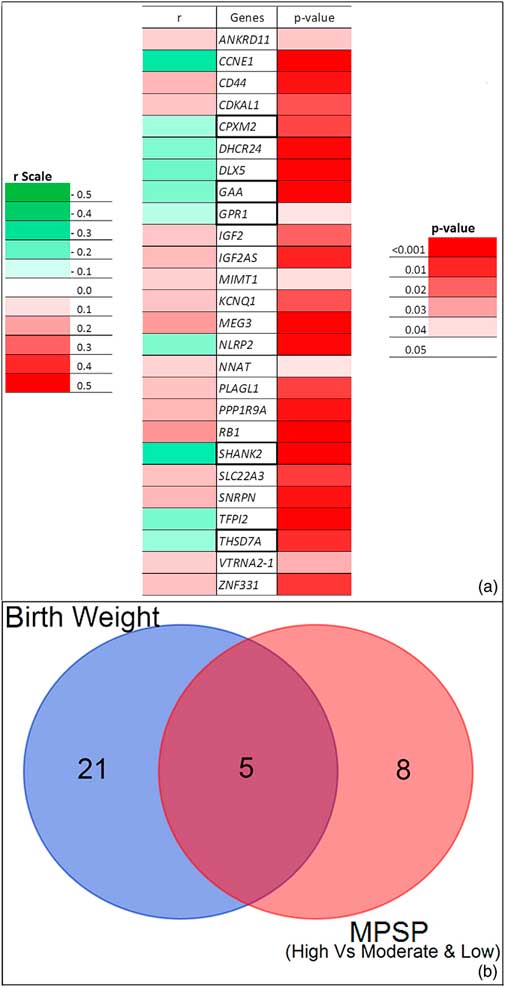
The expression of 26 imprinted genes was associated with birthweight (Fig. 3a and Tables S4 and S6). Of those, 10 genes were negatively correlated with birthweight, whereas the remaining 16 were positively correlated. Five genes were common to the MPSP genes of groups I and II (Fig. 3b).

Fig. 3 Birthweight statistical analysis. (a) Degree and direction (r) of the association of 26 imprinted genes with birthweight. Color coding is provided for both the r and p statistics. Boxed imprinted genes are in common between the birthweight analysis and groups I and II of the maternal psychosocial stress during pregnancy (MPSP) analysis (see text for details). (b) Venn diagram showing the distribution of the 26 imprinted genes associated with birthweight and the 13 imprinted genes of groups I and II of the MPSP analysis. See Tables S4 and S6 for additional details.
Mediation analysis
As we observed a statistically significant difference in birthweight only in the high v. low MPSP class we limited our analysis on the role of the imprinted gene expression in mediating the effects of MPSP on birthweight to the five genes of groups I and II that were individually associated to both MPSP and birthweight (Figs. 2b and 3a).
Four of the five genes tested returned a mediation effect between 16 and 28% within an unadjusted model. Two genes, glucosidase alpha acid (GAA) and SH3 and multiple ankyrin repeat domains 2 (SHANK2), each showed a 22% contribution to the mediation once we corrected our analysis for maternal age and education and gestational age at birth and infant gender (Fig. 4a and Table S7).

Fig. 4 Mediation and factor analyses. (a) Mediation chart for the five imprinted genes associated with both maternal psychosocial stress during pregnancy (MPSP) classes (groups I and II – see text for details) and birthweight. Genes glucosidase alpha acid (GAA) and SH3 and multiple ankyrin repeat domains 2 (SHANK2) withstood the adjustment for maternal age and education and gestational age at birth and infant gender. See Table S7 for additional details. (b) Imprinted gene expression cluster 1 showed a higher factor loading indicative of an increased expression of its member imprinted genes for the high MPSP class when compared with both moderate and low MPSP classes. Cluster 7 showed statistically significant higher loading compared with low MPSP. (c) Clusters 1, 2 and 7 returned a statistically significant association with birthweight; cluster 1 and 7 are negatively associated and cluster 2 positively. See Table S9 for additional details.
Factor analysis
The factor analysis returned a total of seven clusters with strongly correlated expression profiles (Table 2 and Figure S4). The clusters included 87 of the 93 genes whose expression profiles were used for the analysis. Cluster memberships spanned from five (Cluster 7) to 21 genes (Clusters 1 and 2). Interestingly 10 of the 13 genes of groups I and II from the MPSP analysis were grouped in cluster 1. Overall cluster 1 included 15 of the 23 imprinted genes (or 65%) associated with MPSP (all gene groups). The factor loading for cluster 1 for the high MPSP class was also significantly higher when compared with both low and moderate MPSP classes (Fig. 4b). Cluster 4 showed significantly higher factor loading in the moderate v. low MPSP classes (Fig. 4b). Interestingly, cluster 4 includes the only gene, H19 (group V), that showed the highest expression level in the moderate MPSP class. The cluster distribution for the genes associated with birthweight was instead more scattered with the majority of the genes grouped in cluster 2 (11 genes – 42%) and 1 (seven genes – 27%) (Table S8). A statistically significant negative association was detected between clusters 1 and 7 and birthweight; a positive significant association was instead detected between cluster 2 and birthweight (Fig. 4c and Table S9). Accordingly, for cluster 1 and 7, the imprinted genes associated to birthweight (seven out of 21 for cluster 1 and one out of five for cluster 7) all individually showed a negative association with birthweight. For cluster 2, the imprinted genes associated with birthweight all individually showed a positive association with birthweight (11 out of 21) (Table S4).
Table 2 Factor analysis of the imprinted genes expressed in stress in pregnancy placentas

A total of 87 of the 93 expressed genes grouped into seven clusters.
a For each cluster, genes are listed from the highest to the lowest factor loading.
b The remaining six genes, ATP10A, E2F7, GNASAS, HLA-DPB2, LOC253039 and LOC654433, were not loading on any of the clusters listed above. Their factor loadings did not also aggregate to generate any additional cluster(s).
We then reran the mediation analysis by using the factor loadings for each cluster in place of the gene expression values. Cluster 1 returned a 17% mediation effect between prenatal low- and high-stress classes and birthweight within an unadjusted model.
Gene network analysis
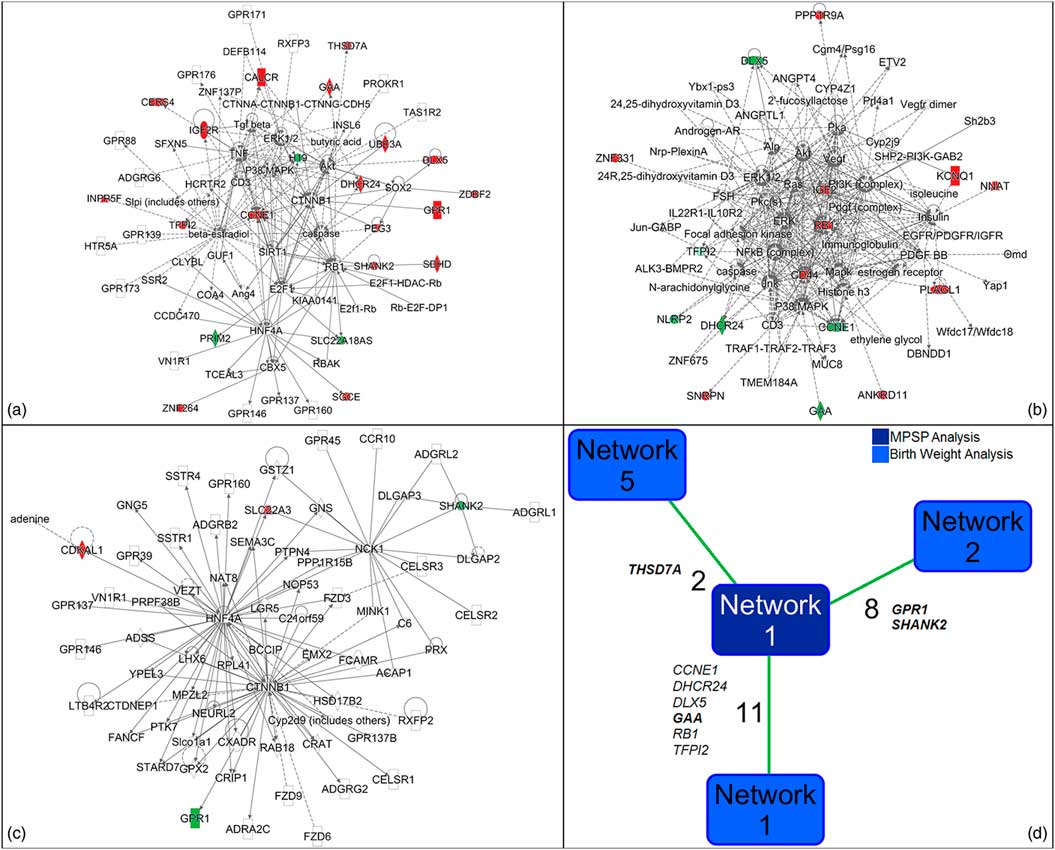
We fed the two sets of genes that were significantly associated with MPSP and birthweight, separately, to IPA obtaining two very different pictures (Table S10). The gene set associated with MPSP had 21 of its 23 genes grouped in a single 70-gene network (Fig. 5a and Table S11) centered on the glycogen degradation, cholesterol biosynthesis, myo-inositol biosynthesis and PTEN signaling pathways. The high scores for these pathways were driven by genes GAA, DHCR24 and INPP5F which are important terminals of the gene network functions.

Fig. 5 Ingenuity Pathway Analysis (IPA). (a) Gene network including 21 of the 23 imprinted genes associated with maternal psychosocial stress during pregnancy (MPSP) classes. (b and c) Gene networks including 16 (b) and four (c) imprinted genes associated with birthweight. For (a)–(c) color coding refers to expression downregulation (green) and upregulation (red). See Tables S10 to S12 for additional details. (d) Genes common to the IPA-generated networks for MPSP and birthweight. The number of common genes is reported together with the list of the imprinted genes common to the networks of the two analyses. Bolded are those imprinted genes included in the mediation analysis. See Table S13 for additional details.
The gene set associated with birthweight gave instead a broader picture returning two main 70-gene networks including 16 (Fig. 5b) and four (Fig. 5c) of the input genes, respectively (Table S12). Other five small networks were also generated including one input gene each. The role of genes CCNE1 and RB1 appeared central for the pathways scored by IPA which predominantly include cell-cycle regulatory pathways with hormonal (estrogen-mediated S-phase entry pathway), immune (antiproliferative role of the transducer of ERBB2 in T cells pathway) and neural (glioblastoma multiforme pathway) features.
The comparative IPA between MPSP and birthweight networks revealed an overlapping of 11 genes (of which six from our input list) between network 1 of the MPSP analysis and network 1 from the birthweight analysis; eight (two from our input list) between network 1 of the MPSP analysis and network 2 from the birthweight analysis; and two (one from our input list) between network 1 of the MPSP analysis and network 5 from the birthweight analysis (Fig. 5d and Table S13). Among the genes common to network 1 of the MPSP analysis and network 1 from the birthweight analysis, there are four of the five genes that belong to the key pathways from each separate analysis (CCNE1, DHCR24, GAA and RB1) (Table S14). Finally, among the genes common to network 1 of the MPSP analysis and networks 1, 2 and 5 from the birthweight analysis there are four of the five genes that have been statistically shown to mediate the effects of MPSP and birthweight (GAA, GPR1, SHANK2 and THSD7A).
Comparison with the genome-wide placental co-expression modules generated from the Rhode Island Child Health Study (RICHS)Reference Deyssenroth, Peng and Hao 27
We conducted an additional analysis to assess the distribution of the imprinted genes that we found associated to MPSP and birthweight across the 18 genome-wide co-expression modules that we previously generated from the RNA sequencing of 200 placenta samples from RICHS. Overall, 72 of the 93 imprinted genes consistently expressed in the SIP study placentas were found belonging to one of the 18 genome-wide co-expression modules (Table S15). As expected by chance alone the three modules grouping the three highest numbers of genes also included the highest number of imprinted genes (Table 3). Interestingly, when limiting the analysis to the imprinted genes associated with MPSP or birthweight or both, only the first two modules returned a sizeable number of imprinted genes. Additionally, the first module, called ‘turquoise’, showed a prevalence of imprinted genes associated with MPSP, whereas the second module, ‘blue’, had a prevalence of genes associated with birthweight (Table 3).
Table 3 Distribution of imprinted genes significantly associated with maternal psychosocial stress during pregnancy (MPSP) and birthweight across the placental genome-wide co-expression modules from Rhode Island Child Health Study

See Tables S13 and S14 for additional details.
A further analysis was carried out by crossing genome-wide co-expression modules with imprinted gene clusters. This analysis revealed a scattered random distribution of genes with no significant patterns (Table S16). Only cluster 1, in fact, returned a high proportion of significant imprinted genes (CPXM2, IGF2R, TFPI2, THSD7A) grouped in the ‘gray’ module.
Discussion
Our study confirmed that the existing literature showed that mothers experiencing high MPSP delivered babies with lower birthweight.Reference Grote, Bridge and Gavin 19 , Reference Loomans, van Dijk and Vrijkotte 20 We also detected specific imprinted gene expression panels associated with MPSP and birthweight that overlap over five genes. Two such genes, GAA and SHANK2, mediated the effect of MPSP on birthweight. These findings raise the interesting prospect that imprinted genes may sense the intrauterine environment as shaped by MPSP and translate this message into a fetal growth pattern.
The MPSP-associated imprinted gene expression panel that we detected highlighted an expression upregulation of significant genes in the high MPSP category. Ten of thirteen genes showing higher expression in high MPSP also clustered together (cluster 1) possibly implying their co-expression regulation which may extend to the other imprinted genes of this cluster. The cluster analysis additionally supported our individual gene analysis by showing significant higher factor loadings for cluster 1 in high MPSP. The IPA also grouped all imprinted genes significantly associated with high MPSP in a single network together with other 11 of 13 imprinted genes differentially expressed in other MPSP categories. The resulting network showed a strong vocation for gene expression and cell cycle regulation and cell differentiation. In the IPA-generated network, these functions are carried out, among others, by imprinted genes involved in the metabolism of glycogen (e.g. GAA), cholesterol (e.g. DHCR24) and myo-inositol (e.g. INPP5F) and PTEN signaling (e.g. IGF2R). Key imprinted genes of these pathways have been linked to disorders of glucose metabolism, diabetes and insulin resistance (GAA),Reference Rasouli, Hosseini-Ghazvini, Adibi and Khodarahmi 28 oxidative stress (DHCR24)Reference Zerenturk, Sharpe, Ikonen and Brown 29 and neurotransmitter metabolism (INPP5F and IGF2R).Reference Crespi 30 Of note, all these features are hallmarks of metabolic alterations which are often found in children delivered with low birthweight.Reference Loomans, van Dijk and Vrijkotte 20
The turquoise module of the genome-wide placental co-expression analysis from RICHS included five of the 13 imprinted gene associated with high MPSP. This module is enriched for genes of the cellular respiration including GAA. Increase expression of this same co-expression module is associated with low birthweight.Reference Deyssenroth, Peng and Hao 27 Notably, other three imprinted genes associated with high MPSP (CPXM2, IGF2R and THSD7A) were included in the gray module that lists genes that do not load in any co-expression module. High MPSP imprinted genes of the gray module mostly had wide-ranging functions including cell-cell adhesion, cell migration and transmembrane transport.Reference Colland, Jacq and Trouplin 31 – Reference Wang, Su and Du 33 Among them, THSD7A is interestingly almost exclusively expressed in endothelial cells from placenta and umbilical cord where it inhibits endothelial cell migration and the formation of capillary-like tubes.Reference Wang, Su and Du 33 In our study, THSD7A showed a higher expression in the high MPSP class which is associated with low birthweight.
The birthweight-associated imprinted gene expression panel included significant imprinted genes both up- and down-regulated. The expression cluster distribution accordingly revealed a spread of the significant imprinted genes across all clusters. The cluster analysis again strongly supported the findings for the individual genes by replicating the direction of the association shown by those imprinted gene members found associated with birthweight. The IPA similarly painted a broader network picture with a strong fetal development component dominated by the activity of two genes: CCNE1 and RB1. These genes by controlling proliferation and differentiation, during development,Reference Parisi, Beck and Rougier 34 , Reference Wu, de Bruin and Saavedra 35 participate in regulating the growth of different organs and systems. More specifically, the IPA supported a relevant role for CCNE1 and RB1 in regulating the activity of pathways including key imprinted genes involved in the response to hormonal cell-cycle control (e.g. TFPI2),Reference Ma, Chan and Kwan 36 immune system functioning (e.g. CD44),Reference Lieberman and Hunter 37 metabolism (e.g. GPR1)Reference Ernst, Issa, Goralski and Sinal 38 and neurodevelopment (e.g. SHANK2).Reference Monteiro and Feng 39
The blue module of the genome-wide placental co-expression analysis from RICHS included 11 of the 26 imprinted gene associated with birthweight. The blue module, however, did not show a direct correlation with birthweight.Reference Deyssenroth, Peng and Hao 27 Interestingly, though, this module showed an enrichment of GWAS-associated phenotypes of vascular endothelial growth. Together with the increased expression of THSD7A in low birthweight, these observations overlap with the findings that report of alterations of the vasculature development in placentas from growth-restricted pregnancies delivering low birthweight babies.Reference Degner, Magness and Shah 40 At the same time, the elevated THSD7A expression found in MPSP provides clues on the mechanism of maternal stress affecting placental differentiation.
Our mediation analysis pointed at two imprinted genes GAA and SHANk2 as mediators of the effects of MPSP on birthweight. GAA is an enzyme that catalyzes the selective hydrolyzation of lysosomal glycogen to release single glucose molecules.Reference Chiba 41 GAA thus increases glucose absorption promoting obesity and insulin resistance.Reference Kong, Oh and Ahn 42 Several drugs have been developed that specifically target GAA to treat diabetes.Reference Liu and Ma 43 These findings are in agreement with reports on the association between low birthweight and the development of metabolic alterations in childhood.Reference O'Donnell and Meaney 21 They also point out a possible effect of high MPSP in promoting a phenotype that may best adapt to an environment that the mother experiences as challenging.
The scientific literature on SHANK2 and, more at large, the whole family of shank genes, instead speaks for a strong association between inactivating mutations of one or more of the shank genes and autism spectrum disorder (ASD).Reference Leblond, Nava and Polge 44 , Reference Sala, Vicidomini, Bigi, Mossa and Verpelli 45 Mutations of the shank family associated with ASD all lead to different degrees of inactivation of genes of the shank family, which functionally correspond to a decrease in the expression level of the affected gene(s).Reference Monteiro and Feng 39 Mutations of the shank family may induce gene expression-equivalent alterations spanning from downregulation, for those mutations that affect the activity rates of the protein product(s), to total ablation, for those mutations that completely disrupt the Shank protein(s) activity.Reference Monteiro and Feng 39 In our study, however, we observed an upregulation of SHANK2 in placentas from high MPSP mothers which are significantly associated with low birthweight. Human and animal studies reported that duplications of shank-coding regions, possibly leading to expression upregulation, are associated with attention deficit hyperactivity disorder and manic-like phenotypes.Reference Han, Holder and Schaaf 46 , Reference Moessner, Marshall and Sutcliffe 47 All of these conditions have been associated with low birthweight and they normally emerge in later stages of childhood/early adolescence.Reference Grissom and Reyes 48 , Reference Pettersson, Sjolander and Almqvist 49 Interestingly, in our previous studies on the RICHS cohort, by using the same expression analysis platform, we detected SHANK2 among the genes driving suboptimal scores clustering for, chiefly, ‘stress abstinence’, ‘asymmetrical reflexes’, and ‘quality of movement’ in children whose neurodevelopmental status was assessed with the neonatal intensive care unit Network Neurobehavioral Scale at least 24 h after birth but before discharge.Reference Green, Kappil and Lambertini 24
Similarly, the same study on the RICHS cohort highlighted a significant positive association between the expression of two genes, MEG3 and PLAGL1, and birthweight. In our study, these genes returned concordant findings and they were both grouped into cluster 2, the 21-gene cluster that includes 11 imprinted genes all positively associated with birthweight. These data provide additional confidence to the findings presented here. Finally, additional support to our findings came for the comparative IPA that pointed at the same genes of our mediation statistical analysis as common drivers of MPSP and birthweight gene networks.
In conclusion, to our knowledge, this is the first study that shows that the expression of imprinted genes mediates the effects of MPSP on birthweight. These results, however, need additional confirmatory investigations because of the inherent limitations of our study which could not analyze all factors that are known to play a role in determining birthweight and the size of the available sample set. Data on the metabolic status and infant neurodevelopment also need to be generated that are not currently available because of the different ages of the children enrolled in the SIP study. Nevertheless, the current study showed the potential to effectively fill the gap linking MPSP and suboptimal birth outcome by providing evidence that placental imprinted gene expression could be used as a useful marker for suboptimal infant development.
Supplementary material
To view supplementary material for this article, please visit https://doi.org/10.1017/S2040174418000545
Acknowledgements
None.
Financial Support
This work was supported by the following National Institutes of Health (NIH) grants: R01 MH102729 (YN and JC) from the National Institute of Mental Health (NIMH); R01 ES022223 (CM and JC) from the National Institute of Environmental Health Sciences (NIEHS).
Conflict of Interest
None.
Ethical Standards
The authors assert that all procedures contributing to this work comply with the ethical standards of the Helsinki Declaration of 1975, as revised in 2008, and have been approved by the Institutional Review Boards at Icahn School of Medicine at Mount Sinai Queens College and New York Presbyterian Queens. All participants provided written informed consent for their enrollment in the SIP study and all research activities conducted on the samples collected by the SIP study and used in this work.