


Political observers often argue that the low salaries paid in state and local governments make holding office economically infeasible for lower-income citizens. Journalists worry that “working-class people . . . do not have the means or the time to run for office and serve” (Fausset Reference Fausset2014, 1). Activists argue that “[a]s long as state legislatures are part-time and poorly funded, it is an uphill battle for an ordinary person to serve and pay the bills at the same time” (Confidential 2014, 1). And reformers assert that “[i]t is past time for an honest debate about [raising] legislative pay . . . to make it possible for a broad cross section of people to serve” (Fitzsimon Reference Fitzsimon2010, 1). Running a campaign and holding a political office take time and money. If politicians were paid better, the argument goes, more middle- and working-class people could afford to be politicians (see also Blumberg Reference Blumberg2014).
Would raising politicians’ salaries actually encourage more people of modest means to seek and hold political office? Although observers routinely argue that it would, there is surprisingly little empirical evidence on this point. Scholarly research on politicians’ salaries has recently focused more on outcomes like legislative productivity (e.g., Ferraz and Finan Reference Ferraz and Finan2009); to date, no published study has examined how the salaries paid to politicians in the United States affect whether more and less affluent Americans seek and hold public office. Likewise, the emerging literature on the numerical or descriptive representation of social classes has started to investigate why so few middle- and working-class people hold political office in the United States, but that work has focused primarily on voters, parties, and interest groups (e.g., Carnes Reference Carnes2013; Sadin Reference Sadin2012; Sojourner Reference Sojourner2013), not on institutional rules like legislative salaries.
There are certainly reasons to suspect that offering politicians in the United States higher salaries would encourage more lower-income and working-class Americans to hold political office, but there are also good reasons to be skeptical. Raising politicians’ salaries could make holding office more feasible for the less fortunate, but it could also make political office more attractive to affluent professionals, increasing competition for office and ultimately discouraging lower-income citizens from running and winning. In other advanced democracies, political institutions that pay more tend to attract more white-collar professionals (e.g., Gagliarducci and Nannicini Reference Gagliarducci and Nannicini2013). Giving politicians in the United States a pay raise might make holding office more affordable for the working class, but it might also make public office more attractive to white-collar Americans.
In this article, we use data on state legislatures in the United States to measure the relationship between politicians’ salaries and the social class makeup of political institutions. Drawing on aggregate-level data from the National Conference of State Legislatures (NCSL) and data from the 2012 National Candidate Study—a one-of-a-kind individual-level survey of the 10,000 state legislative candidates who ran for office that year—we explore the links between legislative salaries and the occupational makeup of state-level candidates and politicians. Our findings have important implications for scholars and activists interested in politicians’ salaries, the social class makeup of government, and reforms to address political inequality.
POLITICIANS’ SALARIES AND ECONOMIC DIVERSITY
Pay raises for politicians are usually controversial. How much we pay our leaders naturally evokes questions about the spirit of public service, the quality of government, the meaning of fair compensation, and a host of other weighty normative issues. It also evokes more straightforward empirical questions. Would paying politicians more give us leaders who are less corrupt? More responsive to their constituents? More likely to run again? More diverse?
The answers are often “yes.” A growing body of empirical research suggests that politicians’ salaries are associated with a wide range of important outcomes. When politicians in the United States are paid more, they are less likely to pursue outside employment while serving in office (Maddox Reference Maddox2004), they introduce more legislation and miss fewer votes (Hoffman and Lyons Reference Hoffman and Lyons2015), they are more in-step with their constituents ideologically (Besley Reference Besley2004), they are more likely to run for re-election (Diermeier, Keane, and Merlo Reference Diermeier, Keane and Merlo2005), they favor citizen interests over business interests (Bowen and Mo Reference Bowen and Mo2016), and they face more competition from qualified challengers (Hoffman and Lyons Reference Hoffman and Lyons2015). There is also some evidence that more Democrats are elected when politicians are paid more (Fiorina Reference Fiorina1994) and that party leaders are more involved in candidate recruitment (Sanbonmatsu Reference Sanbonmatsu2006). How much we pay our political leaders seems to affect the kind of government we get in return.
Does it also affect the economic or social class backgrounds of our political decision makers, as reformers often claim? The idea seems worth exploring. Politicians in the United States tend to be vastly better off than the people they represent; they are wealthier, more educated, and more likely to come from white-collar jobs (Beckett and Sunderland Reference Beckett and Sunderland1957; Domhoff Reference Domhoff1967; Hyneman Reference Hyneman1940; Key Reference Key1956; Matthews Reference Matthews1954a; Reference Matthews1954b; Mills Reference Mills1956; Orth Reference Orth1904; Sadin Reference Sadin2012; Squire Reference Squire1992; Zeller Reference Zeller1954). If millionaires were a political party, that party would make up just three percent of the country, but it would have a majority in the House of Representatives, a filibuster-proof supermajority in the Senate, a 5-4 majority on the Supreme Court, and a man in the White House. If working-class Americans—people employed in manual-labor and service-industry jobs—were a political party, that party would have made up more than half of the country since the start of the 20th century, but legislators from that party (those who last worked in blue-collar jobs before getting into politics) would never have held more than two percent of the seats in Congress.
These economic and social class gaps appear to have important consequences for public policy. One emerging line of research has found that lawmakers from different classes tend to bring different perspectives to the political process. Just as the shortage of women in office affects policy outcomes on issues related to gender (e.g., Berkman and O'Connor Reference Berkman and O'Connor1993; Swers Reference Swers2002; Thomas Reference Thomas1991), the shortage of working-class people—who tend to be more progressive on economic issues—appears to bias policy on issues like the minimum wage, taxes, and welfare spending towards the more conservative positions typically favored by affluent Americans (e.g., Carnes Reference Carnes2013; Grose Reference Grose2013; Griffin and Anewalt-Remsburg Reference Griffin and Anewalt-Remsburg2013). Building on these findings, another nascent literature has begun to ask why there are so few working-class Americans in political office in the first place (Sadin Reference Sadin2012; Sojourner Reference Sojourner2013; see also Campbell and Cowley Reference Campbell and Cowley2014). If paying politicians more does in fact promote economic diversity in our political institutions, it would have important implications for research on descriptive representation—and for American democracy more generally.
As it stands, we simply don't know. Research on the factors that discourage lower-income and working-class Americans from holding political office is still relatively new, and most of the work that has been done to date has focused not on institutional factors like legislator salaries, but on factors like the qualifications of the working class (Carnes Reference Carnes2013), the views of voters (Sadin Reference Sadin2012), and the strength of labor unions (Carnes Reference Carnes2016; Sojourner Reference Sojourner2013). A handful of political compensation studies have examined the links between legislative salaries and the number of college graduates or attorneys in office (Besley Reference Besley2004; Diermeier, Keane, and Merlo Reference Diermeier, Keane and Merlo2005; Hoffman and Lyons Reference Hoffman and Lyons2015; Kotakorpi and Poutvaara Reference Kotakorpi and Poutvaara2011),Footnote 1 but no compensation study to date has asked about the political representation of the working class. Although reformers often argue that pay raises for politicians would encourage lower-income and working-class Americans to run for and hold public office, to the best of our knowledge, no previous study ever has directly tested this claim.
There are certainly signs that the argument has promise. What little research there is on the descriptive representation of lower-income or working-class people suggests the shortage of workers in office is not the result of either a deficit of qualifications on the part of workers or some sort of antiworker bias on the part of voters (e.g., Sadin Reference Sadin2012). Institutional rules like salaries could be a part of the explanation; scholars have long known that the structure of political institutions can affect the descriptive representation of other social groups like women or racial and ethnic minorities (e.g., Canon Reference Canon1999; Trounstine and Valdini Reference Trounstine and Valdini2008; see also Rosenson Reference Rosenson2006).
Then again, there are also signs that paying politicians more might not increase the representation of the less fortunate. Across different levels of government, larger jurisdictions like states or counties—which usually pay politicians higher salaries—tend to have fewer working-class politicians (Carnes Reference Carnes2013). And in general, legislative professionalization appears to make it difficult for underrepresented groups to break into office (e.g., Casellas Reference Casellas2011; Squire Reference Squire1992). If we wish to understand the links between politician compensation and the social class makeup of government, we will need to look more carefully at that relationship.
How Salaries Could Matter
We will also need to think more carefully about it. When reformers discuss political compensation, they seldom spell out exactly how they believe it will affect the descriptive representation of different social classes.
One important distinction that is often obscured in popular discussions is the difference between how salaries affect who runs, who wins, and who runs again. The numerical or descriptive representation of any social group is determined by the number of people from that group who run for office, the number of those who win election, and the number who subsequently choose to run again, either for the same office or for another level or branch of government (e.g., Lawless and Fox Reference Lawless and Fox2005; Reference Lawless and Fox2010). When reformers talk about the links between legislative salaries and the descriptive representation of the working class, however, they seldom specify exactly which part of the larger officeholder “pipeline” is affected by the salaries offered to politicians.
Moreover, reform proposals often focus on how pay raises for politicians might affect lower-income or working-class Americans without also considering how increasing legislative salaries would affect the incentives of more affluent citizens. Even if raising legislative salaries makes holding office more attractive to the less fortunate, if it also makes holding office more attractive to affluent professionals, higher pay could actually stimulate more heated competition for elected office and ultimately make it harder for working-class Americans to break into politics. The relationship between politicians' salaries and working-class representation simply may not be as straightforward as reformers often suggest.
To the contrary, it is easy to imagine a variety of mechanisms by which legislative salaries could increase or decrease the numerical representation of the working class among candidates, officeholders, and officeholders who run again.
The most common argument among reformers is that higher pay would increase the number of working-class people who run, or perhaps the number who run for re-election. One version of this argument holds that when pay is low, people with low incomes, less flexible work schedules, and less savings or wealth simply can't afford to pay their bills while holding office—the utility associated with being a politician is unbearably negative, so they choose not to run in the first place. (This idea is consistent with some economic threshold models of candidate entry, e.g., Maddox Reference Maddox2004.) Another version (which reformers mention less often but which is consistent with some theoretical work on candidate entry, e.g., Mattozzi and Merlo Reference Mattozzi and Merlo2008) holds that raising politicians’ salaries would initially make holding office more appealing to people making low incomes (who could increase their earnings by several orders of magnitude by serving in office) than to people making high incomes. In either case, the potential mechanism is essentially the same: raising politicians’ salaries could increase the benefits workers associate with holding office (more than it increases the utility boost professionals receive), and thereby increase the number of lower-income Americans who run for office or for re-election.
Then again, there are also reasons to think that paying more might reduce the percentage of workers who choose to run or run again. For one, paying politicians more could make holding office more attractive to white-collar professionals by reducing the opportunity cost associated with holding office; recent theoretical models of candidate quality have argued that paying politicians more will simply give affluent professionals more material incentives to forego high-paying jobs in the private sector (e.g., Besley Reference Besley2004; Besley and Coate Reference Besley and Coate1997; see also Osborne and Slivinski Reference Osborne and Slivinski1996). Raising salaries could also increase the status or prestige associated with holding office, which could in turn increase the number of professionals who run (by making public office more attractive to people who already work in prestigious jobs) and/or decrease the number of workers who run (by making people who work in less prestigious jobs feel less well-suited for a job in politics). Paying politicians more could also alter the behavior of the party and interest group leaders who often recruit candidates; when politicians are paid better, these gatekeepers may be more likely to look to highly paid occupations for potential recruits (e.g., Sanbonmatsu Reference Sanbonmatsu2006), which could increase the number of professionals who run and/or decrease the number of workers who run. And if more professionals ultimately run when pay is higher, the heightened competition could itself discourage working-class candidates from running. In theory, there are a host of mechanisms by which pay raises for politicians could ultimately shrink the share of workers who run for office or for re-election.
There are also reasons to think that paying more could reduce the percentage of workers who win (over and above any effect it has on workers’ representation in the candidate pool). If public office pays more, voters might expect politicians to more closely resemble people who earn high pay in other areas of life. Although there is no prior research on this topic, it is at least conceivable that raising politicians’ salaries more could actually reduce the odds that voters will elect the working-class candidates who run. (And we know of no reason to think the opposite, that is, that higher pay might make voters more likely to elect workers.)
It is also possible that the relationship between politician compensation and the share of workers who run or win could be curvilinear. Perhaps increasing legislative salaries from $0 at first makes holding office feasible for lower-income and working-class people (thereby increasing the share of workers who run), but increasing salaries further eventually makes holding office attractive to white-collar professionals (thereby increasing the share of professionals who run and reducing the share of workers).
And, of course, there are also reasons why we might expect salaries not to have any effect on the social class makeup of who runs, who wins, or who runs again. Obviously, there are many factors besides the rate of pay for politicians that could discourage working class Americans from holding office. Workers might have a harder time raising campaign donations, have less interest in politics, or lack necessary skills like public speaking. Or perhaps the salary paid to politicians isn't the problem, but rather the salary (or lack thereof) paid to candidates: for many lower-income Americans, taking time off work to run a campaign may simply be impossible regardless of the salary they would earn if elected. The numerical representation of the working class might have nothing to do with the salaries we offer politicians; there are many other factors that could be discouraging workers from running, winning, or running for re-election.
So which is it? Are reformers right that the shortage of working-class politicians is partly the result of the low salaries offered in most political offices? Or would paying more drive the share of workers in our political institutions even lower? Or simply have no effect on the economic diversity of our government?
EVIDENCE FROM STATE LEGISLATURES
One way to begin improving our answers to these important questions is to study state legislatures. States are ideal for several reasons. State politicians are more numerous than federal officials—for every member of Congress, there are roughly 13 state legislators. And states tend to vary more than federal institutions. Compared to members of Congress, state legislators are far more diverse in terms of the salaries they earn, the contexts in which they campaign and govern, and the social classes they come from.
Moreover, states governments make important decisions. States write and administer economic policies ranging from minimum wage and income tax rates to cash assistance levels for needy families. In 2008, state government expenditures totaled more than $1.2 trillion (more than 8 percent of GDP).Footnote 2 And at the state level, the social class makeup of government seems to affect policy as much as it does at the federal level (Carnes Reference Carnes2013, chap. 5).
As a test of the idea that paying politicians more increases the numerical representation of the working class, we analyzed data on the salaries offered to state legislators and the number of candidates and officeholders in each state legislature who worked primarily in working-class jobs, that is, manual labor jobs (like factory worker), service-industry positions (like restaurant server), clerical jobs (like receptionist), or union jobs (like field organizer).Footnote 3
Collecting data on state legislative salaries was relatively straightforward. Scholars interested in legislative professionalism have amassed a great deal of accurate, over-time data on the average salaries paid to legislators in all 50 states (e.g., Squire Reference Squire1992; Reference Squire2007). Legislative compensation varies dramatically. At the low end, New Hampshire pays most of its legislators $200 per two-year term, while New Mexico pays no salary at all (though New Mexican legislators do receive a roughly $150 per diem while meeting in Santa Fe). At the high end, legislators in California, Michigan, and New York all earn over $75,000 annually.
Collecting data on the economic or social class backgrounds of politicians is more challenging. Surveys of candidates and officeholders at the state level are rare, and many of those that have been conducted have not asked about legislators’ occupational backgrounds. Although many states list legislators’ occupations on the web, the practice is relatively new—below the national level, systematic biographical information about officeholders is often hard to come by. Biographical data on candidates is even harder to get. Many candidates for state office run small campaigns, have limited web presences, are never covered extensively by the media, and quickly remove campaign materials from the web after election time.
For this analysis, we relied on two sources of data on state legislators’ and candidates’ occupations: an aggregate-level dataset on state legislators (that is, those who won elections and went on to hold office) and an individual-level dataset on candidates for state legislature (successful or not). The aggregate-level dataset consisted of information about the occupational makeup of legislators in all 50 states. In 1979, the Insurance Information Institute of America compiled data on the main occupations held by every state legislator nationwide and published the results in state-level aggregates. In 1993, 1995, and 2007, the National Conference of State Legislatures followed suit. We used a dataset that combined all four waves of data (see also Carnes Reference Carnes2013, chap. 5) to determine whether working-class people are, in fact, more likely to serve in the state legislature in times and places where doing so pays more.
To determine whether working-class people are more likely to run, win, and run again when holding office pays more, we also analyzed a unique national survey of state legislative candidates, the 2012 National Candidate Study (or NCS). In August 2012, Broockman et al. (Reference Broockman, Carnes, Crowder-Meyer and Skovron2012) surveyed the 10,131 people running for state legislature nationwide at that time. The study achieved a 19 percent response rate—1,907 state legislative candidates submitted responses—and the survey appeared to capture the views of a representative sample of candidates (response rates were well-balanced on several important observable characteristics, like the party of the candidate, whether the candidate went on to win or lose the election, the candidate's vote margin, and the candidate's region; see Broockman and Skovron Reference Broockman and Skovron2013). Moreover, the response rate did not seem to be higher among the affluent (a common concern in survey research): the survey's respondents included 52 workers (3% of respondents), a sample about as large as we would expect based on other exhaustive studies of the social class backgrounds of state legislators (see appendix Table A1 for additional supporting information) and large enough to make at least simple inferences about candidates from the working class.Footnote 4 With this dataset, we can see not just whether working-class people are more likely to win office in places that pay politicians more, but whether workers are more likely to run for offices that pay better or run again after being elected.
The National Candidate Study also included questions that tapped some of the potential mediating factors that could be driving any relationships we observe between salaries and the share of workers who run or win, like how concerned each candidate was about losing income while holding office. Together, these datasets allowed us to test the link between legislative salaries and the overall descriptive representation of the working class (e.g., whether workers held office), the behaviors of workers (whether they made up greater shares of candidates who ran, won, or ran again), and some of the attitudes that might mediate those relationships (e.g., whether workers worried less about lost income in states that paid more).
POLITICAL COMPENSATION AND ECONOMIC DIVERSITY
Figure 1 uses the aggregate-level data from 1979, 1993, 1995, and 2007 to plot the basic relationship between how well a state pays its legislators (adjusted to 2007 dollar values) and the percentage of lawmakers in that state from working-class jobs. The pattern in the data is unmistakable; in states that pay legislators higher salaries, working-class citizens make up smaller shares of the state legislature, not larger ones.

FIGURE 1. Legislative Salaries and Working-class Representation in State Legislatures (1979, 1993, 1995, and 2007)
In sharp contrast to the idea that pay raises make public office more accessible to the working class, the political representation of workers is worst in states that pay legislators salaries over $75,000—about 2 percent on average—and best in states that pay legislators next to nothing—about 7 percent on average. Of course, 7 percent is still far lower than the share of working-class people in the general public, which stands at around 52 percent. (Salaries clearly aren't the only factors keeping working-class Americans out of office.) In terms of the hypotheses in question, however, the findings reported in Figure 1 offered no support for the idea that working-class citizens hold office in larger numbers when state legislative salaries are relatively higher (in which case we would expect a positive association in Figure 1) or when salaries exceed some economic threshold (in which case we would expect a spike somewhere). To the contrary, these data on state legislatures are squarely in line with the argument that paying politicians more makes holding office more attractive to professionals, not more attainable for workers.Footnote 5
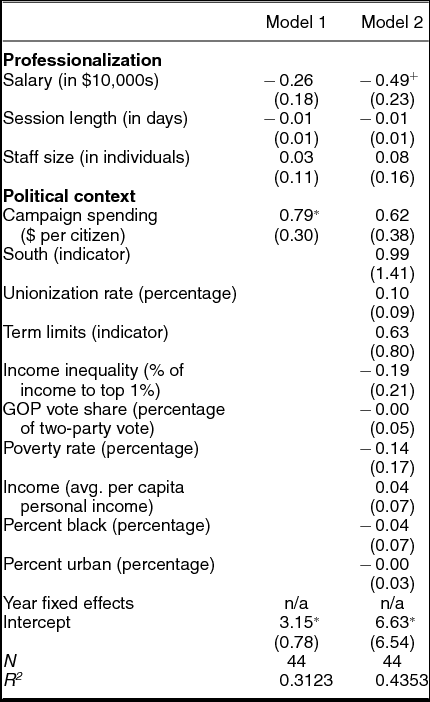
Of course, states that offer higher and lower salaries to legislators might also differ in other ways. States that pay more tend to have more professionalized legislatures, larger populations, and more big cities. They also tend to elect more liberal members.Footnote 6 Even when we took these kinds of differences into account, however, we still observed the same basic relationship evident in Figure 1. Table 1 below reports the results of two least squares regression models. In both, we regressed the percentage of legislators from the working class in each state in the pooled aggregate-level dataset (n = 200; 50 states × 4 years) on the official salary paid to state lawmakers (again, adjusted to 2007 dollars). In the first model, we also added fixed effects for each year (models that use state and year random effects with bootstrapped standard errors produced similar results; see Appendix Table A2). We also controlled for two additional measures of how professionalized the state legislature was. Scholars who study legislative professionalism typically measure the concept with data on legislative salaries, the number of staff members employed by the average state legislator, and the average length of a legislative session in that state.Footnote 7 To account for the possibility that states that pay legislators more also demand more from them—and that these demands, not the salary itself—drive down the representation of the working class, we added controls for staff size and session length to the first model in Table 1.
TABLE 1. Legislative Salaries and Working-Class Representation

Source: Insurance Institute of America (1979), National Conference of State Legislatures (2012), and authors’ data collection. Notes: Cells report estimates from regression models relating the percentage of state lawmakers from the working-class in each state in 1979, 1993, 1995, and 2007 to the variables listed here. *p < 0.05, two tailed.
Viewed this way, our results were essentially the same. According to the first model in Table 1, states that paid legislators $75,000 tended to have about three percentage points fewer working-class state legislators than states that paid next to nothing. Of course, legislative compensation and other measures of professionalization go hand in hand—the correlation between legislative salaries and session length was 0.56, the correlation between salaries and staff size was 0.65, and the correlation between session length and staff size was 0.38. Even with these controls in the model, however, we still observed a significant negative association between salaries and working-class representation. This isn't to say that the smaller and nonsignificant coefficients on staff size and session length are evidence that these aspects of professionalism are unimportant, of course; to the contrary, the point estimates for staff size and session length may well be attenuated due to the strong correlation between the three professionalization variables. Model 1 does not rule out the possibility that staff size and session length affect working-class representation; it simply illustrates that legislative salaries are not mere proxies for other aspects of legislative professionalization, that is, that the association between salaries and working-class officeholding documented in Figure 1 is not simply being driven by a lurking correlation between salaries and other aspects of professionalization. States that pay more have fewer working-class politicians—and it doesn't seem to be simply because they have more professionalized legislatures.
The same was true when we added additional controls that captured other aspects of the political environment. In the second model in Table 1, we added four simple political context measures: (1) an indicator for Southern states, (2) a measure of the unionization rate (Hirsch and Macpherson Reference Hirsch and Macpherson2003), which has been found to predict working-class representation in state legislatures, (3) an indicator for states that had term limits for state legislators, and (4) the partisan makeup of the state (the Republican percentage of the two-party vote in the last presidential election). We also controlled for three measures of the state economy: (1) a measure of economic inequality (the percentage of income earned by the top one percent of earners; Frank Reference Frank2009); (2) average per capita personal income (from the Census Bureau and adjusted for inflation), and (3) the poverty rate (from the Census Bureau). And we added two additional demographic variables: the percentage of state residents who were Black and the percentage who lived in urban areas (from the Census Bureau). If the salary paid to legislators in a state was simply a proxy for some other feature of the political landscape, adding these controls should have dampened our results.
If anything, however, these controls sharpened our original findings. Consistent with prior research (e.g., Carnes Reference Carnes2016; Sojourner Reference Sojourner2013), we found a positive association between unionization and the political representation of the working class, perhaps reflecting the role of unions in encouraging working-class people to run or supporting their campaigns. We also found a negative association between economic inequality and working-class representation, perhaps suggesting that in states where workers are more economically disadvantaged overall, they have a harder time running for office or winning elections. And we did not find associations between working-class representation and legislative session length or staff size (a finding that seemed to support the idea that working-class representation is not a response to the size of the reward or burden associated with winning office).
Even with these controls in the model, moreover, we continued to observe a negative association between state legislative salary and working-class representation (in fact, the association was slightly larger and more precise in the second model in Table 1). The same was true when we carried out a series of additional robustness checks (available on request), including estimating the models for each of the four years separately, using an alternative measure of legislative salaries (Bowen and Greene Reference Bowen and Greene2014), and controlling for the legal procedures each state used to raise legislative pay. Although we did not have sufficiently fine-grained data to estimate panel or time series models (since we had only four years in our sample), we checked that changes in legislative pay between our first and last waves were not associated with changes in working-class representation during that time period (see Figure A1 in the Appendix). They weren't. We also estimated models that analyzed not the salary offered to state legislators, but the relative boost in salary a worker might receive (by subtracting the average per capita income in each state from the salary paid to state legislators; see Table A3 in the Appendix). And although the data in Figure 1 did not appear to exhibit a quadratic relationship, we tested a quadratic model and found no evidence of a curvilinear relationship—it did not seem to be the case that increasing legislative salaries from $0 at first makes holding office feasible for lower-income and working-class people (see Table A4 in the Appendix). We also estimated models that controlled for the distance to the state capital (following Silbermann Reference Silbermann2015; see Table A5), the partisan composition of the legislature (see Table A6), the sophistication of the state party organizations (see Table A7), the competitiveness of the two parties in the state (see Table A8), the size of the state budget (see Table A9), and the cost of campaigns in each state (see Table A10). Regardless of how we analyzed the data, we consistently found that states that offer higher salaries to their legislators have fewer working-class politicians, not more.
Who is taking their place? The answer seems to be career politicians. In Figure 2, we use the aggregate data from Figure 1 to plot the occupational makeup of state legislatures against legislative salaries, this time focusing on several other occupational categories in the data: lawyers, business owners, service professionals (like teachers and social workers), and career politicians. Most occupations were either about as common in state legislatures that paid more (like law), or less common (like business and service professions). The striking exception across all of the occupational categories in the dataset was career politicians, legislators who were classified as working primarily in politics (and not any other outside job). In states that pay state legislators more, state legislators are more likely to be people who work exclusively in politics. Paying politicians more doesn't seem to make holding office more accessible to the working class—it seems to make holding office more of a career.

FIGURE 2. Legislative Salaries and the Occupational Makeup of State Legislatures (1979, 1993, 1995, and 2007)
Of course, it's possible that in states that pay higher salaries, working-class citizens are more likely to run for office, win, but then eventually become career politicians. Does offering more compensation to politicians encourage more lower-income and working-class people to run, then start them on the path towards long careers in office?
WHO RUNS, WHO WINS, AND WHO RUNS AGAIN
More fine-grained individual-level data on state legislative candidates in 2012 suggests that the answer is no. The 2012 Broockman et al. National Candidate Study asked respondents a highly detailed question about their occupational backgrounds: “What is your primary occupation? (If holding a political office is currently your primary occupation, what was your primary occupation before you got into politics?)” With this information, we can see whether politicians from the working class—even those who have given up working-class jobs in favor of careers in politics—are more likely to hold office in states that pay higher salaries.
The National Candidate Study also included items that asked whether each candidate was an incumbent, items that asked whether each candidate had ever held any other elected office, and data on whether each candidate ultimately won the 2012 election. With this information, we were able to ask whether working-class Americans are more likely to run in states that pay more, win in state that pay more, and run again.
They were not. Figure 3 plots the percentage of state legislative candidates in each state from the working class (panel (a)), the percentage of state legislative winners from the working class (panel (b)), the percentage of incumbent state legislators from the working-class (panel (c)), and the percentage of candidates who had held any prior office who were from the working class (panel (d)). The salary offered by the state legislature appeared to have no bearing on the share of working-class people in the candidate pool, the pool of winners, or the pool of incumbent or experienced candidates. (We reached the same conclusion when we estimated regression models—available on request—with controls for other aspects of the political environment.) In states that pay politicians more, working-class people (even those who have gone on to make a career out of politics) don't appear to be more likely to run, to win, or to run again.

FIGURE 3. When Legislatures Pay More, Do Workers Run, Win, or Run Again?
HOW CANDIDATES THINK ABOUT SALARIES
In our aggregate-level data, states that pay more have fewer blue-collar workers in their legislatures. In our individual-level data, states that pay more have about as many blue-collar candidates. Our individual-level estimates are noisier, of course. (Our aggregate-level data are based on information about every legislator in every state, whereas when we average our individual-level data, we only have information about 19 percent of state legislative candidates.) Regardless, both datasets cast doubt on the idea that paying politicians more would encourage more working-class Americans to hold office. At best, paying more isn't associated with any change in economic diversity. At worst, it's associated with decreases in working-class representation.
What might be going on in the minds of potential candidates? Does raising salaries really affect how people think about holding office? Reformers who support higher pay for politicians often argue that raising salaries would make holding office more affordable for working-class Americans. Research under the heading of candidate quality, on the other hand, has long maintained that paying politicians more will make political service more attractive to highly paid professionals (Besley Reference Besley2004; Besley and Coate Reference Besley and Coate1997; Caselli and Morelli Reference Caselli and Morelli2004; Osborne and Slivinski Reference Osborne and Slivinski1996).
With the National Candidate Study, it is possible to directly examine one of the potential mechanisms that might link salaries and candidate entry (and the one most often discussed by reformers), namely, the financial opportunity cost associated with holding office. The survey included an item that asked respondents, “Many people who think about running for office choose not to because of the many personal challenges entailed in seeking public service. When you first ran for elected political office, did you feel seriously concerned about any of the following?” One option was “Losing out on income while serving in office.” Another was “Losing the job I had at the time [I first decided to run].”
Figure 4 plots the percentages of working-class (left two panels) and white-collar (right two panels) respondents in each state who reported that they worried about losing income and losing their jobs the first time they ran for office. In states that paid more, working-class candidates reported similar levels of anxiety about losing their jobs and incomes. White-collar candidates, however, reported significantly lower levels of anxiety about losing their incomes and slightly higher levels of concern about losing their jobs. Consistent with the idea that paying more can offset the opportunity cost of holding office for highly paid professionals, in states that compensate politicians more generously, white-collar professionals are less worried about losing their incomes. (Again, we reached the same conclusion when we estimated regression models—available on request—with controls for other aspects of the political environment.) Professionals seem to recognize that running for office may mean giving up their day jobs, but they seem significantly less worried about lost income in states that pay more.

FIGURE 4. When Politics Pays More, Do Workers and Professionals Worry Less About Money?
Of course, we should be cautious in interpreting these results: lost income is just one of the mechanisms that might link legislative pay and reductions in working-class representation (we cannot test the prestige mechanism, the recruitment mechanism, or the crowding-out mechanism with these data, unfortunately). Moreover, another important caveat about these results is that NCS respondents had already decided to run for office. As a result, we don't have responses from people who were seriously considering running for office but who ultimately did not choose to enter the race. However, these data give us a picture of the types of concerns that candidates face when making the decision to throw their hats in the ring. Like our analyses of who runs and wins in states that pay more, our analysis of the concerns candidates expressed suggested that paying politicians more doesn't do much to reduce the barriers to seeking office for workers—and may make running more attractive to professionals.
SHOULD POLITICIANS GET A PAY RAISE?
In a recent story on a proposed salary hike for Arizona legislators, Blumberg (Reference Blumberg2014, 1) reports an interview with Morgan Cullen, a policy analyst for the National Conference of State Legislatures:
In states with low salaries, like Arizona, Cullen says many lawmakers are retirees or independently wealthy business owners who can afford to run. “You want those independently wealthy people, you want the retirees, but you also want people in their income-earning years as well so that you are representing the population as a whole.”
Reformers often argue that the low salaries paid in many of our political institutions ensure that only the wealthy can afford to run for office and that offering higher salaries would attract more middle- and working-class Americans.
Our analyses suggest that this line of reasoning doesn't hold much water. Data on the makeup of state legislatures in the late-1970s, the mid-1990s, and the late-2000s suggest that in states that offer leaders higher salaries, working-class politicians are actually crowded out by career political professionals. Likewise, surveys of the candidates who ran for state legislature in 2012 suggest that politicians from the working class—even those who identify as political professionals today—are no more likely to run, win, or run again in states that pay more. And blue-collar candidates aren't less likely to worry about their incomes in well-paying state legislatures. To the contrary, higher salaries don't seem to make political office more attractive to workers; they seem to make it more attractive to professionals who already earn high salaries. According to our data, paying politicians more doesn't seem to promote economic diversity.
Of course, our study has several important limitations that are worth reiterating. We only study one level and branch of American political institutions, state legislatures. We only examine the time periods for which we have appropriate data. We are only able to test one of the many mechanisms that might link politician compensation and working-class representation. And although we do our best to control for potential confounding variables, our analyses are based on observational data, with all the lurking problems that entails. Going forward, the empirical burden of proof would seem to be on those who maintain that paying politicians more would increase the representation of the working class—our study is the only one on this topic, and it doesn't find what reformers expect—but a great deal more work could still be done on this issue.
From the standpoint of research on politician salaries, the most important limitation of this study is that it only focuses on one political outcome—the numerical representation of different social classes—out of the many that might be linked to compensation rates. Politicians’ salaries are associated with whether they hold outside jobs, how productive they are in our legislatures, how in-step they are with their constituents, and whether they run for re-election. These are all important features of our political process that we have to consider and balance when answering questions about whether politicians should get a pay raise. For scholars interested in politicians’ salaries, this study provides a new piece of evidence about how salaries matter, but obviously salaries matter in many other ways.
A second important limitation from the standpoint of research on politicians' salaries is that this analysis is limited to the United States. Much of the recent research on officeholder compensation has been conducted using cross-national data. It is important to keep in mind that results from the United States states may not generalize to other countries or regions (for instance, the relationship between political compensation and working-class representation may be different in countries that have workers’ parties) and that follow-up work using cross-national samples is still needed before we can make generalizations about salaries and working-class representation outside of the United States.
For scholars interested in why so few working-class people hold political office in the United States, this study seems to rule out another potential culprit. Workers probably aren't to blame for being unqualified, voters probably aren't to blame for being biased against workers—and governments probably aren't to blame for paying politicians too little. It also suggests that resources may not be the only driver of class-based differences in officeholding. It's possible that working-class people are less likely to run for office because they simply have a harder time affording it, but it's also possible that they're less likely to run because they aren't interested in holding office or because they aren't recruited. (This hunch is squarely in line with the finding in Table 1 that more workers hold office in states with higher unionization rates and with prior research on unions and working-class representation.) Resources could still matter, of course—for instance, the loss of a salary while campaigning might be a far bigger impediment for working-class people than the salary offered while holding office. For scholars interested in explaining why the United States is run by a white-collar government, this study's findings suggest that there is far more to the story than politicians’ salaries—and maybe more than just resources alone.
Last, for reformers, the lesson of this study is straightforward. Activists and political observers should stop saying that raising legislative salaries would make holding office more accessible for middle- and working-class Americans or that it would reduce class-based political inequalities. It probably wouldn't.
APPENDIX: SUPPORTING INFORMATION
TABLE A1. Social Class Balance in the 2007 NCSL Dataset and the 2012 NCS Survey

Table A1 notes: To check that the data in the 2012 National Candidate Study were suitable for this analysis, we compared data on the percentage of working-class candidates among the candidates (third column) and winners (second column) in the NCS to the percentage of officeholders from the working class in the 2007 National Conference of State Legislatures data (first column). Although the samples were from different years, the percentage of workers in the 2007 NSCL dataset was positively correlated with the percentage of workers who won office in the 2012 NCS (as we report in bold at the bottom of the table), which suggests that the survey elicited responses from a representative sample of workers.
Importantly, however, the percentage of workers who held office in 2007 was not correlated with the percentage of working-class candidates in the National Candidate Study (third column), which increases our confidence that the response rate among workers was not endogenous to the outcome of interest (i.e., that workers were not more likely to respond to the survey in states where workers held office in larger numbers).
TABLE A2. Legislative Salaries and Working-Class Representation (with state controls)


FIGURE A1. Change in Legislative Salaries and Working-Class Representation in State Legislatures, 1979–2012
Table A5 notes: We obtained replication data for Silbermann (Reference Silbermann2015). Because her unit of analysis is the state legislative district, we created a mean distance to capital variable for each state. Moreover, because her study covers a more recent time period than ours, we could only match her distance to capital variable to one of our four years of observation (2007). This left us with a sample of just 47; her dataset omits Alaska, Hawaii, and Nebraska. When we added her distance variable as a control in Model 1, we found that a higher mean distance to the capital was associated with fewer workers in office (although the difference was not statistically significant) and that the relationship between salary and working-class representation was still negative (although not statistically significant, perhaps owing to the smaller sample size). When we added it as a control in Model 2, our results were similar.
TABLE A3. Relative Boost in Salary and Working-Class Representation

TABLE A4. Quadratic Model of Legislative Salaries and Working-Class Representation

TABLE A5. Legislative Salaries and Working-Class Representation, Controlling for Distance to the Capital

TABLE A6. Legislative Salaries and Working-Class Representation, Controlling for the Partisan Makeup of the Legislature

TABLE A7. Legislative Salaries and Working-Class Representation, Controlling for the Sophistication of State Party Organizations

TABLE A8. Legislative Salaries and Working-Class Representation, Controlling for Party Competition

TABLE A9. Legislative Salaries and Working-Class Representation, Controlling for Budget Size

TABLE A10. Legislative Salaries and Working-Class Representation, Controlling for Campaign Spending (2007 Only)


Comments
No Comments have been published for this article.