


Introduction
Hydrated sulfates are the most common and important minerals of evaporite deposits (Jena, Reference Jena2021). Kainite, KMg(SO4)Cl⋅2.75H2O (Zincken, Reference Zincken1865; Robinson et al., Reference Robinson, Fang and Ohya1972), is an essential potassium concentrator in this formation, as well as an important potassium ore along with sylvite KCl, carnallite KMgCl3⋅6H2O, langbeinite K2Mg2(SO4)3 and polyhalite K2Ca2Mg(SO4)4⋅2H2O (Spencer, Reference Spencer and Riibe2000; Babel and Schreiber, Reference Babel, Schreiber, Holland and Turekian2014; Jena, Reference Jena2021). As the most important potassium deposits are connected with evaporites, the flotation properties of potassium minerals, including complex potassium salts and kainite in particular, have been studied (Miller and Yalamanchili, Reference Miller and Yalamanchili1994; Hancer and Miller, Reference Hancer and Miller2000). Lately, much attention has been paid to the evaporite weathering processes (Censi et al., Reference Censi, Sposito, Inguaggiato, Venturi, Censi and Falcone2016), which are of essential ecological concern in the environment of salt-bearing deposits (Wang et al., Reference Wang, Guo, Xiu, Bauera, Sun, Tang and Norra2019); possible effects on climate changes have also been discussed recently (Warren, Reference Warren2010; Shields and Mills, Reference Shields and Mills2021). In addition, kainite is of interest for isotopic studies as it also contains both sulfur (Hryniv et al., Reference Hryniv, Parafiniuk, Peryt, Schreiber, Lugli and Bąbel2007) and chlorine (Eggenkamp et al., Reference Eggenkamp, Kreulen and Van Groos A.F.1995).
The K–Mg–SO4–Cl system has been studied thoroughly, including both thermodynamic and phase relationships (Jänecke, Reference Jänecke1912), as well as polythermic studies (Campbell et al., Reference Campbell, Downes and Samis1934; Eugster et al., Reference Eugster, Harvie and Weare1980; Abdel Wahed et al., Reference Abdel Wahed, Mohamed, El-Sayed, M'nif and Sillanpää2015). The phase relationships of kainite with other sulfate minerals of evaporites are listed in Braitsch (Reference Braitsch1971). The first pathway of kainite formation includes incongruent melting of carnallite, KMgCl3⋅6H2O, in MgSO4-bearing systems. This is the most important hypergenic process in transformations of potassium salts (Braitsch, Reference Braitsch1971). In these systems, carnallite melts below 72°C; in the presence of kieserite, MgSO4⋅H2O, the main reaction product is kainite. The second pathway is direct reaction of kieserite with sylvite in a NaCl solution. The kieserite–sylvite paragenesis in the MgSO4-bearing systems takes place above 72°C (Braitsch, Reference Braitsch1971). Yet, there exist two boundary conditions which need to be considered. The first one is excess kieserite which reacts with NaCl solution forming löweite and blödite. In their presence, kainite slowly dissolves with formation of leonite and ‘glazerite’ (aphtitalite) (Braitsch, Reference Braitsch1971). The second one is the presence of excess sylvite, which however can coexist with kainite. Further reaction with NaCl solution also leads to the formation of leonite and aphtitalite but not blödite (Braitsch, Reference Braitsch1971).
Kainite has also been detected among the products of interaction between fumarolic exhalations and moist air. For instance, in the fumaroles of Tolbachik volcano, Kamchatka, Russia, it is observed in the relatively low-temperature (50–150°C) sulfate–chloride zones which contain a variety of hydrated minerals. In the hotter (>200°C) sulfate–oxide zone, only anhydrous species are stable (Pekov et al., Reference Pekov, Zubkova, Belakovskiy, Lykova, Yapaskurt, Vigasina, Sidorov and Pushcharovsky2015). In respect of high-temperature mineral associations, there remains an open question of ‘anhydrokainite’ KMg(SO4)Cl (Jänecke, Reference Jänecke1912; Kassner, Reference Kassner1958 and references therein).
Several attempts have been made to prepare synthetic kainite doped by various magnetically active cations, namely Mn2+, Cu2+, Cr3+, VO2+, Co2+ and Ni2+ (e.g. Subramanian and Hariharan, Reference Subramanian and Hariharan1986; Narasimhulu et al., Reference Narasimhulu, Sunandana and Rao2000; Dhanuskodi and Jeyakumari, Reference Dhanuskodi and Jeyakumari2001, Reference Dhanuskodi and Jeyakumari2004; Rao et al., Reference Rao, Vedanand, Ravikumar, Ravikumar and Reddy1994), and their studies using nuclear magnetic resonance. Structural characterisation of sulfate anions in the structure of kainite were also supported by spectroscopic studies (Murthy et al., Reference Murthy, Srinivas, Dayanand and Salagram1992a, Reference Murthy, Srinivas, Dayanand and Salagram1992b; Salagram et al., Reference Salagram, Seetharam, Siddambary and Murthy1988, Reference Salagram, Madhukar, Murthy and Sunandana1994). In addition, natural kainite is a proper object for investigating crystal chemical behaviour of chloride anions which coordinate to cations, including high-pressure studies (Nazzareni et al., Reference Nazzareni, Comodi and Hanfland2018).
Despite numerous studies of kainite, its thermal expansion has not been investigated. The description of its thermal behaviour (Bish and Scanlan, Reference Bish and Scanlan2006) reports only decomposition points (60°C in vacuo and 80°C under ambient conditions), while the nature of decomposition products remains unaddressed (note the proposed ‘anhydrokainite’ which is also not characterised).
In the current study, we investigated the thermal behaviour of kainite using thermogravimetry methods (TG and DTG), differential scanning calorimetry (DSC), and variable-temperature powder X-ray diffraction (XRD). The thermal expansion of kainite was studied based on the XRD results in the –150°С to 50°С temperature range. These results are of particular interest as they cover natural terrestrial conditions, including those in rich evaporite deposits.
According to the International Mineralogical Association approved list of minerals (Pasero, Reference Pasero2022), the formula of kainite is KMg(SO4)Cl⋅3H2O. The crystallochemically correct formula is KMg(SO4)Cl⋅2.75H2O, based on the refined water content (Robinson et al., Reference Robinson, Fang and Ohya1972). Our results (vide infra) confirm the latter formulation. Therefore, we propose KMg(SO4)Cl⋅2.75H2O as the most correct one.
It is worth noting that kainite may exist also on the Martian surface in the Gusev crater (Rice et al., Reference Rice, Bell, Cloutis, Wang, Ruff, Craig, Bailey, Johnson, De Souza and Farrand2010). The results of thermal studies of kainite may be helpful in understanding the behaviour of the compound analogous to the extra-terrestrial one. Note that the surface temperature of Mars varies from –150°С to 10–20°С (Barlow, Reference Barlow2008, and references therein). The temperature range in our study partially overlaps with the latter.
Experimental
Sample description
The sample of kainite studied originates from the old potassium salt deposit Wilhelmshall located near the city of Halberstadt, Saxony-Anhalt, Germany. The material for studies was separated from a transparent, colourless tabular large (1.5 cm × 4 cm × 5 cm) single crystal of kainite collected in the first quarter of the 20th Century from the underground mine.
Electron microprobe study
Semi-quantitative electron-microprobe analysis (EMPA) was carried out using a JXA 850A scanning electron microscope equipped with a LINK 1000 energy-dispersive spectrometer. The energy dispersive spectroscopy mode was used, with an acceleration voltage of 20 kV, a beam current of 2 nA and a 5 μm beam diameter. The EMPA data showed the presence of significant amounts of K, Mg, S, Cl and O in the mineral. Contents of other elements with atomic numbers higher than that of oxygen are below their detection limits.
Single-crystal studies
The crystals of kainite were examined under an optical microscope and a suitable one selected and mounted on glass fibre for the data collection. The single-crystal X-ray data collection was carried out using a XtaLAB Synergy diffractometer with a micro-focus sealed X-ray tube (CuKα radiation) operating at 50 kV and 1.0 mA in an ambient N2 atmosphere at 100 K, with frame widths of 0.5° and a 0.15–0.40 s count for each frame (based on calculated strategy). The data were integrated and corrected by means of the CrysAlisPro 1.171.41.103a (Rigaku, 2021) program package, which was also used to apply an empirical absorption correction using spherical harmonics, as implemented in the SCALE3 ABSPACK scaling algorithm. The SHELXL program (Sheldrick, Reference Sheldrick2015) was used for the crystal-structure refinement. The structure was refined to R 1 = 0.023 for 3080 unique observed reflections with |F o| ≥ 4σF. All experimental details are given in Table 1. The crystallographic information files have been deposited with the Principal Editor of Mineralogical Magazine and are available as Supplementary material (see below).
Table 1. Crystallographic data and refinement parameters for studied kainite.

As an initial structure model, the atomic coordinates of K, Mg, S, Cl and O atoms were taken from Robinson et al. (Reference Robinson, Fang and Ohya1972). All of the subgroups of the C2/m space group were tried but none of them led to better refinement results for the positions of hydrogen atoms than those reported below. All H atoms were located from the analysis of difference-Fourier electron density maps and were refined with the imposed O–H distance restraints of 1.00 ± 0.005 Å and for H2a–H2b with restraints of 1.65 ± 0.05 Å. The isotropic displacement parameters for hydrogen atoms were held constant at 0.065 Å2. H1B⋅⋅⋅H5B and H2B⋅⋅⋅H4B distances are relatively short, whereas their elongation and restraining result in strong distortions of the geometry of the water molecules. A slightly larger U eq value for the Ow7 atom of the water molecule (Table 2) can be explained by the fact that it belongs to the interstitial (H2O)0 group.
Table 2. Coordinates and atomic displacement parameters (Å2) of non-hydrogen atoms in the crystal structure of kainite.

Density functional theory calculations
Density functional theory (DFT) calculations on the equilibrium structure of kainite were undertaken utilising the Projector Augmented Wave method (PAW) as implemented in the pseudopotential Vienna Ab initio Simulation Package (VASP) code (Kresse and Joubert, Reference Kresse and Joubert1999; Kresse and Furthmüller, Reference Kresse and Furthmüller2017). Constrained structure optimisation was performed, retaining the unit cell metrics and allowing full atomic coordinate relaxation. To accommodate the procedure, an experimentally established structure was transformed to the P1 space group and used as a starting model. The MetaGGA-type SCAN exchange-correlation functional (Sun et al., Reference Sun, Ruzsinszky and Perdew2015) was used in the calculations. The energy cut-off was set at 500 eV with a 6 × 6 × 12 gamma-centred k-point mesh used for Brillouin zone sampling. The convergence criterion for the procedure was set at 5×10⁻³ meV. Optimised coordinates of the hydrogen atoms are compared to those derived from the XRD experiment in Table 3. The geometrical parameters of the experimentally and theoretically derived hydrogen bonding systems are compared in Table 4. In fact, very good agreement between the XRD data and DFT calculations was achieved, which is emphasised by the fact that even calculated hydrogen atom positions, which contribute the least to the total energy, matched the experimental ones very closely. This fact proves our model to be correct. Minor differences between the XRD and DFT results can be assigned to the effect of temperature, as nominal temperature for the results of the DFT calculations is 0 K and the temperature used for the XRD measurements was 100 K.
Table 4. Hydrogen bonding distances (d in Å) and angles (°) in kainite (D – donor, A – acceptor).

Symmetry codes: (i) –x, –y+1, –z+1; (ii) –x, –y, –z+1; (iii) –x+½, –y+½, –z+1; (iv) x, y, z+1.
Table 3. Coordinates of the H sites in the crystal structure of kainite determined by X-ray diffraction (XRD) analysis and density functional theory (DFT) calculations.

Infrared spectroscopy
The infrared (IR) spectrum of kainite was acquired on a Bruker Vertex 70 FTIR spectrometer in the 370–4000 cm–1 wavelength range (4 cm–1, 32 scans). The powdered sample was mixed with preheated potassium bromide (Sigma-Aldrich, >99.0%) and pressed into a pellet. A similar pellet of pure KBr was used as a reference.
Variable-temperature powder X-ray diffraction
The XRD patterns were registered on a Rigaku Ultima IV powder diffractometer (Rigaku R–300 camera, CuKα radiation for the temperature range –150°C to 50°C and Rigaku HTA 1600 camera, CoKα radiation for the 50°C–600°C range, linear PSD detector). The sample was ground thoroughly, suspended in dry heptane, and transferred onto a Pt–Rh holder. The heating rate was 2°C/min. Phase analysis was performed based on the PDF–2 database (powder diffraction file from the International Centre for Diffraction Data, http://www.icdd.com/, accessed 2020), and PDXL (Rigaku, 2016) and TOPAS V.5.0 (Bruker, Reference Bruker2014) suites. Thermal expansion of kainite was calculated using the Theta-To-Tensor (Bubnova et al., Reference Bubnova, Firsova and Filatov2013) program suite. As different wavelengths were employed in temperature intervals, the powder XRD patterns (Fig. 7) are plotted as I vs. d –1 (Å–1).
Thermal analysis and mass-spectroscopy
The thermal behaviour of the kainite sample was also investigated on a NETZSCH STA 429 CD thermal analyser using TG+DSC sample holders and Pt/Pt-Rh thermocouples (S type). Heating was performed from 35°С to 600°С, while cooling was from 550°С to 200°С with a ramp of 10°C/min in an air flow (50 ml/min). The sample was ground and pressed into a pellet (1 kgf/mm2). The initial sample weight was 25.23 mg. The pellet was placed in an open alumina crucible. The TG (%) and DSC (mW/mg) data were recorded simultaneously. The sample was photographed in situ before and after the heating/cooling cycle.
Results and discussion
Infrared studies
The IR spectrum of the kainite sample is depicted in Fig. 1; it virtually coincides with that registered in Chukanov (Reference Chukanov2014) for a kainite sample from the type locality. The spectrum contains bands corresponding to the vibrations of sulfate groups and water molecules. Their positions (in cm–1) and assignments are the following: 3473, 3352, 3252 and 3125 [stretching O–H vibrations of water molecules H2O]; 2200 [proton shift from water molecule to the sulfate anions with formation of HSO4–]; 1645 [bending vibrations of H2O molecules]; 1460 [possibly, bending vibrations of admixed NH4+ cations]; 1175 and 1129 [ν3(F 2) asymmetric vibrations of SO42–]; 1022 [ν1(A 1) symmetric vibrations of SO42–], 906, 790 and 755 [H2O and OH libration modes]; 643, 609 and 575 [ν4(F 2) of SO42–]; 525, 467, 450 and 414 [Mg–O stretching vibrations, ν2(E) SO42–, and lattice modes involving translation of K+, Cl– and SO42– as a whole].

Fig. 1. Infrared (IR) spectra of kainite studied from (a) Wilhelmshall and (b) from its type locality, Brefeld, Tarthun, Stassfurt potash deposit, Saxony-Anhalt, Germany (Chukanov, Reference Chukanov2014).
Crystal structure
The crystal structure of kainite was first determined in Robinson et al. (Reference Robinson, Fang and Ohya1972). Our refinement allowed us to localise the positions of hydrogen atoms which play an essential role in the structure formation. Refined atomic coordinates are given in Table 2; Supplementary Table S1 lists the bond-valence sums calculated using parameters given in Gagné and Hawthorne (Reference Gagné and Hawthorne2015).
The kainite structure (Fig. 2a) can be considered as based on kröhnkite-like chains (Fig. 2b) (Hawthorne et al., Reference Hawthorne, Burns, Krivovichev and Riibe2000; Fleck et al., Reference Fleck, Kolitsch and Hertweck2002), comprised of Mg4O4(H2O)2 octahedra (Fig. 3) linked by S1O4 and S2O4 sulfate tetrahedra and stretched along c. The chains are linked by Mg1O4(H2O)2 and Mg2O4(H2O)2 species to form layers (Fig. 2c) parallel to (100). Further linkage via Mg3O2(H2O)4 assembles these layers into a porous framework. The Mg1, Mg2 and Mg4 adopt the trans-MgO4(H2O)2 coordination with a basal plane formed by sulfate oxygens and apical vertices, by water molecules. The Mg3 atom is coordinated by two sulfate oxygens and four water molecules. The average Mg–O distances (Table 5) for all MgOn(H2O)m octahedra lie in the range 2.057–2.078 Å which is in a good agreement with the value of 2.089 Å given by Gagné and Hawthorne (Reference Gagné and Hawthorne2016). The sulfate tetrahedra are close to regular and the mean S–O distances of 1.473 and 1.475 Å for S1 and S2, respectively, almost coincide with the statistical data for sulfates (Hawthorne et al., Reference Hawthorne, Burns, Krivovichev and Riibe2000; Gagné and Hawthorne, Reference Gagné and Hawthorne2018). The cavities of the framework also host three independent potassium sites of which K1 and K2 adopt a similar KO4Cl4 coordination with the mean values of 2.856 and 2.810Å (K–O) and 3.291 and 3.173 Å (K–Cl) for K1 and K2 (Fig. 3). The K3 site has a different coordination: KO5(H2O)3Cl. Based on the description of the crystal structure of kainite given above, we suggest the following crystal chemical formula – K[Mg(H2O)2.5(SO4)]Cl⋅(H2O)0.25. The brackets designate the formula of the framework.

Fig. 2. Crystal structure of kainite along the b axis (a). Kröhnkite-type chains (b) (highlighted by the red dotted line) form layers (c) further interconnected via Mg-centred polyhedron into framework. Thermal expansion tensor of the structure of kainite (d), and its compressibility tensor (e) (after Nazzareni et al., Reference Nazzareni, Comodi and Hanfland2018).

Fig. 3. Coordination of cations in the crystal structure of kainite. All interatomic distances are given in Å. Atomic displacement parameters for ellipsoids are drawn at the 50% probability level.
Table 5. Selected interatomic distances (Å) in kainite.

Hydrogen bonding
The structure of kainite contains seven symmetrically independent sites occupied by water molecules (Fig. 4). Ow1, Ow2, Ow3, Ow4, Ow5 and Ow6 water molecules are strongly bonded to Mg2+ cations while the Ow7 site resides in the framework cavities. Structural details of the hydrogen bond system are collected in Table 4. The interactions with separations of H⋅⋅⋅A < r(A) + 2 Å and <DHA (D = donor and A = acceptor) above 110° were taken into consideration (Steiner, Reference Steiner2002).

Fig. 4. Environments of the all water molecules in the crystal structure of kainite. Hydrogen D–A bonds are shown by blue dotted lines.
The acceptors of the hydrogen bonds are either chloride anions, neighbouring water molecules or oxygens of sulfate groups (Table 4, Figs 4, 5). The Ow1 water molecule coordinating the Mg2 atom (Fig. 4a) forms only one hydrogen bond through the H1a atom to Cl1 acceptor with the interatomic distance 2.388 Å and the D–H⋅⋯A angle 177°. The D–H⋅⋯A angle for H1b and Ow5 as a potential acceptor is 109° and does not meet the criteria for hydrogen bonding mentioned above. The Ow2 molecule has a somewhat similar environment (Fig. 4b). The hydrogen atom H2a forms a moderate hydrogen bond to the interstitial Ow7 water molecule. Atom H2b was also excluded from the hydrogen bonding system because of the aforementioned criteria – the Ow2–H2b⋅⋯Ow4 angle is 105°. The Ow3 water molecule (Fig. 4c) also forms a moderate hydrogen bond via the H3b to Cl2 acceptor.
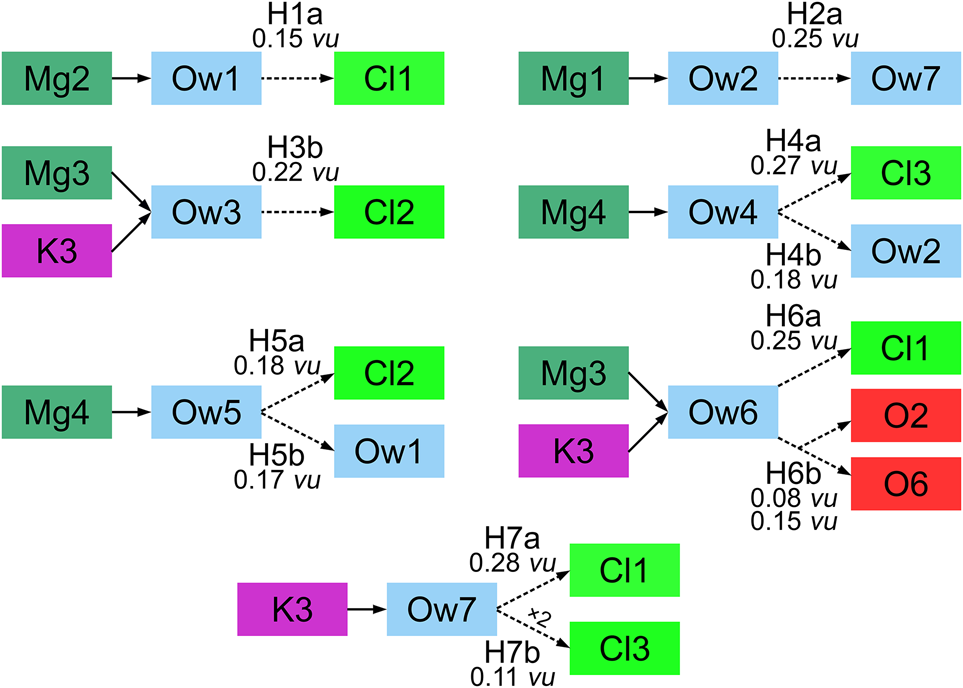
Fig. 5. Schematic representation of hydrogen bonding in kainite.
Both Ow4 and Ow5 water molecules (coordinating Mg4-centered polyhedron) have a similar coordination environment (Figs 4a,b, 5) with both H atoms participating in the hydrogen bonding system. The H4a atom, as well as H5a, have chlorine atoms as acceptors with distances of 2.076 Å for H4a⋅⋯Cl3 and 2.303 Å for H5a⋅⋯Cl2, and bond-valence values of 0.27 and 0.18 valence units, respectively. Atoms H4b and H5b also form moderate hydrogen bonds with the neighbouring water molecules (Ow2 and Ow1) with comparable D–H⋅⋯A angles of 168° and 165°, and H⋅⋯A bond distances of 1.826 and 1.858 Å, respectively.
The H6a atom of the Ow6 water molecule (Fig. 4c) forms a hydrogen bond with Cl1, with the interatomic distance 2.109 Å and D–H⋅⋅⋅A angle 174°. The H6b atom is involved in a typical three-centred asymmetric hydrogen bond, i.e. bifurcated bond (Rozas et al., Reference Rozas, Alkorta and Elguero1998). The H6b forms two H6b⋅⋅⋅A bonds to O6 and O2 acceptors with bond distances 1.928 and 2.29 Å, respectively (Fig. 4c), the D–H⋅⋅⋅A angles are in the range of 121–150°, and the A⋅⋅⋅H⋅⋅⋅A angle has a value of 83°. Rozas et al. (Reference Rozas, Alkorta and Elguero1998) reported that hydrogen bonds become longer in the three-centred type compared to the regular ones, due to the equal sharing of electron density between the H atom and two acceptors. A very sensitive criterion for confirming a three-centred character of hydrogen bonds has been proposed by Taylor et al. (Reference Taylor, Kennard and Versichel1984). This criteria comprises the fact that the hydrogen atom is within 0.2 Å out of the plane defined by D, A and A'. In our case, this value is 0.19 Å.
The water molecule Ow7 is not connected to any of the MgOn(H2O)m octahedra (Fig. 4d). According to Hawthorne (Reference Hawthorne1992), the Ow7 molecule can be described as an interstitial (H2O)0 group, bonded to an interstitial cation (potassium). The H7a atom forms a hydrogen bond to Cl1 with a D–H⋅⋅⋅A angle of 177° and H⋅⋅⋅A distance of 2.066 Å. The H7b hydrogen forms weak symmetrical hydrogen bonds with two Cl3 atoms as acceptors with a distance of 2.560 Å and D–H⋅⋅⋅A angle of 133.3°.
Thermogravimetry and differential scanning calorimetry
The results of TG methods (thermogravimetry, TG and differential thermogravimetry, DTG) and DSC studies along with mass spectrometry at m/z = 18 are represented in Fig. 6. The TG and DTG curves exhibit several stages of mass loss. Between 77 and 178°С, the DSC shows a noticeable endothermal effect with a maximum at 155°С which corresponds to a 4.34% mass loss on TG and DTG and can be attributed to the removal of the interstitial Ow7 molecule providing (H2O)0.25 per formula of kainite. The Ow7 water molecule gives 4.50 wt.% to the molecular mass of kainite. The ionic current (IC) at m/z = 18 shows a distinct maximum indicating the presence of water vapour in the decomposition products. This endothermal effect is characterised by an absorbed heat of 91.89 J/g. The next, stronger event is observed in the 178–274°С range with a maximum at 222°С which corresponds to the mass loss of 15.18%. The IC curve shows another strong maximum corresponding to release of water vapours. The energetic effect is 323.31 J/g. The overall water loss is 19.52%, whereas the theoretical value for KMg(SO4)Cl⋅2.75H2O is 20.27%.

Fig. 6. TG, DSC and IC curves for kainite and in situ photographs of the sample before (left) and after (right) heating/cooling cycle. Note the colour change of the probe during the experiment, as well as the decrease of the size of the tablet.
Between 274 and 320°С the DSC curve exhibits a symmetric exothermal effect with the maximum at 299°С while the TG and IC curves remain featureless. This suggests that a phase transformation is likely to proceed, most probably crystallisation from amorphous or metastable precursors. The effect is characterised by energy of 14.75 J/g.
Between 451 and 560°С, the DSC curve features an endothermal effect with a maximum at 494°С, which is accompanied by a small and long mass loss. This might be caused by melting and slight decomposition. The energy of this effect is 19.48 J/g.
Further heating from 560 to 600°С is characterised by a featureless DSC curve while TG and DTG reflect the last smeared step of mass loss. The IC curve was also featureless which indicates that the decomposition products have probably condensed above 195°С before entering the quadrupole mass spectrometer.
Upon cooling from 600 to 200°С the TG curve shows weak mass losses down to 395°С, while DSC indicates a strong exothermal effect between 417 and 395°С centred at 412°С, probably crystallisation of the melt. The energetic effect is 11.72 J/g.
Thermal evolution of kainite
Variable-temperature powder XRD patterns (Fig. 7) were registered with a step of 5°C between –150°С and 90°С, and with a step of 10°C between 90°С and 600°С.

Fig. 7. Evolution of the powder diffraction patterns of kainite as a function of temperature (red circles – kainite, black – KCl, green – K2SO4 and blue – langbeinite)
Between –150°С and 200°С the patterns contain the diffraction maxima of kainite though the trend in their relative position changes abruptly at ~100°C. This can be correlated with the mass loss effect at 155°C (considering the different heating rates for the variable temperature powder XRD and DSC/DTA/MS runs), which corresponds to ca. –10.2 g/mol kainite and can be associated roughly with a loss of 0.65–0.75H2O. At 200°С, further dehydration causes amorphisation until re-crystallisation starts at ca. 280°С. From this point on, langbeinite K2Mg2(SO4)3 (Mereiter, Reference Mereiter1979) is formed which persists until the highest temperature (600°С) Potassium chloride (Lesly Fathima et al., Reference Fathima A., Sivananthan, Somasundari and Neelakandapillai2012) is observed between 340°С and 560°С, which is replaced by α-K2SO4 (Arnold et al., Reference Arnold, Kurtz, Richter-Zinnius, Bethke and Heger1981).
The first loss of water is associated with a distinct shift of the diffraction maxima of kainite which is observed from 110°С and persists until 180°С (before full amorphisation of the sample). In the meantime, no such shift is observed for the benchmark reflections of the Pt-Rh holder. It is most likely that this shift is caused by loss of some water while the overall structure motif is retained. Unfortunately, the quality of the XRD patterns (particularly the broad lines due to lowered crystallinity) did not permit us to investigate the structural changes which mainly concern the weakest scatterers (O and H). Interstitial Ow7 water molecules are released first. The loss of water and increasing temperature are expected to influence the unit-cell volume in the opposite directions which is manifested by the shift of diffraction maxima. One may speculate that the hypothetical ‘anhydrokainite’ might actually correspond to the partially dehydrated kainite, or KMg(SO4)Cl⋅(2±δ)H2O (where δ ≈ 0.1).
The total dehydration results in decomposition of kainite and formation of an amorphous sample that crystallises into synthetic langbeinite and, at higher temperatures, potassium chloride. The tentative reaction at the first step might be written as 3KMg(SO4)Cl⋅2.75H2O → 8.25H2O↑ + K2Mg2(SO4)3 + KMgCl3 (or KCl + MgCl2). While magnesium chloride is rather sensitive to the thermal hydrolysis, its thermal behaviour in the presence of alkali chlorides is more complex and hydrolysis is somewhat retarded or even suppressed (Shoval and Yariv, Reference Shoval and Yariv1985; Shoval et al. Reference Shoval, Yariv, Kirsch and Peled1986). Unfortunately, this behaviour has been studied only by DTG and IR spectroscopy, and it was not reported whether the intermediate products are amorphous or crystalline. The effect at 475°C reported for KMgCl3 which might correspond to crystallisation (Shoval and Yariv, Reference Shoval and Yariv1985) was not observed in our study. Yet, successive formation of KCl and K2SO4 indicates that further exchange processes take place, probably with participating amorphous intermediates, after full decomposition of the initial kainite. In a test experiment, preheated KCl and anhydrous MgSO4 were annealed in a silica-jacketed alumina crucible at 700°C; large high-quality crystals of synthetic langbeinite were the main product.
The thermal expansion of kainite was studied between –150°С and 50°С wherein the composition KMg(SO4)Cl⋅2.75H2O is retained. According to the expansion tensor, the largest expansion is observed along α33, while the smallest is along α11, both direction lying in the ac plane. The angles of shear deformation are μс = 47.4° for T = –150 to –65°С; μс = 47.5° for T = –60 to 50°С (μс = c^α33, the angle between the c axis of the unit cell and α33 axis of the tensor in the ac plane).
It is seen from Fig. 8 that thermal expansion along c is less pronounced compared to a and b. This can be explained keeping in mind that this direction more or less coincides with those of the kröhnkite chains which are relatively rigid. All parameters increase with temperature, according to the equations:
-
a = 19.73792(86) + 0.414(11) × 10–3 T (Å)
-
b = 16.22965(85) + 0.382(12) ×10–3 T (Å)
-
c = 9.53220(48) + 0.2680(64) × 10–3 T (Å)
-
β = 94.9279(37) + 0.444(49) × 10–3 T (°)
-
V = 3042.18(23) + 217(3) × 10–3 T (Å3)
The behaviour the thermal expansion tensor is typical for monoclinic crystals (Filatov et al., Reference Filatov, Andrianova and Bubnova1984) exemplifying the shear thermal deformations which cause the change of the β angle, according to the equation αβ = (1/β)/(dβ/dT).

Fig. 8. Temperature dependences of the unit-cell parameters and volume for kainite
Concluding remarks
The thermal studies of kainite KMg(SO4)Cl⋅2.75H2O in the temperature range of –150 to 600°C indicate its stability until 190°C, which generally agrees with the results of Bish and Scanlan (Reference Bish and Scanlan2006). The decomposition products are K2Mg2(SO4)3 (Mereiter, Reference Mereiter1979), KCl (Lesly Fathima et al., Reference Fathima A., Sivananthan, Somasundari and Neelakandapillai2012) and K2SO4 (Arnold et al., Reference Arnold, Kurtz, Richter-Zinnius, Bethke and Heger1981).
As noted above, there remains an unanswered question connected with kainite, namely the possible existence of its anhydrous analogue, ‘anhydrokainite’ KMg(SO4)Cl. This question was addressed several times in the previous century (Jänecke, Reference Jänecke1912; Kassner, Reference Kassner1958 and references therein). To handle it properly from the crystal chemical viewpoint, it is necessary to compare kainite with some chemically related minerals. However, now it is a unique representative of hydrous sulfate chlorides of Group 1 to Group 2 elements. Therefore, these comparisons are possible only with chemically more distant and well characterised species. Note that no structural, or even X-ray data, were reported for the crystals of the claimed-to-be zinc analogue of kainite (Narasimhulu et al., Reference Narasimhulu, Sunandana and Rao2000); given the high solubility of zinc halides and relatively low solubility of picromerite-like double sulfates, the identity of crystals grown from solution needs further verification. According to Narasimhulu et al. (Reference Narasimhulu, Sunandana and Rao2000), partial substitution of Cu2+ for Zn2+ results in formation of two crystallographically distinct paramagnetic centres which does not correlate with the presence of four symmetrically independent Mg2+ sites in the structure of kainite. Our attempts to grow crystals of any Zn-bearing kainite analogues from aqueous solutions were not successful. In the meantime, zinc contributes to a formal analogue of ‘anhydrokainite’, namely belousovite KZn(SO4)Cl (Siidra et al., Reference Siidra, Nazarchuk, Lukina, Zaitsev and Shilovskikh2018). However, the coordination of Zn2+ in its structure is tetrahedral which is uncommon for Mg2+ and has not been reported in sulfate minerals to date.
Considering the important role of hydrogen bonds, and chlorine in particular as their acceptor, in the structures of hydrous minerals, it is of interest to compare details with a few other hydrated sulfate chloride minerals and kainite. These structures can be quite conveniently described in terms of structural units and interstitial complexes (Hawthorne, Reference Hawthorne2015): adranosite (NH4)4NaAl2(SO4)4Cl(OH)2 (Demartin et al., Reference Demartin, Gramaccioli and Campostrini2010) and gordaite NaZn4(SO4)(OH)6Cl⋅6H2O (Zhu et al., Reference Zhu, Seff, Witzke and Nasdala1997). In both of these minerals chloride contributes to the components of structural units (infinite ⋅⋅⋅Na–Cl–Na–Cl⋅⋅⋅ chains in adranosite and coordination environment of Zn in gordaite). In the case of adranosite the large cavities occupied by nine-coordinated NH4+ ions, and chlorine from structural unit acts as an acceptor for hydrogen bonding. In the structure of gordaite the zinc hydroxide layers are held together by a system of hydrogen bonds from the hexaaquo Na+ ions to oxygen and chlorine atoms from the structural unit.
The structure of kainite exhibits some particularities. Chloride is not coordinated to magnesium, hence it does not contribute to the formation of structural units, but rather bonds to potassium cations within interstitial complexes. The major role of the chloride anions in the structure of kainite is accepting hydrogen bonds from various water molecules. As a result, we observe a complex network of hydrogen bonds, including not only the regular hydrogen bonds, but also three-centre and symmetric ones. Therefore, the hypothetical anhydrous compound KMg(SO4)Cl, if it exists, would be highly likely to adopt a quite different arrangement. However, the kainite structure probably tolerates loss of ca. 30% of water molecules; therefore, the ‘anhydrokainite’ might actually be this partially dehydrated species. It is also possible that the amorphous intermediate obtained at ~200°C might have become crystalline over a long time, which is very much possible under natural conditions.
Acknowledgements
The authors are grateful to Sabrina Nazzareni, Peter Leverett and two anonymous reviewers for their valuable comments on this paper. Technical support by the SPbSU X-ray Diffraction Resource Center is gratefully acknowledged. We are also grateful to Daria Spiridonova for the help with single-crystal X-ray data collection and Nikita Chukanov for the discussion of IR spectra. A.S.B. and V.L.U were supported by the Russian Ministry of Science and Education (task No. 0081-2022-0002 and task No. 0081-2022-0008).
Supplementary material
To view supplementary material for this article, please visit https://doi.org/10.1180/mgm.2021.101


