


INTRODUCTION
High-elevation watersheds in the Rocky Mountains accumulate snow vital to supplying water year-round in the western United States (Serreze et al., Reference Serreze, Clark, Armstrong, McGinnis and Pulwarty1999; Barnett et al., Reference Barnett, Adam and Lettenmaier2005). Both temperature and precipitation control the depth and persistence of snowpack, which can linger into late summer and early fall in high-elevation areas (Stewart et al., Reference Stewart, Cayan and Dettinger2004; Barnett et al., Reference Barnett, Adam and Lettenmaier2005). Understanding the full spectrum of temperature and precipitation changes in the past 2500 yr, therefore, will help to contextualize current and projected climate changes in the snow-dominated areas of the Rocky Mountain region. Hemispheric and continental temperature reconstructions indicate changes of ~0.5°C during recent millennia with warming during the Medieval Climate Anomaly (MCA; 1200–850 cal yr BP) and cooling during the Little Ice Age (LIA; 500–100 cal yr BP) (Mann et al., Reference Mann, Zhang, Rutherford, Bradley, Hughes, Shindell, Ammann, Faluvegi and Ni2009; Trouet et al., Reference Trouet, Diaz, Wahl, Viau, Graham, Graham and Cook2013), but the paleoclimate history of the southern Rocky Mountains, which includes the mountain ranges around the Continental Divide in southern Wyoming, Colorado, and northern New Mexico, could meaningfully differ from the hemispheric mean for multiple reasons. At continental to local scales, important dynamics could incorporate variability in the jet stream and the position of high- and low-pressure systems, regional subsidence and moisture availability, and local sensitivities to orographic uplift and other topographically modulated processes (Mock, Reference Mock1996; Shinker, Reference Shinker2010).
Consequently, the long-term history of the snowpack and climate of the southern Rocky Mountains can elucidate potential climate risks that extend beyond annual to centennial scales (e.g., Cook et al., Reference Cook, Woodhouse, Eakin, Meko and Stahle2004, Reference Cook, Seager, Cane and Stahle2007, Reference Cook, Seager, Heim, Vose, Herweijer and Woodhouse2010; Pederson et al., Reference Pederson, Gray, Woodhouse, Betancourt, Fagre, Littell, Watson, Luckman and Graumlich2011). Tree rings document substantial snowpack changes (Pederson et al., Reference Pederson, Gray, Woodhouse, Betancourt, Fagre, Littell, Watson, Luckman and Graumlich2011) and show that drought affected more land area in western North America from 1050 to 650 cal yr BP than at any other time in the past 1200 yr (Cook et al., Reference Cook, Woodhouse, Eakin, Meko and Stahle2004, Reference Cook, Seager, Cane and Stahle2007). Some lake oxygen isotope records (Anderson et al., Reference Anderson, Brunelle and Thompson2015) and macrofossil evidence of treeline changes (Jiménez-Moreno and Anderson, Reference Jiménez-Moreno and Anderson2012) provide evidence of Common Era cooling. However, temperature reconstructions from western North America do not consistently show LIA cooling (Viau et al., Reference Viau, Ladd and Gajewski2012; Reinemann et al., Reference Reinemann, Porinchu, MacDonald, Mark and DeGrand2014). Indeed, MCA warming and LIA cooling are not significant in continental-scale reconstructions given their uncertainty (Viau et al., Reference Viau, Gajewski, Sawada and Fines2006; Trouet et al., Reference Trouet, Diaz, Wahl, Viau, Graham, Graham and Cook2013), and the western United States subsets of the North American reconstruction show regional trends that differ from the continental mean patterns (Viau et al., Reference Viau, Ladd and Gajewski2012). Instead of tree rings, lake sediment and speleothem records of the Common Era emphasize hydroclimate changes in western North America that may extend to millennial scales (Rodysill et al., Reference Rodysill, Anderson, Cronin, Jones, Thompson, Wahl and Willard2018; Shuman et al., Reference Shuman, Routson, McKay, Fritz, Kaufman, Kirby, Nolan, Pederson and St-Jacques2018).
Evidence of long-term paleoclimate trends in the southern Rocky Mountains comes from lake-level reconstructions, stable oxygen isotope records, and macrofossil and pollen stratigraphies (Rodysill et al., Reference Rodysill, Anderson, Cronin, Jones, Thompson, Wahl and Willard2018; Shuman et al., Reference Shuman, Routson, McKay, Fritz, Kaufman, Kirby, Nolan, Pederson and St-Jacques2018). Lake-level changes inferred from stratigraphic evidence for shifts in shoreline position indicate a regional increase in water levels during the Common Era (Shuman et al., Reference Shuman, Henderson, Colman, Stone, Fritz, Stevens, Power and Whitlock2009, Reference Shuman, Carter, Hougardy, Powers and Shinker2014; Minckley et al., Reference Minckley, Shriver and Shuman2012). Oxygen isotopes in carbonate lake sediment may also indicate increased winter precipitation from the MCA to the LIA (Anderson, Reference Anderson2011), although a decrease in temperature (Anderson et al., Reference Anderson, Brunelle and Thompson2015), enhanced lake evaporation (Anderson, Reference Anderson2012), or shifts in atmospheric circulation (Anderson et al., Reference Anderson, Berkelhammer and Mast2016b) may all have contributed to the isotopic changes. Composite moisture reconstructions indicate a wetting trend in the southern Rocky Mountains during the Common Era (Rodysill et al., Reference Rodysill, Anderson, Cronin, Jones, Thompson, Wahl and Willard2018; Shuman et al., Reference Shuman, Routson, McKay, Fritz, Kaufman, Kirby, Nolan, Pederson and St-Jacques2018).
Few quantitative pollen-based climate reconstructions exist from western North America (Viau et al., Reference Viau, Gajewski, Sawada and Fines2006, Reference Viau, Ladd and Gajewski2012; Carter et al., Reference Carter, Brunelle, Minckley, Shaw, DeRose and Brewer2017, Reference Carter, Shinker and Preece2018; Ladd et al., Reference Ladd, Viau, Way, Gajewski and Sawada2018), but quantitative pollen-based reconstructions contain reproducible signals of temperature and hydroclimate variability in eastern North America (Shuman and Marsicek, Reference Shuman and Marsicek2016; Shuman et al., Reference Shuman, Marsicek, Oswald and Foster2019). Fossil pollen assemblages from high-elevation sites in the southern Rocky Mountains display significant and reproducible changes over the past 2500 yr that may represent responses to western climate changes (Calder and Shuman, Reference Calder and Shuman2017; Calder et al., Reference Calder, Stefanova and Shuman2019). For example, fossil pollen assemblages from Summit Lake, a small pond on the Continental Divide in northern Colorado, show a linear relationship to a sedimentary δ18O record from Bison Lake, a small lake approximately 100 km away (Calder and Shuman, Reference Calder and Shuman2017; Anderson, Reference Anderson2011). A decline in conifer pollen percentages at Summit Lake and other nearby sites after the MCA appears consistent with the formation of open forest types associated with extensive snow drifting, particularly during the LIA (Calder and Shuman, Reference Calder and Shuman2017; Calder et al., Reference Calder, Stefanova and Shuman2019). However, as noted earlier, δ18O can be difficult to interpret in isolation from other paleoclimate proxies, because changes in temperature, precipitation, evaporation, and atmospheric circulation can all influence the isotopic signal (Leng and Marshall, Reference Leng and Marshall2004). Quantitatively reconstructing the climate history from the fossil pollen records, therefore, can help to constrain interpretations of the various records and resolve the major regional climate trends of the Common Era. We reconstruct temperature and precipitation over the past 2500 yr with a specific focus on the Common Era because of broad interest in the time period.
To reconstruct temperature and precipitation over the past 2500 yr, we produced quantitative climate reconstructions using the modern analog technique (MAT; Overpeck et al., 1985; Williams and Shuman, Reference Williams and Shuman2008) based on fossil pollen assemblages from Summit Lake and other sites in northern Colorado's Park Range, which is the snowiest portion of the southern Rocky Mountains (Calder et al., Reference Calder, Stefanova and Shuman2019). After evaluating the ability of the MAT to predict modern climates, we chose to reconstruct mean annual temperature, annual precipitation, winter precipitation, and summer precipitation based on fossil pollen preserved in the sediments of six high-elevation lakes. To focus our reconstructions on high-elevation climates, we excluded pollen transported long distances by wind dispersal from low-elevation species and only included analogs from modern subalpine forests above 1600 m above sea level (m asl). To decrease uncertainty, reduce site-specific noise, and create regionally representative climate reconstructions, we then also averaged the reconstructions across all six lakes. Comparing our climate reconstructions to existing tree-ring, pollen, isotopic, lake-level, and composite reconstructions allows us to test the reliability of our reconstructions and improve our understanding of Rocky Mountain climate over the past 2500 yr, particularly climate changes during the Common Era.
STUDY AREA
The six lakes (Table 1) in the study area span an elevational gradient from 2500 to 3700 m asl in and around the Mount Zirkel Wilderness, in the Park Range of northern Colorado (Fig. 1). Subalpine forests characterize the modern vegetation at the sites. Picea–Abies (spruce–fir), Pinus contorta (lodgepole pine), and Populus tremuloides (aspen) forests surround the lowest-elevation lakes, Hinman and Hidden Lakes. Picea–Abies forests occupy the land around the mid-elevation lakes, Gem and Gold Creek Lakes. Ribbon forests, which are alternating bands of subalpine conifer forests and meadows associated with seasonally persistent snowdrifts, surround the highest-elevation sites, Summit and Seven Lakes. Poaceae (grass family), Artemisia (sagebrush), and Asteraceae (daisy family) pollen derive from subalpine meadows, including those in ribbon forests (Shuman and Calder, 2017), and are included in our analyses along with the dominant tree taxa and understory herb and shrub taxa such as Rosaceae (rose family) and Salix (willow) (Table 2).

Figure 1. The location of the fossil pollen records from the Park Range in Colorado. All six lakes are in snow-dominated, subalpine areas.
Table 1. The six study lakes in and around the Mount Zirkel Wilderness in the Park Range.
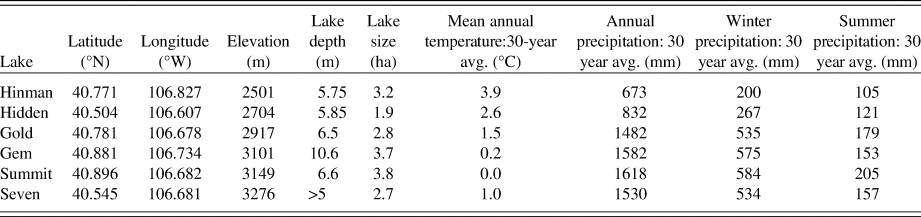
Table 2. The 29 taxa included in analyses for both modern and fossil pollen samples.

The fossil pollen records from the six lakes are described in detail in Calder et al. (Reference Calder, Stefanova and Shuman2019), but they tend to show a reduction in conifer pollen (specifically Picea and Pinus) percentages since ca. 1000 cal yr BP as the landscape opened and Artemisia abundance increased. In the past 500–1000 yr, the pollen data from Summit, Gold Creek, and Gem Lakes show evidence of the expansion of ribbon forests (Calder et al., Reference Calder, Stefanova and Shuman2019). The median sampling interval of the six fossil pollen records is 65 yr.
METHODS
We reconstructed mean annual temperature, total annual precipitation, total winter (December–February) precipitation, and total summer (June–August) precipitation using fossil pollen data from six lakes in the Park Range. Conceptually we expect vegetation assemblages to be sensitive to not only growing season temperature and precipitation, but to temperature and precipitation in the winter as well (Billings, Reference Billings1969). Some species are sensitive to low winter temperatures (Woodward et al., Reference Woodward1987). Winter snowpack can impact trees through providing water during the growing season and shortening the growing season for seedlings and saplings if snow persists through the summer (Hättenschwiler and Smith, Reference Hättenschwiler and Smith1999).
To reconstruct mean annual temperature, total annual precipitation, total winter precipitation, and total summer precipitation, we employed the MAT to infer past climate conditions from similarities in modern and fossil pollen samples (Overpeck et al., Reference Overpeck, Webb and Prentice1985). The MAT is based on calculations of dissimilarity between geographically varied pollen assemblages from surface (i.e., “modern”) samples and pollen assemblages from fossil samples. The analysis then assigns the averaged climates from the most similar modern pollen samples to each fossil pollen sample (Overpeck et al., Reference Overpeck, Webb and Prentice1985; Williams and Shuman, Reference Williams and Shuman2008). The interpretation of past climate is based on the assumptions of a “space for time” substitution.
The modern surface samples we used for the reconstructions include all samples from the North American Modern Pollen Database (Whitmore et al., Reference Whitmore, Gajewski, Sawada, Williams, Shuman, Bartlein and Minckley2005; http://www.lpc.uottawa.ca/data/modern) within the Rocky Mountains, defined as areas between 105°W and 117°W longitude and between 25°N and 60°N latitude. Within this area, we further constrained potential analogs to sites higher than 1600 m asl, to include only subalpine forest samples. The data set thus included samples from several studies of modern Rocky Mountain pollen assemblages compiled by Whitmore et al. (Reference Whitmore, Gajewski, Sawada, Williams, Shuman, Bartlein and Minckley2005). We used the associated climate data (annual temperature, annual precipitation, winter precipitation, and summer precipitation) for each surface sample as assigned by Whitmore et al. (Reference Whitmore, Gajewski, Sawada, Williams, Shuman, Bartlein and Minckley2005). We also included 22 additional surface samples from high-elevation lakes in northern Colorado and southern Wyoming (Calder and Shuman, Reference Calder and Shuman2017) not included in the Whitmore et al. (Reference Whitmore, Gajewski, Sawada, Williams, Shuman, Bartlein and Minckley2005) data set. We used the parameter regression of independent slopes model (PRISM) with 800 m resolution to assign climate data to the 22 additional surface samples (PRISM Climate Group, Oregon State University, http://prism.oregonstate.edu). However, the reconstruction is not sensitive to the addition of the PRISM data for these sites.
Our analyses used 29 different pollen types based on abundances in at least one fossil sample above 2% of the total pollen count (Table 2). To explicitly reconstruct high-elevation climates, we excluded low-elevation species (Ambrosia, Apiaceae, Cercocarpus, Chenopodiaceae, Amaranthaceae, Ephedra, Sarcobatus, Quercus, Fabaceae) from both the fossil- and modern pollen samples. The presence of these taxa in high-elevation pollen samples represents wind-transported pollen from lower elevations (Fall, Reference Fall1992), and thus does not reflect local vegetation change in the subalpine zone.
To determine the similarity between fossil pollen assemblages and modern pollen assemblages, we used the chi-squared metric to calculate dissimilarity between the proportion of each pollen taxon in every fossil pollen sample and modern pollen sample, because previous analyses indicate that the metric maximally differentiates among subalpine forest types, specifically ribbon forests, in this region (Calder and Shuman, Reference Calder and Shuman2017).
To evaluate the ability of the MAT to reconstruct annual temperature, annual precipitation, winter precipitation, and summer precipitation at high-elevation sites in the Rocky Mountains, we performed modern cross-validation exercises to determine which variables we can accurately and precisely reconstruct. We performed leave-one-out cross-validation exercises, using the R package Rioja, to calculate the root-mean-square error (RMSE) and R 2 of the observed and predicted climate variables of all modern surface samples in the Rocky Mountains above 1600 m asl (Juggins, Reference Juggins2017; R Development Core Team, 2018). We also used modern cross-validation to determine the number of taxa to include. For example, we included all pollen taxa that comprise at least 2% in any pollen sample from the Rocky Mountains, because this results in lower RMSEs than 0%, 5%, 10%, or 20% cutoffs.
The number of modern pollen samples the MAT selected as analogs for each fossil pollen sample was determined separately for each climate variable based on minimizing the RMSE in leave-one-out validation exercises and varies depending on the climate variable. We tested the significance of the reconstructions using the palaeoSig package in R to determine whether the reconstructions explained more variance in the pollen data than 999 reconstructions of randomly generated pseudo-climate variables (Telford and Birks, Reference Telford and Birks2011; Juggins and Birks, Reference Juggins, Birks, Birks, Lotter, Juggins and Smol2012; Telford, Reference Telford2015). The 999 reconstructions form a null distribution of potential explanatory variables and are generated using random variables drawn from a uniform distribution (Telford and Birks, Reference Telford and Birks2011; Juggins and Birks, Reference Juggins, Birks, Birks, Lotter, Juggins and Smol2012). The proportion of variance in the pollen assemblage data explained by each random reconstruction in the null distribution is calculated using redundancy analysis (Telford and Birks, Reference Telford and Birks2011; Juggins and Birks, Reference Juggins, Birks, Birks, Lotter, Juggins and Smol2012). The reconstruction is considered significant if it explains more variance in the pollen assemblages than 95% of the random reconstructions (Telford and Birks, Reference Telford and Birks2011; Juggins and Birks, Reference Juggins, Birks, Birks, Lotter, Juggins and Smol2012).
To enable the calculation of regional average time series, we linearly interpolated the individual reconstructions from each of the six lakes between reconstructed values to common 30 yr time steps. The temperature and precipitation values from each individual lake were converted into anomalies by subtracting the mean of the past 500 yr at each lake. The median value of the six sites at each time step was selected to reduce site-specific variability caused by local factors (Marsicek et al., Reference Marsicek, Shuman, Bartlein, Shafer and Brewer2018). Averaging across sites reduced uncertainty mathematically through the error propagation of multiple measurements of a regional mean, as confirmed by averaging climate from six modern sites (see Supplementary Materials). The uncertainty used for the regional mean reconstructions of the six sites is the RMSE divided by the square root of the number of sites.
RESULTS
Method validation tests
Comparing the climate variables predicted by the MAT and the observed climate variables of each modern pollen sample from the Rocky Mountains indicates the MAT can be used to make accurate reconstructions of annual temperature and precipitation as well as seasonal precipitation trends. R2 ranges from 0.56 to 0.80 (Fig. 2). The number of analogs that results in the lowest RMSE varies depending on the climate variable. The lowest RMSE (1.7°C) results from averaging the five closest analogs for annual temperature, the 13 closest analogs for annual precipitation (130 mm), the 12 closest for winter precipitation (51 mm), and the four closest analogs for summer precipitation (34 mm). After propagating the error to account for six measurements of a regional mean, the RMSE is 0.7°C for annual temperature, 52 mm for annual precipitation, 21 mm for winter precipitation, and 14 mm for summer precipitation. Spatial autocorrelation has minimal impacts on R2 and RMSE for all four climate variables (see Supplementary Materials).

Figure 2. The observed and predicted values of annual temperature, annual precipitation, winter precipitation, and summer precipitation for all surface samples from the North American Pollen Database (Whitmore et al., Reference Whitmore, Gajewski, Sawada, Williams, Shuman, Bartlein and Minckley2005) between 105°W and 117°W longitude, between 25°N and 60°N latitude, and above 1600 m asl The R 2 and root-mean-square error (RMSE) are calculated from the linear model, which regresses the predicted climate variables against the observed climate variables.
Temperature reconstructions
The mean annual temperature reconstructions from the six individual lakes do not reveal any consistent patterns among lakes (Fig. 3A). The two highest-elevation lakes, Summit Lake and Seven Lakes, show relatively constant mean annual temperature reconstructions compared with the four other lakes despite recording declines in total tree pollen percentages over the past 2500 yr (Calder et al., Reference Calder, Stefanova and Shuman2019). The two lowest-elevation lakes, Hinman Lake and Hidden Lake, exhibit the greatest temperature variability over time. However, none of the temperature reconstructions deviate significantly from modern, given an RMSE of 1.7°C. To decrease the uncertainty in reconstructed temperature, we averaged across sites, which resulted in an uncertainty of 0.7°C after error propagation. Even with this reduced uncertainty, the multisite mean reconstruction does not vary significantly from the modern temperature (Fig. 3B). The most similar pollen assemblages selected throughout the records are from sites that did not have significantly higher or lower temperatures than found at the sites today. The redundancy analysis shows that the annual temperature reconstruction explains 7.2% of the variance in the fossil pollen data, whereas 95% of random reconstructions explain less than 6.3% of the variance. Additionally, the first principle component explains 38.2% of the variance in fossil pollen assemblages, indicating that a single climate variable should not account for more than 38% of the variance. The significance test results in a P value of 0.03, indicating that the reconstruction explained more variance in the fossil pollen assemblages than 969 random reconstructions (following Telford and Birks, Reference Telford and Birks2011).

Figure 3. (color online) (A) Mean annual temperature anomalies at each of the six study lakes. The anomalies are calculated from the mean of the last 500 yr for each lake. (B) The median reconstructed annual temperature of the six lakes at every 30 yr time step, plotted as anomalies from the most modern reconstructed value. The uncertainty band represents ± 0.7°C, which is the root-mean-square error after error propagation.
Total annual precipitation reconstructions
Reconstructions from all six lakes show a trend of increasing total annual precipitation over the past 2500 yr (Fig. 4A). The fossil pollen samples from 2500 to 1500 cal yr BP derive their best analogs from significantly drier locations than the analogs selected for the most recent fossil pollen samples. Most lakes indicate two distinct annual precipitation maxima at ca. 600 and 100 cal yr BP. When annual precipitation is averaged across all six lakes, the increasing trend is clearly visible and results in changes greater than our uncertainty, especially after 1500 cal yr BP (Fig. 4B). Consistent with the replicated signals at the site level (Fig. 4A), the two distinct maxima at 600 and 100 cal yr BP punctuate the period of high precipitation over the last millennium in the multisite mean reconstruction (Fig. 4B). The annual precipitation reconstruction explains 12.5% of the variance in the fossil pollen data, which is more than twice as much variance than 95% of the random reconstructions explain (6.2%). Again, we would not expect a single climate variable to explain more than 38.2% of the variance. The precipitation reconstructions, including those for summer and winter (see following section), explain significantly more variance in the fossil pollen data than 999 random reconstructions (P = 0.001).

Figure 4. (color online) (A) Annual precipitation anomalies at each of the six study lakes. The anomalies are calculated from the mean of the last 500 yr for each lake. (B) The median annual precipitation of the six lakes at every 30 yr time step, plotted as anomalies from the most modern reconstructed value. The uncertainty band represents the root-mean-square error after error propagation (52 mm).
Seasonal precipitation reconstructions
Unlike the total annual precipitation reconstructions, the inferred summer precipitation anomalies remain near zero for the entirety of the record, indicating that summer precipitation did not change significantly over the past 2500 yr (Fig. 5B). The winter precipitation reconstruction displays trends and fluctuations similar to those seen in the annual precipitation reconstruction, but with smaller positive and negative anomalies consistent with reconstructing only a 3 month (December–February) fraction of the annual total precipitation (Fig. 5A). Because orographic uplift enhances winter precipitation today at the highest-elevation sites, the reconstructed increase of ~50 mm (Fig. 5A) equals between 9% and 25% of the modern 30 yr mean winter precipitation totals, which range from 200 mm at Hinman Lake to 584 mm at Summit Lake (Table 1). A gradual shift to positive winter precipitation anomalies starts at ca. 1500 cal yr BP, which indicates that the Park Range likely experienced significant increases in snowfall during the past 2500 yr.

Figure 5. (color online) (A) Median winter and (B) summer precipitation of the six study lakes after interpolating each lake to a 30 yr time step, plotted as anomalies from the most modern reconstructed value. The uncertainty band represents the root-mean-square error (RMSE) after error propagation (21 mm for winter precipitation and 14 mm for summer precipitation).
The most frequently selected analogs for 2500–1000 cal yr BP experience less precipitation than the most frequently selected analogs for the 1000 cal yr BP to present period (Fig. 6). Overall, the best analogs are from higher latitudes during the second millennium of the Common Era, and the best analogs selected during 2500–1000 cal yr BP are from lower latitudes (Fig. 6). While many of the same analogs are found throughout both periods, differences in the frequency of selection in the top 12 analogs influence the reconstructions. Drier, southern sites in places like the San Juan Mountains are selected more frequently before 1000 cal yr BP.

Figure 6. On the left, the western United States with all surface samples included in our climate reconstructions (black) with the samples selected as analogs over 25 times before 1000 cal yr BP (green) and after 1000 cal yr BP (blue). On the right, the mean latitude of the 12 best analogs plotted by winter precipitation of the 12 best analogs before 1000 cal yr BP (green) and after 1000 cal yr BP (blue); green and blue circles represent the mean latitude and winter precipitation for the 12 best analogs of each individual fossil sample before and after 1000 cal yr BP, respectively. (For interpretation of the references to color in this figure legend, the reader is referred to the web version of this article.)
DISCUSSION
We have no evidence of significant temperature change during the Common Era (Fig. 3). The absence of an LIA cold signature in our temperature reconstruction results either from the absence of a cooling in the Park Range or from the inability of our methods to detect a temperature change of less than our uncertainty of 0.7°C. The absence of a cooling during the LIA in the Park Range agrees with another pollen-based temperature reconstruction for the Southwest (Viau et al., Reference Viau, Ladd and Gajewski2012; Fig. 7C), chironomid-inferred temperatures from the Great Basin (Reinemann et al., Reference Reinemann, Porinchu, MacDonald, Mark and DeGrand2014), and our understanding that the LIA is not expected to be globally synchronous (Matthews and Briffa, Reference Matthews and Briffa2005). Based on fossil pollen records from across the continent, North America experienced an ~0.5°C increase in mean annual temperature during the MCA, followed by a decline to the lowest temperatures of the Common Era during the LIA (Trouet et al., Reference Trouet, Diaz, Wahl, Viau, Graham, Graham and Cook2013; Fig. 7B), but these trends are dominated by signals from eastern North America (Viau et al., Reference Viau, Ladd and Gajewski2012). A regional subset of the continental reconstruction from southwestern North America, which includes sites in northern Colorado, does not display significantly higher than modern temperatures during the MCA or lower than modern temperatures during the LIA (Viau et al., Reference Viau, Ladd and Gajewski2012; Fig. 7C), indicating that a cooling may not have occurred during the LIA in southwestern North America, including Colorado. The other possibility is that a cooling occurred in the Park Range, but was too small to detect with our methods. If the cooling during the LIA was only 0.5°C in the Park Range, as indicated in mean continental reconstructions, our reconstruction would be unable to reconstruct the decrease in temperature, because our uncertainty is 0.7°C. The uncertainty of our temperature reconstruction from the Rocky Mountains encompasses the hemispheric-to-continental mean decrease in temperature from the MCA to the LIA (Fig. 7). Our large uncertainty restricts our ability to detect temperature changes, unless the temperature changes in the Park Range were greater than the mean continental temperature variations.

Figure 7. Mean annual temperature anomalies from a Northern Hemisphere composite reconstruction (30 yr moving average) (A; Mann et al., Reference Mann, Zhang, Rutherford, Bradley, Hughes, Shindell, Ammann, Faluvegi and Ni2009), a North America pollen-based reconstruction (30 yr moving average) (B; Trouet et al., Reference Trouet, Diaz, Wahl, Viau, Graham, Graham and Cook2013), a Southwestern pollen-based reconstruction (C; Viau et al., Reference Viau, Ladd and Gajewski2012), and our pollen-based Park Range reconstruction (red). (For interpretation of the references to color in this figure legend, the reader is referred to the web version of this article.)
The analog analysis indicates that the locations of the best modern analogs can shift to sites with significantly different annual and winter precipitation (>52 mm and >21 mm, respectively), but without significantly different mean annual temperature (>0.7°C). Changes in pollen, like the decrease in conifer pollen and increase in Artemisia pollen observed at most of the six study lakes, led to the qualitative interpretation that mean annual air temperature decreased while snow drifting associated with ribbon forests increased over the past 2500 yr (Calder and Shuman, Reference Calder and Shuman2017; Calder et al., Reference Calder, Stefanova and Shuman2019). A similar decrease in Picea and Pinus and increase in Artemisia in the central Colorado Rocky Mountains was also used to infer a cooling and increased winter precipitation (Jiménez-Moreno and Anderson, Reference Jiménez-Moreno and Anderson2012). In a different forest type in the Wind River Range in Wyoming the retreat of mixed-conifer forest and expansion of P. contorta and alpine tundra was also used to infer cooling since 3000 cal yr BP (Fall et al., Reference Fall, Davis and Zielinski1995). The common element in these studies is the cooling inferred over the last 2500–3000 yr; however, increased snowfall provides an alternative or compounding climate explanation for the change in subalpine forest vegetation.
Snowfall exerts a strong climatic influence on our study sites where extensive ribbon forests form through feedbacks with snow drifting and only appear to have become extensive in the past 500–1000 yr (Calder and Shuman, Reference Calder and Shuman2017; Calder et al., Reference Calder, Stefanova and Shuman2019). Likewise, the oxygen isotope record from Bison Lake in Colorado indicates increased snow relative to rain in the late Holocene, although the record has multiple possible controlling factors and is not replicated by oxygen isotope changes at other sites in the region (Anderson, Reference Anderson2011, Reference Anderson2012; Dean et al., Reference Dean, Rosenbaum, Skipp, Colman, Forester, Liu, Simmons and Bischoff2006). Positive (negative) anomalies may be caused primarily by increased (decreased) temperature or increased (decreased) rain relative to snow (Anderson et al., Reference Anderson, Berkelhammer and Mast2016b), but may also reflect shifts in atmospheric circulation related to dynamics over the north Pacific Ocean (Anderson et al., Reference Anderson, Berkelhammer, Barron, Steinman, Finney and Abbott2016a). Despite these complexities, linear correlations between Bison Lake δ18O and Summit Lake pollen assemblages (Fig. 8A), as well as with weight percent carbon and δ13C of the organic lake sediment from Summit Lake (Calder and Shuman, Reference Calder and Shuman2017), indicate that these different records may have been responding to a similar set of climate changes. The similarities led to the conclusion that vegetation changes at Summit Lake closely tracked the regional climate history (Calder and Shuman, Reference Calder and Shuman2017; Shuman et al., Reference Shuman, Marsicek, Oswald and Foster2019), and our results indicate that an increase in winter precipitation (and coincident change in the snow to rain ratio) was likely important, while the effects of temperature change were too small to detect.

Figure 8. Winter precipitation anomalies from our six study lakes (blue, B) compared with the percent conifer pollen from Summit Lake (black in A; Calder and Shuman, Reference Calder and Shuman2017); δ18O from Bison Lake (purple in A; Anderson, Reference Anderson2011); the timing of Living Blended Drought Atlas Palmer Modified Drought Index (PMDI) droughts and pluvials lasting longer than 30 yr in northern Colorado, site 2765 (orange and blue, respectively) (Cook et al., Reference Cook, Seager, Heim, Vose, Herweijer and Woodhouse2010); the 100-yr moving average of snow water equivalent (SWE) from the Yampa/White River basin in Colorado (black line in B; Pederson et al., Reference Pederson, Gray, Woodhouse, Betancourt, Fagre, Littell, Watson, Luckman and Graumlich2011); and the duration of Holocene highstands from Hidden Lake and Emerald Lake in Colorado and Little Windy Hill Pond in southern Wyoming (gray bars in B; Shuman et al., Reference Shuman, Henderson, Colman, Stone, Fritz, Stevens, Power and Whitlock2009, Reference Shuman, Carter, Hougardy, Powers and Shinker2014; Minckley et al., Reference Minckley, Shriver and Shuman2012). Black circles with error bars in B show the calibrated radiocarbon ages that constrain the onset of high water at the lake-level study sites. (For interpretation of the references to color in this figure legend, the reader is referred to the web version of this article.)
Our reconstructions indicate a significant increase in annual precipitation over the past 2500 yr. The reconstructed mean from 2500 to 1500 cal yr BP was more than 100 mm less than the mean from 1500 cal yr BP to present, which is consistent with tree-ring and lake-level reconstructions (Fig. 8B). A tree ring–based hydroclimate reconstruction from Summitville, Colorado, indicates that the two longest droughts of the 2276 yr record, when smoothed with 25 yr moving average, occurred from 1873 to 1668 cal yr BP and 1649 to 1550 cal yr BP (Routson et al., Reference Routson, Woodhouse and Overpeck2011). The three longest droughts in Colorado Plateau Palmer Drought Severity Index reconstructions occurred before 1469 cal yr BP as well (Routson et al., Reference Routson, Woodhouse and Overpeck2011). The two longest droughts in a tree ring–derived Palmer Modified Drought Index (PMDI) reconstruction from the Park Range (Living Blended Drought Atlas site 2765; https://www.ncdc.noaa.gov/paleo-search/study/19119) also fall within the first millennium of the Common Era (Cook et al., Reference Cook, Seager, Heim, Vose, Herweijer and Woodhouse2010; Fig. 8). These two longest droughts lasted for more than 90 yr from 1581 to 1486 cal yr BP and from 1289 to 1197 cal yr BP. Furthermore, the 30 yr smoothed PMDI record shows that droughts lasting more than 30 yr occurred much more frequently during the first half of the record, and pluvials lasting more than 30 yr occurred much more frequently in the second half of the record (Fig. 8). Our reconstruction clarifies that a low-frequency change in winter precipitation could have played an important role in the seasonality and clustering of these regional droughts.
Our findings also agree with nearby lake-level reconstructions from Colorado and Wyoming. Lake-level reconstructions from Emerald Lake in the Sawatch Range in Colorado, Hidden Lake in the Park Range, and Little Windy Hill Pond in southern Wyoming reveal Holocene highstands beginning at ca. 1020, 1220, and 1280 cal yr BP, respectively (Shuman et al., Reference Shuman, Henderson, Colman, Stone, Fritz, Stevens, Power and Whitlock2009, Reference Shuman, Carter, Hougardy, Powers and Shinker2014; Minckley et al., Reference Minckley, Shriver and Shuman2012; Fig. 8B). The timing of these highest Holocene lake levels are contemporaneous with the switch to positive winter precipitation anomalies, which fits with the expectation that small lakes depend primarily on spring snowpack for maintaining high water levels even in late summer and fall (Shuman et al., Reference Shuman, Henderson, Colman, Stone, Fritz, Stevens, Power and Whitlock2009; Liefert et al., Reference Liefert, Shuman, Parsekian and Mercer2018). Consequently, the late Holocene highstands likely reflect a high winter precipitation regime starting between ca. 1020 and 1280 cal yr BP.
Winter precipitation comprises the majority of the increase in annual precipitation over the past millennium, supporting the primary interpretation of the Bison Lake δ18O record that snow increased from the MCA to the LIA (Anderson, Reference Anderson2011, Reference Anderson2012; Anderson et al., Reference Anderson, Brunelle and Thompson2015, Reference Anderson, Berkelhammer, Barron, Steinman, Finney and Abbott2016a, Reference Anderson, Berkelhammer and Mast2016b). Similarities between the winter precipitation reconstruction and the tree ring–based snow water equivalent (SWE) reconstruction further reinforce our reconstruction (Pederson et al., Reference Pederson, Gray, Woodhouse, Betancourt, Fagre, Littell, Watson, Luckman and Graumlich2011; Fig. 8B). We are unable to corroborate our reconstruction with tree ring–based SWE reconstructions before 1150 cal yr BP, because SWE reconstructions only extend 1200 yr, but both records are largely consistent during the time of overlap, indicating two peaks in snowfall around 600 and 100 cal yr BP (Pederson et al., Reference Pederson, Gray, Woodhouse, Betancourt, Fagre, Littell, Watson, Luckman and Graumlich2011). The most recent peak in SWE occurs approximately 50 yr after the peak in our pollen-based winter precipitation reconstruction. The difference in timing may be caused by noise or age uncertainties in our reconstructions, but also by the spatial heterogeneity of precipitation in western North America (Shinker, Reference Shinker2010), given that the locations of the reconstructions differ. Additionally, the SWE reconstruction represents total snow accumulation over the entire snow season before April 1, whereas our reconstruction focuses on December through February precipitation. Our record only overlaps with tree-ring reconstructions during the wet second millennium of the Common Era, when the positive, regionally scaled SWE z-scores confirm that the Yampa/White river basin was consistently wetter than the mean of the northern and southern Rocky Mountains (Pederson et al., Reference Pederson, Gray, Woodhouse, Betancourt, Fagre, Littell, Watson, Luckman and Graumlich2011; Fig. 8B).
Our reconstruction differs from a regional reconstruction of annual precipitation based on the MAT and pollen data from southwestern North America, in which previously published pollen records from subalpine Colorado comprised more than 50% of the data set (Ladd et al., Reference Ladd, Viau, Way, Gajewski and Sawada2018). The precipitation reconstruction from this southwestern region, referred to as the “Desert” ecoregion, shows a millennial-scale decrease in precipitation (Ladd et al., Reference Ladd, Viau, Way, Gajewski and Sawada2018), rather than the increase we observe. The differences between reconstructions may represent geographic differences between our high-elevation, landscape-scale reconstruction and a broad regional reconstruction including sites from low-elevation desert areas and multiple states. However, the reconstruction decisions used by Ladd et al. (Reference Ladd, Viau, Way, Gajewski and Sawada2018) also differed from our approach: analogs were chosen based on 63 pollen taxa; only the single best analogs were used to determine the reconstructed value for each fossil sample; and all surface pollen samples from North America were employed as possible analogs. Our annual precipitation reconstruction approach included 29 taxa, averaged the 13 best analogs, and importantly, only allowed surface samples from the Rocky Mountains above 1600 m asl to be selected as analogs. The differences in methods may cause the discrepancy between the reconstructions.
Regional context and comparison
Like our reconstructions, a composite hydroclimate reconstruction from the Southwest, which includes northern Colorado, and a composite reconstruction from the Rocky Mountains indicate a pattern of increasing precipitation over the last 2000 yr (Rodysill et al., Reference Rodysill, Anderson, Cronin, Jones, Thompson, Wahl and Willard2018; Shuman et al., Reference Shuman, Routson, McKay, Fritz, Kaufman, Kirby, Nolan, Pederson and St-Jacques2018). Most of the records involved indicate a millennial-scale wetting trend during the Common Era. Records represent a diverse range of evidence, including changes in stratigraphy (Shuman et al., Reference Shuman, Henderson, Colman, Stone, Fritz, Stevens, Power and Whitlock2009, Reference Shuman, Carter, Hougardy, Powers and Shinker2014; Pribyl and Shuman, Reference Pribyl and Shuman2014), particle size (Kirby et al., Reference Kirby, Lund, Patterson, Anderson, Bird, Ivanovici, Monarrez and Nielsen2010), δ18O (Anderson, Reference Anderson2012), C/N (Kirby et al., Reference Kirby, Zimmerman, Patterson and Rivera2012), qualitative pollen interpretations (Caffrey and Doerner, Reference Caffrey and Doerner2012; Thompson et al., Reference Thompson, Oviatt, Honke, McGeehin, Oviatt, . and John2016), or a composite of proxies (Routson et al., Reference Routson, Overpeck, Woodhouse and Kenney2016). However, two sites from the southern Rocky Mountains were interpreted to represent a drying trend during the Common Era. One pollen record from Kite Lake, Colorado, was used to infer LIA drought (Rodysill et al., Reference Rodysill, Anderson, Cronin, Jones, Thompson, Wahl and Willard2018) but, like our study sites, shows a decline in Picea and Pinus and an increase in Artemisia over the Common Era and could be consistent with our quantitative reconstructions, as the original authors inferred either cooling or increased winter precipitation from the changes (Jiménez-Moreno and Anderson, Reference Jiménez-Moreno and Anderson2012). A difference between Colorado oxygen isotope records from Bison and nearby Yellow Lake may indicate an increase in lake evaporation (Anderson, Reference Anderson2012), but we cannot evaluate this inference with our reconstruction technique.
Overall, a rapid hydroclimate shift at ca. 950 cal yr BP affected many regions of North America, but the direction of change varied depending on location, and the spatial differences may help to illuminate the processes involved (Shuman et al., Reference Shuman, Routson, McKay, Fritz, Kaufman, Kirby, Nolan, Pederson and St-Jacques2018). For example, although hydroclimate proxies in the southern Rocky Mountains exhibit an increase in precipitation over the past 2000 yr similar to trends observed at our study sites, the Pacific Northwest may have experienced the opposite trend (Rodysill et al., Reference Rodysill, Anderson, Cronin, Jones, Thompson, Wahl and Willard2018; Shuman et al., Reference Shuman, Routson, McKay, Fritz, Kaufman, Kirby, Nolan, Pederson and St-Jacques2018), particularly in terms of winter precipitation (Steinman et al., Reference Steinman, Abbott, Mann, Stansell and Finney2012). Simulations of the last millennium produce a similar pattern of MCA–LIA change in winter precipitation, which could indicate that changes in insolation drove important changes in the position of major circulation features and attendant precipitation over western North America (Landrum et al., Reference Landrum, Otto-Bliesner, Wahl, Conley, Lawrence, Rosenbloom and Teng2013). However, glaciers in the Canadian Rockies, Northern Rockies, North Cascades, and the Sierra-Nevada Mountains may have expanded to their Holocene maxima during the last millennium, particularly during the LIA (Luckman, Reference Luckman2000; Luckman and Villalba, Reference Luckman, Villalba and Markgraf2001; Davis et al., Reference Davis, Menounos and Osborn2009), which suggests that more work is needed to understand the spatial dimension of this transition and ultimately diagnose the causes of changes in snowpack in northern Colorado and across the Rocky Mountains as a whole. A range of spatial outcomes could have resulted from the interaction of stochastic processes with regional-to-global external forcing such as insolation and volcanism (Otto-Bliesner et al., Reference Otto-Bliesner, Brady, Fasullo, Jahn, Landrum, Stevenson, Rosenbloom, Mai and Strand2016), potentially driving changes in the frequency of annual-scale drought and winter precipitation dynamics (Cayan, Reference Cayan1996; McCabe, Reference McCabe1994; Carter et al., Reference Carter, Shinker and Preece2018).
How long-term trends interacted with interannual variability may help explain why megadroughts clustered during the MCA (Ault et al., Reference Ault, St. George, Smerdon, Coats, Mankin, Carrillo, Cook and Stevenson2018). Millennial-scale trends in precipitation, as opposed to changes in variability alone, may have contributed to multidecadal megadroughts indicated in tree-ring reconstructions. When combined with modern-like interannual variability, the 40 mm decrease in winter precipitation before 1500 cal yr BP could result in frequent years to decades with little to no snow (e.g., like the 2017–2018 winter in Colorado). In fact, reduced interannual variability would be required to prevent extended occurrences of near-zero snowfall during the coldest winter months. Because the Intermountain West is dependent on these high-elevation, snow-dominated sites for water storage (Barnett et al., Reference Barnett, Adam and Lettenmaier2005), the paleoclimate record reveals the high risk of significantly reduced water availability under other climate states than experienced in recent history (i.e., the period of direct observation and represented by the dendroclimatic reconstruction of SWE in Fig. 8B). Human-made water storage infrastructure was designed for a high precipitation regime that may be unusual in the context of the Common Era. If we experience reductions in winter precipitation similar to those reconstructed in the first millennium of the Common Era, the natural water storage capacity provided by snowpack will be significantly reduced. The possibility of extended hydroclimate changes that persist over centuries could undercut the drought-buffering capacity of existing infrastructure, which is designed to store only up to 400% of annual average flows (Serreze et al., Reference Serreze, Clark, Armstrong, McGinnis and Pulwarty1999).
CONCLUSIONS
Our climate reconstructions indicate that northern Colorado experienced a long-term climate shift over the past 2500 yr that increased winter precipitation by ~40 mm or 9% of the modern mean winter precipitation at our study sites. Our reconstructions reveal that the pollen samples from the past 1000 yr are most similar to pollen assemblages from environments with significantly more annual precipitation than the drier environments that were common analogs for the 2500–1000 cal yr BP period. Separate winter and summer precipitation reconstructions indicate that changes in annual precipitation primarily reflect an increase in winter precipitation beginning at ca. 1000 cal yr BP. Summer precipitation does not change greatly over the length of the record. The reconstructed mean annual temperature also does not change significantly over the past 2500 yr. Thus, the dominant low-frequency climate change that best explains regional changes in vegetation, surface water levels, and lake oxygen isotope ratios was a significant increase in winter precipitation that made the most recent millennium significantly snowier than from 2500 to 1000 cal yr BP. Low winter precipitation during the first millennium of the Common Era underscores the risk that this region can experience substantial reductions in winter precipitation that persist for centuries or longer.
ACKNOWLEDGMENTS
We thank Ellen Currano, Philip Higuera, and Jacqueline J. Shinker for helpful comments. We also thank two anonymous reviewers for their thoughtful comments. This research would not be possible without everyone who contributed to the North American Modern Pollen Database (Whitmore et al., Reference Whitmore, Gajewski, Sawada, Williams, Shuman, Bartlein and Minckley2005). Funding was provided by National Science Foundation support to BNS (DEB-1655189).
SUPPLEMENTARY MATERIAL
The supplementary material for this article can be found at https://doi.org/10.1017/qua.2019.85.


