I. INTRODUCTION
These last 10 years, biosensors received an increasing interest as there is an important need for tools that can quickly and simply analyze biological elements like bio-molecules or cells [Reference Bashir1]. Currently developed biosensing methods based on optical [Reference Moerner and Orrit2] or mechanical [Reference Campbell and Mutharasam3] biodetection techniques can efficiently analyze biological systems but generally require the use of specific labels to enhance the signal discrimination. Actually, labeling analyzed items, using fluorescent molecules, magnetic or gold particles, or other surface treatments for antibodies attachments, induce some major drawbacks. Sample preparation is complicated and time consuming; and above all, the biological sample can be altered prior analysis since labels can modify the cell properties [Reference Kim4]. On the other hand, electronic techniques become more and more interesting as they allow the development of label-free biodetection methods [Reference Kim, Park and Baik5]. In addition, the interest in the electrical properties of human cells at radio frequencies has been widely recognized for a long time [Reference Stuchly, Kraszewski, Stuchly and Smith6]. Indeed, microwave properties of human cells are directly influenced by different parameters like cell type, morphology, or physiological state. For instance, cancerous cells are well known to exhibit larger water content than normal cells and therefore present higher permittivity and conductivity [Reference Blad and Baldetorp7, Reference Vander Vorst, Rosen and Kotsuka8]. Previous works achieved on biological tissues characterization using macroscopic coaxial probes or microscrip transmission lines [Reference Gabriel, Lau and Gabriel9–Reference Tofighi and Daryoush11] have demonstrated that the bio-impedance measurement can allow an efficient way to discriminate cells.
The purpose of this work is to improve the accuracy of such RF measurement techniques reducing the investigated biological material concentration to a very low level. Hence, measurement up to single cell can be targeted and accurately done with a high sensitivity with micro technologies allowing to work at cell scale [Reference Song and Wang12]. This last point may represent a significant step toward the understanding of many biological effects [Reference Richards Grayson13–Reference Treizebré, Akalin and Bocquet15].
In this paper, the proposed biosensor aims at extracting global cell dielectric parameters. Particularly, the real part of permittivity in the gigahertz frequency domain is determined. Since these electrical parameters are related to the considered cell type, the proposed biodetection method may be used to identify and isolate cells of interest for further experimentations.
This paper will first describe the design of the resonating biosensor that has been developed for biological sample characterization at the cell scale. The next section will present experimental results achieved using human nervous system cells that have been firstly embedded in a low loss polymer matrix for the measurement, and in the last section, characterization results done on the same cells that have been grown on chip in order to improve the measurement accuracy.
II. SENSOR DESIGN
The proposed biosensor designs are based on a coplanar resonator (Fig. 1) that can be designed to operate between 15 and 35 GHz with significant sensitivity detection to a very low concentration of cells. Indeed, a resonant structure is by nature much more sensitive to small parameter changes. Even if the available analysis spectrum is limited to a narrow band around the resonance frequency, it will be easier to detect tiny interactions and will be suitable to analyze a very small number of biological elements [Reference Denef16].

Fig. 1. 3D view of the proposed micro biosensors: (a) using a support media during cell analysis and (b) with on chip cell culture.
A) RF design
The proposed cell biosensor design is based on a coplanar band stop RLC resonator made with a meandered inductor associated with an interdigited capacitor (Fig. 2). Such a device seems more suited to RF biodetection than the classical half wavelength microwave resonator topology since loading its lumped capacitor will cause a larger resonance frequency shift in contact of tiny biological samples. In addition, this frequency shift can be easily linked to a change of capacitance and resistance using a simple electrical model as the one presented in Fig. 3.

Fig. 2. SEM photograph of 15.7 GHz RF biosensor.

Fig. 3. Equivalent RLC circuit of the unloaded biosensor and biosensor loaded by cells.
This kind of microwave resonator can be fabricated on different substrates. In the present work, fused silica has been chosen mainly for its low loss properties and easy observation of cells through it. As illustrated in Fig. 4, the capacitors concentrate on most of the electric field at the resonance frequency. These areas will be consequently highly sensitive to any dielectric perturbation and have to be carefully designed to efficiently interact with cells. Hence gaps between these metal lines are set to 10 or 15 µm as a compromise between a strong interaction with RF signal propagating into the sensor and the analyzed cell size.
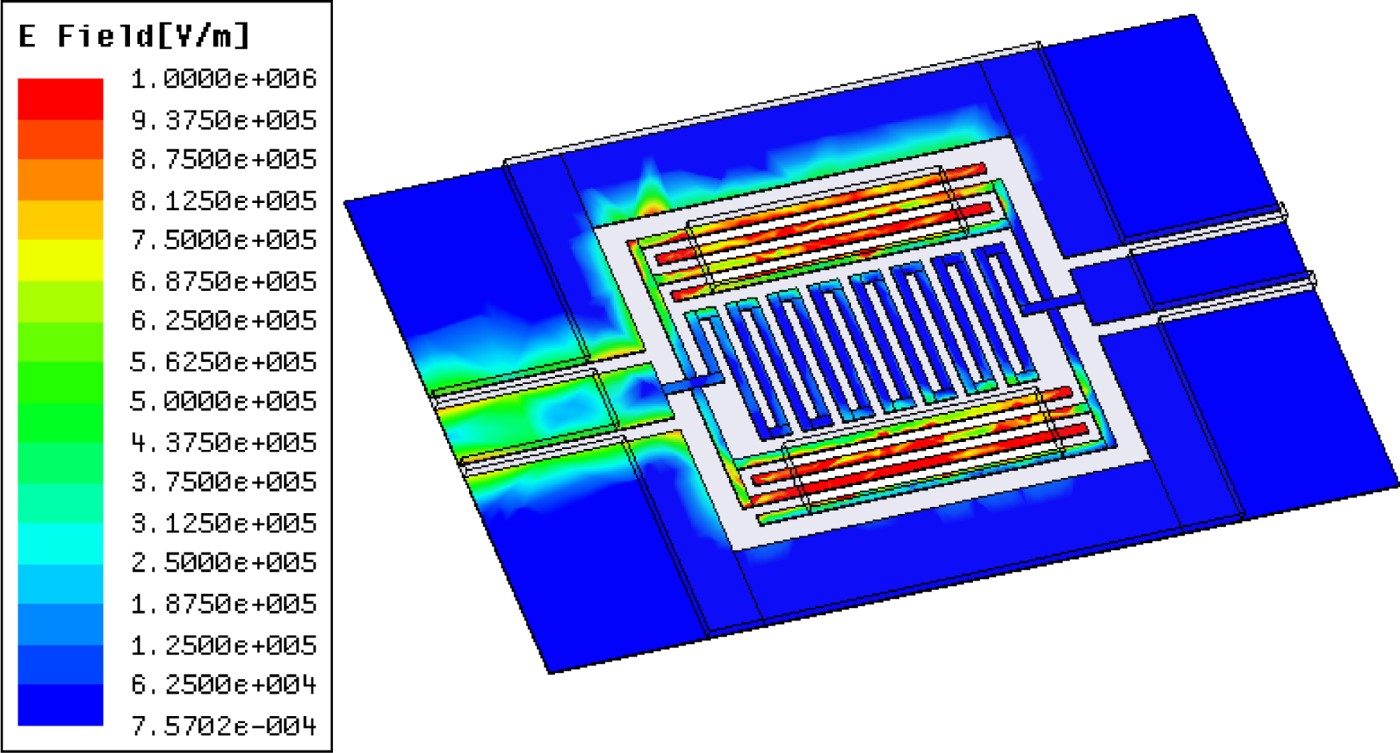
Fig. 4. Electric field distribution plot at the biosensor resonance frequency.
The planar device has been designed using ANSOFT HFSS EM simulations. The design starts with the interdigited capacitor using 10 or 15 µm gaps and once the sensor capacitor size is set, its resonant frequency is adjusted changing the inductor meander number. Following this simulations, RLC parameters are fitted using AGILENT ADS circuit simulations. The resulting parameters are summarized in Table 1 for different sensors designed to resonate at 15.7, 20.5, 25.7, and 34.5 GHz. The unloaded quality factor is obtained from 3 dB bandwidth resonance peak. These different resonators allow achieving a wider frequency band characterization with discrete points and can be used to establish the electromagnetic characteristics of analyzed cells.
Table 1. Extracted RLC values of designed resonators.

In order to evaluate the potential of the sensor for small bioobject characterization, EM simulations have been performed with 10 µm diameter spheres located inside the capacitor gaps (Fig. 1(b)). The permittivity of these spheres is 42 (reference value extract with HaCaT cells in previous work [Reference Dalmay, Pothier, Blondy, Lalloue and Jauberteau17]) and the frequency shift versus the number of cells is shown in Fig. 5.

Fig. 5. Simulated results of the biosensor response versus number of cells.
From simulations, it can be seen that the sensitivity allows the detection of at least four cells on the sensor with accuracy limited by the width of the resonance peak. Indeed, the intrinsic resonator quality factor has a major influence on the biosensor sensitivity as it controls its frequency selectivity.
For these designs, the measured resonator unloaded quality factors are about 15 mostly limited by the series resistor of the meander inductor. The resonator design results in a compromise between this quality factor and size of the sensing area.
Biological experiments usually require saline water-based support media to carry biological materials, as phosphate buffered saline (PBS) or keratinocyte serum-free medium for example. Because of conductivity and water content, losses induced by these media can strongly degrade the resonator quality factor. As shown in Fig. 6, if only a 10 nl volume of such media is deposited on the full sensor surface, the RF performances of the device are strongly disturbed and it loses almost all of its detection capabilities. The maximum range of loading for distilled water (with a conductivity of 2 × 10⁻⁴ S/m) for example is less than 10 nl which is a range of volume sample compatible with microfluidic systems which can be implemented on the planar device.

Fig. 6. Measured effect of different biological media on the biosensor frequency response.
Consequently, in order to evaluate the detection capability of our biosensor, we have chosen firstly to use a specific support for cell during characterization that presents low dispersive properties in the frequency band of interest. More details on the used protocol during experimentations will be presented in Section III.
B) Biosensor fabrication process
Micro biosensors are fabricated using a standard and simple microelectronic process based on biocompatible materials: fused silica as substrate, gold layer for the sensor metallization, and micro culture chambers made with a polymer layer.
The fabrication process starts with an RCA substrate cleaning followed by a chromium/gold layer deposition. Then, using a conventional UV photolithography, gold lines are defined. Next an SU8 resist from MicroChem is patterned to form a mold for a thick electroplating of gold lines up to 8 µm. Once the first SU8 layer is removed a second one is deposited and patterned to make 20 µm thick micro culture chambers on the sensor surface. As show in Fig. 7, for some biosensor designs, culture chambers can be specifically patterned to localize the analysis area to the highest sensitive part of the biosensor and avoid biological sample to interact with other RF resonator areas.

Fig. 7. Fabricated 34.5 GHz biosensor photograph including micro culture chambers.
III. HUMAN CELL CHARACTERIZATIONS IN FICOLL SUPPORT MEDIA
A) Experimental protocol
In order to demonstrate the feasibility of the proposed biodetection method, first experimentations were done using a ficoll-based culture support to handle cell during measurement. In this section SU8 micro chambers are not fabricated, the full sensor surface is used to characterize cells.
Ficoll, a polymeric gel of sucrose, is a support media classically used in biology to separate cell by using mass gradient techniques. For our application, ficoll will constitute a low dispersive layer on the sensor surface, when it is fully dried, making a polymeric matrix in which cells can keep their integrity during measurement. In addition, a simple washing in water is sufficient to remove all the polymerized support media once measurements are done. Typical biosensor designs used for cell characterizations embedded in a ficoll matrix are shown in Fig. 1(a) where the full resonator surface is covered with low volume of ficoll droplet.
Once ficoll polymerization is achieved, all water held in the film is evaporated. The resulting dried layer which is about 20 µm thick then presents a low permittivity and conductivity (see Table 2) that does not dramatically degrade RF performances of the device. Indeed as shown in Fig. 8, a resonant frequency shift is still observed and can be calibrated. Nevertheless, the resonator quality factor drops down to 8.8 but it is still high enough to maintain the biosensor sensitivity.

Fig. 8. Measured transmission response of the unloaded biosensor and sensor loaded with pure ficoll media.
Table 2. Evaluation of the global electrical parameters of ficoll and glial cells around 18 GHz at T = 20°C.

Before any cell characterizations, an initial resonant frequency calibration is required in order to take into account the ficoll influence on the sensor. Hence, a controlled volume droplet of pure ficoll is deposited on the analysis area with a micro-syringe. The resonator S-parameters are measured once all water containing in ficoll is evaporated using on-wafer measurement with coplanar ground-signal-ground (GSG) probe from cascade and a HP 8722ES network analyzer.
The sensor is then washed to remove all the ficoll media and the same volume of ficoll, containing cells to analyze, is next deposited. During the few minutes of ficoll polymerization, cells land down on the sensor surface until this layer is fully dried. The RF sensor frequency response presents a resonant frequency shift whose value mostly relies on the deposited cells location both on the sensor surface and in the ficoll thickness for the ones do not completely laying on the sensor surface. Consequently, a reproducible cell distribution from one deposition to another is difficult to achieve. Nevertheless, as we will see in the next section, quite accurate characterization can be still achieved on a restricted number of biological samples.
B) First experimental results and discussion
As detailed in [Reference Dalmay, Pothier, Blondy, Lalloue and Jauberteau17], our first proof of concept was carried with U87-type glial-cells derived from tumor glioblastoma (nervous system cells). Their typical diameters range between 5 and 10 µm are well suited to our sensor designs.
Figure 9 illustrates the random cell distribution usually obtained during cell deposition. But as shown in Fig. 10 the biosensor still presents a significant frequency shift of 1.18 GHz at 18 GHz with only 15 cells interacting with the resonator, demonstrating its capability to detect low concentration of biological samples in ficoll. For all measurements, the minimum frequency shift that can be detected is 25 MHz as it is the measurement step. So, a frequency shift larger than 25 MHz is necessary to analyze cells.

Fig. 9. Photograph of the biosensor loaded by U87-type glial cells embedded in dried ficoll matrix.

Fig. 10. Comparison between the measured transmission parameter of the unloaded sensor with the sensor loaded by pure ficoll and by ficoll containing glial cells.
The cell bio-impedance can be extracted using finite element electromagnetic simulations. Optical imaging allows achieving a 2D cartography of the cell distribution on the sensor surface. This cartography is then used in a 3D electromagnetic simulator (Ansoft HFSS), to compute the cell electromagnetic influence on the sensor. Cells are modeled as uniform dielectric elements with a given conductivity and permittivity relating to their own properties. To determine these parameter values, an optimization procedure is used in order to fit the HFSS data with the measured one.
First, to overcome uncertainties due to sensor fabrication tolerances, the considered substrate permittivity substrate and sensor metallic lines conductivity in the HFSS model are adjusted in order to exactly fit simulation results of unloaded sensor with the corresponding measurement. Two or three iterations are generally required with a very good agreement with all sensors coming from the same fabrication run.
Then, a similar approach is used to find the appropriated permittivity value to set to the ficoll layer for further EM simulations, taking into account of the resonant frequency shift measured on pure ficoll loaded sensor. This second step is especially done for each sensor considering the same mesh that will be used to model the cell in the ficoll matrix. This mesh is generated based on optical microscope observation considering as many dielectric elements as cells located on the sensor. In addition, these element shapes are adjusted to fit as much as possible real cell shapes. As illustrated in Fig. 11, a dense mesh (typically the minimum edge length of tetrahedral in the sample region is 1 µm) is especially considered inside dielectric elements to enhance the accuracy of the bio-impedance extraction method. For pure ficoll simulations, dielectric elements and the ficoll matrix permittivity are set to the same value.

Fig. 11. 3D view of the mesh used to simulate the cell effect on the biosensor response.
Once the HFSS model is calibrated, keeping previous mesh and simulation conditions, the analyzed cell bio-impedance is then found once the cell loaded sensor simulated response overlays the corresponding measured sensor scattering parameters. This optimization procedure is done manually, firstly adjusting the cell permittivity which dominates the sensor resonant frequency shift. The procedure ends evaluating the cell conductivity to fine tune the simulated S 21 parameter magnitude with the measured one around the sensor resonant frequency. In the example of glial cells characterizations, the extracted conductivity and permittivity are summarized in Table 2.
The main drawback of this characterization protocol is the complete lack of control of the exact cell location in ficoll layer that induces most of uncertainties in the simulation procedure. As a result, proper cell positioning in electromagnetic simulation is crucial and requires a large and time-consuming effort.
This is why there is a great interest in developing an experimental protocol which does not need the use of any biological media during measurements in order to make sure of cell location on the sensor surface during characterizations. As detailed in the next section, a novel approach has been tested using direct cell culture on dedicated zones patterned on each sensor surface (see Figs 1(b) and 7). Micro chambers are designed to allow cell location only on the highest sensitive area where the EM field is strongly concentrated and presents a good uniformity. Hence, in these conditions, measured biosensor frequency shift becomes independent of the exact cell location into the capacitor gaps and only relies on the number of cells.
IV. ON CHIP GROWN CELL CHARACTERIZATIONS
A) New experimental protocol description
The proposed approach consists in making cells grown directly on the biosensor surface using a conventional culture media. In this configuration, SU8 micro chambers are used to concentrate cells in the sensitive areas.
Once cells have adhered, sensor will be washed and dried allowing RF measurement in air without any support media. These experimentations were performed using two different human cell types: glial (same as previously: U87 type) and neuronal cells (SH-SY5Y). These two cell types present diameters in the same order of magnitude and have distinct functions in the nervous system implying different compositions. Consequently, they are supposed to exhibit different dielectric parameters.
Initially, both glial and neuronal cells were grown at 37°C in a humidified 5% CO2 – 95% air incubator in dedicated medium for cell culture. Once a sufficient number of cells are obtained, cells are collected and put back in their culture media. Then they are seeded in six-well plates in which few sensors have been deposited.
As detailed in Fig. 12, after a couple of days, cells have adhered to the sensor substrate and started to multiply. Once the reached number of adherent cells is enough, the culture is stopped and cells are fixed using a paraformaldehyde (PFA) 4% bath to allow time stable characterization and to avoid the cell degradation during the measurement sequence. PFA is a formaldehyde solution. It means that once fixed, cells are completely preserved in their original state but they can no longer evolve from a biological point of view. Indeed, the cell membrane looks as it is frozen to any exchange with the extracellular medium. Actually, cells keep their original shape and their intracellular content as in living conditions just before the PFA bath. Biologists commonly use this kind of protocol for various analysis and that ensure us to keep cell electrical properties constant for up to 20 min measurement in air. It is important to notice that since no biological support media will be used during our measurements, this step is mandatory to allow cell integrity and reproducible measurement, in other case intracellular medium generally escapes from cell few minutes after drying the sensor.

Fig. 12. Experimental protocol flow used for on chip cell culture.
Once cells have been fixed, sensors are then washed with PBS solution following by a rinse in de-ionized water to avoid cell contamination from previously used biological media. Sensors are kept in water and dried just before measurements.
A good point is that cell adhesion occurs preferentially on the fused silica substrate rather than on gold lines or on the SU8 resist. Consequently, most of fixed cells are located on the sensitive part of the RF biosensor positioned in patterned micro culture chambers.
B) Experimental results and discussion
Contrary to measurements with ficoll, the biosensor resonant frequency calibration only requires S-parameters measurement of unloaded biosensors before cell culture. Characterizations on glial and neuronal cells have been performed in the 15–35 GHz frequency band, thanks to three different sensor designs resonating, respectively, at 15.7, 20.5, and 34.5 GHz.
One example of these measurements is presented in Fig. 13 using glial cell culture on 15.7 GHz biosensor. As shown in Fig. 14, with only eight cells inside the sensor culture chamber, a 400 MHz frequency shift has been obtained.

Fig. 13. Comparison between measured RF sensor resonant frequency before and after glial cell adhesion.

Fig. 14. Photograph of the 15.7 GHz biosensor after the cell culture: glial cell locations are indicated by circles.
From the measurement, the global cell dielectric parameters can be extracted using the same electromagnetic simulation method as with the ficoll approach (Fig. 15); but cell distribution on the sensor surface is easier to describe. Indeed, regardless of cell location in the interdigited capacitor gaps of the sensor, their influence on it resonance frequency will be identical because of the uniformity of the EM field in this region. Hence, the measured frequency shift relies only on the number of cells that actually interact with the sensor. With this approach we estimate that the accuracy relating the extracted electrical parameters can be considered below 5% as the uncertainty relating the cell location on the sensor is reduced. The main sources of errors come from the exact cell shape modeling that remains difficult to accurately reproduce in our electromagnetic simulation software. Moreover, some cells can be degraded during the culture phase but still stay on the sensor surface with different properties. In addition, uncertainty due to the electromagnetic extraction process is here included. Tests have been performed to evaluate the error introduced by the extraction process. Assuming a uniform and dense mesh at the operating frequencies, this uncertainty is very limited.

Fig. 15. 3D EM full wave modeling and experimental data fitting of glial cells interaction with the 16 GHz biosensor.
The extracted permittivity on glial and neuronal cell experiments for three different frequency points are reported in Table 3 and plotted in Fig. 16. Several measurements are performed for each frequency point and a good repeatability of measurement is reached. As one can see, on the full frequency band of analysis, neuronal cells present a much higher permittivity than glial cell type. In addition, these results seem to confirm that those obtained with the ficoll protocol on glial cells with a good agreement between extracted values in both experiments. One can notice that the real part of permittivity of glial and neuronal cells is the same at 35 GHz. At this frequency, biosensors operate outside the γ-dispersion domain of biological tissues. Above 35 GHz, variations of relative permittivity of biological cells are too tiny and biosensors reach their detection limit.

Fig. 16. Real part of permittivity versus frequency for glial cells and neuronal cells at 20°C.
Table 3. Evaluation of the real part of permittivity of glial and neuronal cells at 20°C.
The imaginary part of the permittivity and the conductivity of biological cells have not been considered in this paper, as a first approach to prove the concept of the sensor. The conductivity of the biological media has a very small influence on the measured resonance in this case.
Therefore another biosensor concept has been introduced and its potential detection capabilities are detailed in [Reference Dalmay, Pothier, Blondy, Cheray, Lalloué and Jauberteau18].
V. CONCLUSION
This paper presents an original label-free biosensing method for cellular studies at radio frequencies. This biodetection technique presents the advantage of label-free planar sensing structure and sub-millimetric size allowing to work at the cell scale with a very limited number of items. Both the feasibility of the proposed method and the detection capability of the sensor have been demonstrated. We have shown that it allows a possible discrimination between different cell types. Future works will evaluate the biosensor capability to differentiate stem cell from already differentiated cells.
Another interesting direction will be to develop analytical modeling of the sensor resonant frequency versus the biological media permittivity, based on simple RLC equivalent electrical circuit model. This will allow faster cell identification based on a cell electromagnetic signature database. The experimental approach described here will be a good basis for this work.
 Claire Dalmay received a master's degree in high frequency and optical telecommunications from the University of Limoges, France in 2006. Currently, she is working toward a Ph.D. degree at XLIM, CNRS, University of Limoges. Her main area of activity involves the development of biosensors for cell scale investigations.
 Arnaud Pothier received a Ph.D. degree in electrical engineering from the University of Limoges, Limoges, France in 2003. He is currently a full-time researcher with the Centre National de la Recherche Scientifique (CNRS), XLIM, University of Limoges. His current research activity is focused on both one tunable function developments using RF-MEMS components for analog communication modules and micro machined biosensors developments for cell analysis.
 Mathilde Cheray is a Ph.D. student in the team of homeostasis cellular and pathologies from the University of Limoges, France. Her current research activity is focused on neurooncology. She is studying the role of cell death receptor in cancer stem cells and the mechanisms to sensitize its cancer stem cells to treatment in two types of brain tumors: glioblastoma and neuroblastoma. She is trying to improve new methodologies to characterize and to perform cell sorting of cancer stem cells.
 Fabrice Lalloué received a Ph.D. degree in biology and health sciences from the University of Limoges, Limoges, France in 2001. He is currently a full-time assistant-professor at the University of Limoges in the department of physiology and is leading research into the homeostasis cellular and pathologies team. His current research activity is focused on neurobiology such as normal neural stem cells and tumor stem cells in neuroblastoma and glioblastoma.
 Marie-Odile Jauberteau received an M.D. degree from the faculty of medicine of Limoges in 1986 and a Ph.D. degree from the university of Paris VI in 1991. She is currently professor of clinical immunology at the University of Limoges leading a research group on neuroimmunology and neurooncology. She carried out research studies especially in the mechanisms of resistance of lymphocyte or glioblastoma cells to induced apoptosis.
 Pierre Blondy (M'00) received a Ph.D. degree and an habilitation degrees from the University of Limoges, France, in 1998 and 2003 respectively. He is currently a professor at the University of Limoges, leading a research group on RF-MEMS. He was a visiting researcher at the University of Michigan, Ann Arbor, USA in 1997 and at the University of California at San Diego, La Jolla, USA in 2006 and 2008. Dr. Blondy was an associate editor for the IEEE MWCL2006. He is member of the IEEE International Microwave Conference Technical Program Committee since 2003.