


INTRODUCTION
Pulsed power switches are important to pulsed power sources that provide the technological basis for the productions and applications of intense particle and laser beams (Zou et al., Reference Zou, Liu, Zeng, Han, Yuan, Wang and Zhang2006; Liu et al., Reference Liu, Yin, Ge, Zhan, Chen, Feng, Shu, Zhang and Wang2007, Reference Liu, Zou, Wang, Zeng and He2008; Zhang et al., Reference Zhang, Tang, Huang, Qiu, Guan and Wang2008; Kuai et al., Reference Kuai, Wu, Qiu, Wang, Cong and Wang2009). There are mainly two kinds of pulsed power switches, namely, gas discharge switches (Schaefer et al., Reference Schaefer, Kristiansen and Guenther1990; Frank et al., Reference Frank, Stark, Christiansen, Felsner, Gortler, Hoffmann, Prucker, Schwandner, Stetter, Tkotz and Urban1997, Reference Frank, Dewald, Bickes, Ernst, Iberler, Prucker, Rainer, Schlaug, Schwab, Urban, Weisser and Hoffmann1999) and power semiconductor switches (Jiang et al., Reference Jiang, Yatsui, Takayama, Akemoto, Nakamura, Shimizu, Tokuchi, Rukin, Tarasenko and Panchenko2004). Because of higher hold-off voltage and higher current than power semiconductor switches, spark gap switches are more suitable for high power modulators, but have difficulty in operating at high repetitive rates. The energy injected into the spark gap is deposited in the arc channel, resulting in the temperature, the density, and the particle species in this small region abnormal for a long time before the gap recovers entirely. The recovery time of a gas spark gap depends on many factors including the gas type and pressure, the injected energy, the electrode material, and the gap spacing (Moran & Hardesty, Reference Moran and Hardesty1991; Wang et al., Reference Wang, Luo and Hu2007). In order to operate the spark gap switches at higher repetitive rates, people had used some methods among which the introduction of a fast flowing gas through the spark gap is the most effective one (Mazzola et al., Reference Mazzola, Molen and Kuhlman1988; MacGregor et al., Reference MacGregor, Turnbull, Tuema and Farish1997; Schade & Ragaller, Reference Schade and Ragaller1982). Although gas-blown nozzles can be employed to fast remove the injected energy, the spark gap switches with the gas-blown systems become less compact and thus have larger inductance. Therefore, in order to enhance the recovery capability of the spark gaps without sorting to blown gas, it is necessary to have a better understanding of the dominant factors involved with the gaseous recovery. For this purpose, the statistical characteristic of the over-volted breakdown and the factors limiting the recovery of a spark gap were further experimentally investigated.
EXPERIMENTAL SETUP AND METHOD
The experiments were performed with the commonly used method, two-pulse technique. The principle of the technique was sketched in Figure 1. The tested spark gap is broken down twice when two identical voltage pulses, one after another with an interpulse spacing of Δt, are applied to the gap. The second breakdown voltage, V b2, is lower than the first one, V b1, before the tested gap recovers entirely from the first breakdown. The shorter Δt is, the lower V b2 is. The time-dependent recovery of the breakdown voltage, R Vb ≡ V b2/V b1 = f(Δt), can be obtained by changing Δt. RVb is a quantitative indicator of the gaseous recovery in the tested spark gap.

Fig. 1. Block diagram of two-pulses technique.
High voltage pulse generator 1 (HVPG1) is identical with HVPG2 and very simple in circuit as shown inside the dashed block of Figure 2. C1 is 30 nF in capacitance and R1 about 1 MΩ in resistance. Both switches S1 and S2 are closed at different time moments with a time interval of Δt by a multichannel trigger generator. The discharge current through the tested spark gap is measured with a Rogowski coil, model 101 from Pearson Electronics. The voltage across the gap is measured with a voltage divider. Both signals of the current and the voltage are fed into an oscilloscope (model DPO4104 from Textronix).

Fig. 2. Circuit of HVPG1 inside the dashed block.
As shown in Figure 3, a shunt peaking circuit consisting of C2 (1.5 nF) and R4 (54 Ω) was added in parallel with the tested spark gap. Since C2 is much smaller than C1, the applied voltage to the tested gap can be almost doubled. In addition, an inductor, L1, was added to slow down the leading edge of the applied voltage to the tested gap.

Fig. 3. Improvement by adding a shunt peaking circuit consisting of C2 in series of R4.
Figure 4 shows the measured voltage applied to the tested gap when C1 is charged to a voltage of 21 kV. The amplitude of V gap(t) was found to be 32.4 kV, corresponding to a magnification of 1.54. The waveform of V gap chopped by the gap breakdown was also given in Figure 4. It was found that the voltage regulation between two pulses from HVPG1 and HVPG2 is better than 4%.
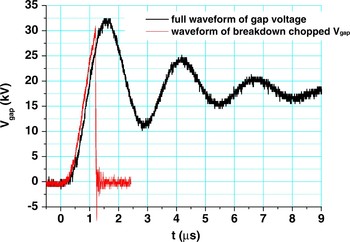
Fig. 4. (Color online) Full waveform of Vgap and the breakdown chopped waveform of Vgap when C1 is charged at 21 kV.
In order to make the electric field in the tested spark gap as uniform as possible, the electrodes with a Rogowski profile (Chang, Reference Chang1973) were used. The gap spacing between two electrodes can be changed from 0.1 mm to 14 mm. The Rogowski-profile electrodes, 50 mm in diameter and made from brass, were enclosed in a polyethylene shell with an inner diameter of 100 mm. The gas pressure inside the polyethylene shell can be varied from 0.1MPa to 1MPa. Two quartz windows were mounted on the wall of the shell for taking discharge photographs.
OVER-VOLTED BREAKDOWN
The breakdown process in a spark gap can, in general, be divided into four stages: (1) generation of electrons suitable to start electron avalanches, (2) growth of electron avalanches up to a critical size to generate streamer, (3) streamer propagation and generation of a conducting channel bridging the gap, (4) heating the conducting channel and generation of an arc. Since all these stages take time, the breakdown voltage of a spark gap depends not only on the amplitude but also on the rise rate of the applied voltage. The slower the applied voltage rises, the lower the breakdown voltage is. The lowest breakdown voltage is static breakdown voltage V b0. Pulse breakdown happens at a voltage higher than V b0 and is called over-volted breakdown.
The breakdown characteristic of the tested gap was studied with single-pulse method, i.e., only one pulse voltage was applied to the tested gap. Nitrogen was chosen as the working gas. All the breakdowns happened over-voltedly. Here we take the breakdown shown in Figure 4 as an example. The tested gap, 1.2 mm in gap spacing and filled with nitrogen at a pressure of 0.3 Mpa, broke down at a voltage of about 30 kV, much higher than V b0 of the gap that is about 14 kV according to Dakin et al. (Reference Dakin, Luxa, Oppermann, Vigreux, Wind and Winkelnkemper1974). The over-volted factor is about 2.14.
It was found that the breakdown voltage of the tested gap changes from shot to shot even under the same group of experimental conditions (the gap spacing, the nitrogen pressure, the applied voltage). The statistic behavior of the breakdown voltage was studied by performing statistical experiments in which the tested gap was broken down 200 times under the same experimental conditions, and the breakdown voltages were recorded. In the statistical experiment, these 200 shots were divided into 20 groups of 10 shots. After 10 shots for each group, the nitrogen in the tested gap was refreshed so as to keep the nitrogen clean. The time interval between shots in one group is 10 s, long enough for the gas in the gap to entirely recover from the last breakdown.
Figure 5a shows the histogram of 200 breakdown voltages for 2.7-mm gap filled with nitrogen at a pressure of 0.1 MPa. In Figure 5a, there are 200 columns corresponding to 200 events of the breakdown, and the height of each column represents the breakdown voltage for each shot. While the lowest breakdown voltage is only 12.2 kV, the highest one is 61.4 kV. Even for the lowest breakdown voltage of 12.2 kV, it is higher than V b0 of the gap that is about 10.3 kV (Dakin et al., Reference Dakin, Luxa, Oppermann, Vigreux, Wind and Winkelnkemper1974). The averaged breakdown voltage is 46.7 kV, corresponding to a mean over-volted factor of 4.53. The probability density of the breakdown voltage was plotted in Figure 5b. We tried to fit the distribution of the probability density to some known distribution functions and found that it is most fitted to Gaussian distribution with a normalized standard deviation of 20.8%.

Fig. 5. (Color online) Breakdown voltages for a 2.7-mm nitrogen gap of 0.1 MPa pressure (a); Probability density of the breakdown voltage (b).
It is easy to understand why the breakdown voltage changes from shot to shot. For the self-breakdown of a spark gap by a pulsed voltage, there is usually a time lag between the moment when the pulse voltage is applied to the gap and the moment when the breakdown of the gap happens. The time lag was divided into three parts, pulse-rise time lag t 0, statistic time lag t s, and formative time lag t f. t 0 is the time waiting for the applied voltage pulse to rise to the value of V b0, the minimum voltage for breaking down of the gap. t s is the time waiting for a seed electron to be produced in the gap and to start an electron avalanche. t f is the time waiting for the electron avalanches to grow up to a critical size and to generate streamer, and then for the streamer to propagate and to generate a conducting channel bridging the gap. The seed electron is generally produced by cosmic rays or by γ rays from the radioactive substances on the earth. It is the statistical nature of t s that makes the time lag jitter and the breakdown voltage fluctuate.
The statistical experiment of 200 breakdowns was also conducted on the same 2.7-mm gap but with a higher pressure of 0.4 MPa. The distribution of the probability density of the breakdown voltage is still a Gaussian distribution with a normalized standard deviation of 15.5%. The averaged breakdown voltage is 53.9 kV, which corresponds to a mean over-volted factor of 1.74 in consideration of V b0 being about 31 kV (Dakin et al., Reference Dakin, Luxa, Oppermann, Vigreux, Wind and Winkelnkemper1974). It was found that the mean over-volted factor of 1.74 in the case of 0.4 MPa is much smaller than that of 4.53 in the case of 0.1 MPa. The reason for this difference may be explained below.
The V b0 for 2.7-mm gap at 0.4 MPa pressure is about 31 kV, much higher than that of 10.3 kV for 2.7-mm gap at 0.1 MPa pressure, this means the pulse-rise time lag t 0 for the former is much longer than that for the latter when the rise rate of the applied voltage is the same. Actually, the seed electron may also be produced during the time of t 0, thus, the longer the t 0 is, the shorter the required t s is, which leads to a smaller over-volted factor.
Figure 6 shows the dependence of the breakdown voltage on the nitrogen pressure p and the gap spacing d. The data points of the breakdown voltage on the curves are the values averaged over 200 shots. When p is lower than 0.5 MPa, the breakdown voltage is linear to p and d in semi-logarithmic coordinate system, which means that the pulse breakdown voltage is exponential to p and d. From the curves, an empirical formula as the following could be derived to describe the relation of the breakdown voltage to p and d.

Fig. 6. (Color online) Dependence of the breakdown voltage on the nitrogen pressure and the gap spacing.
Where V b is the breakdown voltage in unit of kV; p is in unit of kPa; d is in unit of cm.
It should be indicated that the above empirical formula is applicable to the gap of a uniform electric field produced by a microsecond rising voltage pulse and filled with nitrogen of pressure in a range of 0.1 MPa–0.5 MPa.
GASEOUS RECOVERY
Gaseous recovery in a gas spark gap was studied based on R Vb, the time-dependent recovery of the breakdown voltage that was obtained from the experiment using two-pulse technique. In order to record the details of the oscillograph traces consisting of two pulses that are about 1 µs in pulse width and about 100 ms in interpulse spacing Δt, a digital storage oscilloscope of a high sampling rate and a long recording length is needed. We used an oscilloscope, DPO4104 from Textronix that has a maximal sampling rate of 5 Gs/s and 10 M recording points.
Figure 7 is a typical oscillograph trace from the experiment on a 0.8-mm gap filled with nitrogen at a pressure of 0.4 MPa. There are two breakdown chopped voltage pulses with Δt of 18.2 ms. V b1 is 25.1 kV and V b2 14.5 kV, which means that it takes the tested gap 18.2 ms to achieve a recovery of 57.8% in breakdown voltage.

Fig. 7. Typical oscillograph trace from the experiment using two-pulses technique.
As was expected, V b2 also changes from shot to shot even under a same group of the experimental conditions. The results from the statistical experiment of 200 breakdowns show that the probability density of the breakdown voltage for the second breakdown is also most fitted to Gaussian distribution, just as that for the first breakdown. Figure 8 shows the probability densities of V b1 and V b2 for 2.7-mm gap of 0.1 MPa pressure and applied with two voltage pulses of Δt equal to 100 ms. The averaged breakdown voltage for the first and second breakdown are 46.3 kV and 11.4 kV, respectively, corresponding to a mean recovery of the breakdown voltage of 24.6%. The standard deviation is 9.4 kV for V b1 and 2.55 kV for V b2.

Fig. 8. (Color online) Probability density of breakdown voltages from the experiment using two-pulses technique (a) for the first breakdown; (b) for the second breakdown.
Figures 9, 10, 11, 12 show the curves of R Vb, the recovery of the breakdown voltage, for different d and p. For the relatively short gaps, 0.8 mm and 1.2 mm, the energy-storage capacitor C1 was charged at a voltage V 0 of 21 kV. For the relatively long gaps, 2.7 mm and 3.7 mm, V 0 was 42 kV. Figure 13 is the typical waveform of the discharge current. It was found that the discharge current was almost the same for different p and d when V 0 was kept unchanged, which means that the impedance of the spark gap is much smaller than the total impedance of discharge circuit.

Fig. 9. (Color online) Recovery of the breakdown voltage for 0.8-mm gap.

Fig. 10. (Color online) Recovery of the breakdown voltage for 1.2-mm gap.

Fig. 11. (Color online) Recovery of the breakdown voltage for 2.7-mm gap.

Fig. 12. (Color online) Comparison of the recovery of the breakdown voltages between 2.7-mm gap and 3.7-mm gap at a nitrogen pressure of 0.1 MPa.

Fig. 13. Typical waveform of the discharge current.
Since both V b1 and V b2 change from shot to shot, each data point on the curves of R Vb is the value averaged over 10 shots. As a whole, R Vb rises with the increase of Δt. However, an intermediate plateau on the curve of R Vb is always observed. It is this intermediate plateau that makes the recovery of the breakdown voltage much slower.
It was noticed that the intermediate plateau starts when V b2 is a little bit higher than V b0. For instance, V b0 for 0.8-mm gap filled with nitrogen at a pressure of 0.4-MPa is about 12.5 kV. The intermediate plateau for this gap appears when R Vb is about 60%, as shown in Figure 9, which means that V b2 is equal to 15 kV in consideration of V b1 being 25.1 kV.
As we know, immediately after the extinction of an arc channel, the volume of the channel is filled with hot decaying plasma. Therefore, the gaseous recovery includes the recovery of the gas density and the electro-neutrality. The electro-neutrality recovery is the removal from the gas any residual ionization by recombination, attachment, diffusion, and so on. This was assumed to occur in the first few tens of microseconds after the extinction of arc (MacGregor et al., Reference MacGregor, Tuema, Turnbull and Farish1993), corresponding to the very beginning part of the R Vb curve. The density recovery is the removal from the gas the arc deposited energy in the form of heat by thermal conduction, convection, and radiation. This was believed to take a few milliseconds to a few tens of milliseconds, according to the measurement of the gas density with a Mach-Zehnder interferometer (Moran & Hairfield, Reference Moran and Hairfield1985). The process of density recovery happens during the time corresponding to the first rising edge of the R Vb curve and provides the gap with its static hold-off voltage. That is why the point corresponding to V b0 is always observed near the end of the first rising edge of the R Vb curve.
The processes governing the latter phases including the intermediate plateau and the second rising edge of the R Vb curve are as yet not fully clear. For the electro-negative gases, such as SF6 and air, the prolonged recovery of the latter phases was attributed to the residual negative ions that have relatively long-life times and can play an active role in the production of seed electrons for the second breakdown through the process of the collisional detachment (MacGregor et al., Reference MacGregor, Tuema, Turnbull and Farish1993). As for nitrogen that is not electro-negative, we may suggest that the process governing the latter phases is related to the delayed recombination of the residual nitrogen atoms. The metastable molecules and the atoms of nitrogen are known for their ability to store energy over extended periods of time. The explanation based on the nitrogen atoms remaining from the previous discharge and recombining on the cathode to produce the initial electrons for the succeeding discharge was shown to be fully consistent with all the experimental data obtained in the afterglow experiments (Petrović et al., Reference Petrović, Marković, Pejović and Gocić2001).
If we are right in our conjecture that the initial electrons are produced by the delayed recombination of the residual nitrogen atoms on the cathode, the intermediate plateau, and the second rising edge on the R Vb curve can be explained as the following. In the time duration of the intermediate plateau, Δt is relatively short from the first breakdown and more residual nitrogen atoms are survived. Therefore, at any moment there are always the electrons produced by the recombination of the nitrogen atoms for initiating the second breakdown. In this case, t s can be considered close to 0 and V b2 is expressed with Eq. (2):
where V a is the applied voltage; dV a/dt is the rise rate of the applied voltage.
For a given tested gap and a given applied voltage, t f is almost constant, which makes V b2 a constant and a plateau on the R Vb curve.
As the time elapses, the Δt becomes relatively longer in the time duration of the second rising edge. t s is no longer considered close to 0 due to more and more residual nitrogen atoms vanishing. Longer and longer t s are required for the second breakdown to happen, which leads to V b2 to rise again and the recovery of the over-volted breakdown voltage to begin.
It was found that the standard deviation for V b2 is normally smaller than that for V b1 if the Δt locates at a position before the end of the intermediate plateau. This phenomenon is easy to understand. As was discussed above, t s is also short when the Δt is relatively short. It is t s that make the breakdown voltage fluctuate. The shorter t s is, the smaller the standard deviation is.
From Figure 9, 10, and 11 it can be seen that an increase in pressure has resulted in an upward shift of the intermediate plateau and a shortening in the recovery time of the gaps. The upward shifted plateau comes from the result of V b2 getting closer to V b1, a reduced over-volted factor for the higher pressure as was mentioned in the last section. In this case, the first rising edge of the R Vb curve corresponding to the density recovery becomes more important and the mechanism responsible for the plateau significantly prolonging the recovery becomes less significant. It was also noticed that the rising rate of the first rising edge increases with the increasing pressure, maybe as a result of a higher pressure corresponding to a more frequent collision between the particles and leading to a fast removal of the deposited heat from the volume of the extinguished channel. All of these make a faster recovery of the gap.
Figure 12 shows that the shorter gap recovers faster than the longer gap. Since the discharge currents for 2.7-mm gap and 3.7-mm gap are almost the same, the deposited energy per unit length of the gaps during the first breakdown should be more or less the same. Furthermore, as we know, the voltage recovery is a very weak function of the energy discharged through the spark gap (Moran & Hardesty, Reference Moran and Hardesty1991). The reason for the faster recovery of the shorter gap must be something other than the deposited energy. According to the numerical simulation on the gaseous recovery of short spark gaps, the deposited heat is removed from the gap mainly due to an axial heat flow through the metallic electrodes (Wang et al., Reference Wang, Luo and Hu2007). The shorter the gap is, the easier the deposited heat goes through the electrodes and the faster the gap is cooled.
A charge coupled device camera was used to take the photographs of the discharge in the gap. The shutter of the camera was set at 5 s, so the time-integral images were obtained. To our surprise, generally, the second spark did not follow the path of the first spark. This phenomenon was also observed by Moran et al. (Reference Moran and Hairfield1985). Figure 14 is a typical photo showing two separated sparks in a 2.7-mm gap of 0.1 MPa pressure when the Δt is 500 ms.

Fig. 14. (Color online) A typical photo showing two sparks separated in space.
Two sparks separated in space were observed even if the gap only recovered 15% of its breakdown voltage. The averaged spacing between the two separated sparks is increased with Δt. When the Δt is relatively short and locates before the end of the intermediate plateau on the R Vb curve, the second spark is randomly and uniformly distributed in a distance smaller than 1 mm from the first spark. If the gap is fully recovered, the distance between the two sparks is smaller than 3 mm. As for why the second spark did not follow the path of the first spark, it may be explained in the following. According to the results of the density measurement using a Mach-Zehnder interferometer by Moran and Hairfield (Reference Moran and Hairfield1985), the spark channel heats a cylindrical region of gas that expands quickly to about 0.5 cm in diameter in the first 10 µs. If a second voltage is applied to the gap, the second breakdown will occur somewhere within this large heated region, but not necessarily through the original spark channel.
CONCLUSIONS
If a high voltage pulse with a rise time of about 1 µs is applied to a short nitrogen gap, an over-volted breakdown is always observed. The breakdown voltage of the gap changes from shot to shot even with the same experimental conditions and obeys Gaussian distribution. The over-volted factor is reduced with an increasing pressure of the nitrogen in the gap. With a 2.7-mm gap the over-volted factors are 4.53 for 0.1 MPa pressure and 1.74 for 0.4 MPa. The over-volted breakdown voltage depends individually on the gap spacing d and the gas pressure p, rather than on the product of pd. An empirical formula of the breakdown voltage as a function of p and d was derived.
The time-dependent recovery of the breakdown voltage, R Vb, was obtained with using the two-pulse technique. The second breakdown voltage also obeys Gaussian distribution, but it is normally with a smaller standard deviation especially when the interpulse spacing of Δt is relatively short. As a whole, R Vb rises with the increase of Δt. However, an intermediate plateau is always observed and it starts when the second breakdown voltage is a little bit higher than the static breakdown voltage of the gap. The first rising edge of the R Vb curve corresponds to the recovery of the electro-neutrality and the density. The intermediate plateau and the following rising edge take the spark gap much longer time to recover. The processes governing these two latter phases are as yet not fully clear. It is attributed to the delayed recombination of the residual nitrogen atoms on the cathode to produce the initial electrons for the second breakdown. An increase in pressure will result in an upward shift of the intermediate plateau and a shortening in the recovery time of the gaps. The second spark generally does not follow the path of the first spark.
ACKNOWLEDGEMENT
The authors would like to thank the National Natural Science Foundation of China for supporting the research under contracts 50777037 and 50837004.


