


Introduction
In this paper we consider the existence of supercooling that persists for timescales of months and over spatial scales of tens of metres to kilometres within the marine waters of the Earth's cryospheric regions. This issue has been controversial (Lewis & Lake Reference Lewis and Lake1971, Lewis & Perkin Reference Lewis and Perkin1983, Steele et al. Reference Steele, Mellor and McPhee1989, McPhee et al. Reference McPhee, Morison and Nilsen2008). Lewis & Lake's original opinion that there could not be persistent supercooling in the ocean was revised to recognize its existence, in particular close to ice bodies with drafts greater than 10 m (Lewis & Perkin Reference Lewis and Perkin1983). Models like that of Steele et al. (Reference Steele, Mellor and McPhee1989) predicted that a consequence of the difference in diffusivities of heat and salt under rapidly growing sea ice was that substantial supercooling should be observed. However, such supercooling has been rarely observed under Arctic pack ice, leading McPhee et al. (Reference McPhee, Morison and Nilsen2008) to the conclusion that double diffusive characteristics are not symmetric for the melting and freezing of sea ice.
Supercooling and subsequent frazil ice formation in marine waters can take place by one of at least three mechanisms (Martin Reference Martin1981): 1) by rapid heat loss to the atmosphere in leads and polynyas, 2) at the boundary between water masses of differing salinities, and 3) by melting/dissolution of ice shelves, icebergs and other ice bodies with large draft.
Supercooling in water exposed to the atmosphere (mechanism 1), such as in leads and polynyas, is known to be transitory and results in frazil ice formation. For example, recent observations show supercooling of up to 40 mK persisting over several days in Arctic polynyas (Skogseth et al. Reference Skogseth, Nilsen and Smedsrud2009). Supercooling is particularly well known to the river ice community where transient in situ supercooling of tens of millikelvin is common (Ashton Reference Ashton1986) in association with the formation of frazil ice in the water. The dynamic nature of a river ice cover can mean that supercooling persists for significant periods of the winter. In agitated freshwater, ice is nucleated by natural substances only if the temperature is several hundreds of millikelvin below the freezing point (Ashton Reference Ashton1986). Thus frazil formation in rivers is dominated by secondary nucleation on tiny fragments of ice, through processes such as collision breeding (Daly Reference Daly1984, Ashton Reference Ashton1986).
Supercooling at the boundary of water masses of different salinities (mechanism 2) arises because the molecular diffusivity of heat is c. 100 times greater than the molecular diffusivity of salts, thus cold saline water underlying fresher, warmer water will induce supercooling in the upper layer. Another consequence of the enhanced molecular diffusivity of heat with respect to that of salt is that frazil crystals growing in supercooled water are surrounded by a boundary layer containing higher salinity water (Omstedt Reference Omstedt1985) than the bulk water mass. Thus the bulk supercooling is an upper limit of that experienced at the surface of a growing ice crystal.
However, the supercooling described in this paper originates from mechanism 3. It is well known that the freezing point of seawater increases with increased pressure/depth as determined by the equation of state. Through this mechanism Foldvik & Kvinge (Reference Foldvik and Kvinge1974) postulated that conditional instability of seawater cooled below its surface freezing point by contact with an ice shelf at depth can lead to the generation of supercooled plumes that may then rise through the water column for some distance. They further hypothesized that supercooling could be relieved by the nucleation of ice crystals within the plume which may contribute to the formation of relatively porous underwater sea ice, or platelet ice, observed in the Antarctic. Robin (Reference Robin1979) then demonstrated that appreciable amounts of frazil ice might be generated in the water column by basal melting of ice shelves. Lewis & Perkin (Reference Lewis and Perkin1983) cited the operation of an ice pump (Lewis & Perkin Reference Lewis and Perkin1986) over tens of metres to explain observed supercooling of c. 4 mK at 2 m below the ice-water interface in rough sea ice in the vicinity of ice island T3 (Untersteiner & Sommerfeld Reference Untersteiner and Sommerfeld1964). The existence of supercooled water at depth in the water column close to or under ice shelves is now well-established (e.g. Lewis & Perkin Reference Lewis and Perkin1985, Nicholls et al. Reference Nicholls, Makinson and Robinson1991, Leonard et al. Reference Leonard, Purdie, Langhorne, Haskell, Williams and Frew2006).
Jeffries et al. (Reference Jeffries, Schwartz, Morris, Veazey, Krouse and Gushing1995) in the Arctic and a number of researchers in the Antarctic (e.g. Crocker & Wadhams Reference Crocker and Wadhams1989, Jeffries et al. Reference Jeffries, Weeks, Shaw and Morris1993, Gow et al. Reference Gow, Ackley and Govoni1998, Smith et al. Reference Smith, Langhorne, Trodahl, Haskell and Cole1999) have described platelet ice, an open-textured accumulation of leaf-like crystals believed to be characteristic of ice growth in supercooled water. However, direct observation of supercooling is more challenging because of the high accuracy required in temperature and salinity measurements if supercooling of the order of tens of millikelvin is to be detected. In addition the error in freezing point calculation, ± 0.003°C (UNESCO 1978), must be considered. The possible presence of ice crystals in the water column adds to uncertainties. Lewis & Perkin (Reference Lewis and Perkin1985) in their oceanographic survey of McMurdo Sound in October and November 1982 observed supercooling in near-surface waters throughout the sound, with a maximum value of 45 mK in the western sound, while Smith et al. (Reference Smith, Langhorne, Haskell, Trodahl, Frew and Vennell2001) observed near-surface supercooling of the order of 10 mK at two sites in the eastern sound. Based on their springtime estimates of vertical mixing and its influence on heat flux beneath the sea ice cover, Stevens et al. (Reference Stevens, Robinson, Williams and Haskell2009) predicted that the supercooled water might extend 250 km north of the front of the McMurdo Ice Shelf, a conjecture supported by the known distribution of platelet ice in the sound (Barry & Dayton Reference Barry and Dayton1988, Dempsey et al. Reference Dempsey, Langhorne, Robinson, Williams, Haskell and Frew2010).
Most oceanographic observations in McMurdo Sound have been conducted during the period from September–February (Heath Reference Heath1971, Reference Heath1977, Neal et al. Reference Neal, Crew and Broome1976, Lewis & Perkin Reference Lewis and Perkin1985, Mitchell & Bye Reference Mitchell and Bye1985, Barry Reference Barry1988, Barry & Dayton Reference Barry and Dayton1988, Smith et al. Reference Smith, Langhorne, Haskell, Trodahl, Frew and Vennell2001, Albrecht et al. Reference Albrecht, Vennell, Williams, Stevens, Langhorne, Leonard and Haskell2006, Robinson et al. Reference Robinson, Williams, Barrett and Pyne2010). Littlepage (Reference Littlepage1965) defined two “oceanographic” seasons in McMurdo Sound: “summer” which extends from December–April and “winter” which extends from April–December. Previous measurements in McMurdo Sound made during the oceanographic winter are summarized in Table I.
Table I Summary of historical oceanographic measurements over winter months in McMurdo Sound. T = temperature, S = salinity.

The object of this paper is to provide evidence to link the long assumed relationship between sea ice structure and oceanic circulation in McMurdo Sound, Antarctica. In particular this paper characterizes the development of near-surface supercooling through winter from March–September. The measurements presented herein are the first of sufficient accuracy to observe the seasonal evolution of supercooling in the upper ocean in this region. Critical factors in the evolution of the supercooled layer are salt rejection from growing sea ice and the removal of heat from surface waters. Heat removal occurs both locally and at a distance through the transport of ice shelf modified waters. The presence of the supercooled layer is important in the development of the local sea ice, and also reflects regional ice shelf interactions.
Study area
McMurdo Sound (Fig. 1) is adjacent to the south-western Ross Sea. It is bounded on the west by Victoria Land, on the east by Ross Island, and to the south by the McMurdo Ice Shelf. The waters below the McMurdo Ice Shelf access the McMurdo Sound via Haskell Strait. McMurdo Sound is typically ice-covered during winter months. The southern extent of ice break out in the spring varies interannually, with the ice cover in some years breaking out all the way to its boundary with the McMurdo Ice Shelf. During the summer of 2002–03 the sea ice broke out to c. 3 km south of Cape Royds (Fig. 2), due to the presence of the B-15a and C-19 icebergs in the western Ross Sea (Brunt et al. Reference Brunt, Sergienko and MacAyeal2006, Remy et al. Reference Remy, Becquevort, Haskell and Tison2008, Robinson et al. Reference Robinson, Williams, Barrett and Pyne2010).

Fig. 1 Map of region of interest. Map data are from the Antarctic Digital Database (SCAR 1993), except bathymetry data, which are from Davey Reference Davey2004.

Fig. 2 MODIS Level 1B visible band image from 27 February 2003, acquired from NASA GSFC Level 1 and Atmospheric Archive and Distribution System (http://ladsweb.nascom.nasa.gov/, accessed March 2010). The tanker turning basin is located at site A, at the southern extent of the ice breaker channel. The Ross Ice Shelf polynya, when active, opens immediately to the north of the Ross Ice Shelf edge.
During summer the annual sea ice cover over the south-western Ross Sea retreats, leaving large expanses of open water. However during the summer of 2002/03, the recorded sea ice concentration in the Ross Sea remained considerably higher than average (Comiso & Nishio Reference Comiso and Nishio2008), resulting in significantly less open water during January and February 2003 (Brunt et al. Reference Brunt, Sergienko and MacAyeal2006). Ice concentration in the south-western Ross Sea returned to its seasonal average by April, indicating that the 2003 sea ice growth in the south-western Ross Sea was anomalously low due to the presence of the icebergs.
A large proportion of the sea ice generation in the western Ross Sea each year occurs within the Ross Sea and Terra Nova Bay polynyas (Petrelli et al. Reference Petrelli, Bindoff and Bergamasco2008). Any decrease in the ice-free time and spatial extent of these polynyas may lead to reduced ice production during the growth season in the western Ross Sea and a corresponding reduction in the volume of brine injected into surface waters. For a significant portion of March sea ice covered much of the area typically encompassed by the Ross Sea polynya and Terra Nova Bay polynya. This implies that ice production rates in these polynyas were probably reduced in comparison with typical rates for this time of year.
Dinniman et al. (Reference Dinniman, Klinck and Smith2007) investigated the effects of changes in sea ice extent between 2001 and 2003 on the Ross Sea water mass distribution and circulation using a general circulation model. Their results indicate a reduced advection of warm surface water during summer from the Ross Sea polynya into McMurdo Sound due to both blocking by icebergs (mainly B-15a) and to the late opening of the Ross Sea polynya in early 2003 caused by the position of iceberg C-19. However, simulations suggest that during 2001–03 the increased variability of sea ice created larger volumes of High Salinity Shelf Water (HSSW) than is usual (Dinniman et al. Reference Dinniman, Klinck and Smith2007).
Instruments and methods
Oceanographic observations presented herein consist of winter-long records of mixed layer temperature and salinity and short-term (one to two days) records of temperature and salinity measured both immediately below the ice water interface and at c. 1 m intervals to a depth of 275 m. Temperatures through the sea ice cover were monitored from early March as sea ice began to form on a previously ice-free area. Numerous ice cores were also taken of this first-year sea ice and from surrounding multi-year ice and are detailed in Purdie et al. (Reference Purdie, Langhorne, Leonard and Haskell2006). Oceanographic measurements were made by instruments suspended on steel wires that passed through holes drilled in the sea ice. Heated huts were placed over the holes to keep them ice-free throughout the winter.
The winter-long temperature and salinity measurements, logged at 30 min intervals, were taken at a site on the multi-year ice located at 77°52′59.8″S, 166°40′0.7″E, referred to as site B, between 20 March and 9 May, and at a tanker basin cut into the multi-year ice at the terminus of the icebreaker re-supply channel at 77°48′41.5″S, 166°26′1.8″E, known as site A, between 10 May and 12 September (Fig. 2). Site B was located farther into McMurdo Sound and closer to the McMurdo Ice Shelf than site A (note that the transition from multi-year ice to ice shelf is not clearly evident in Fig. 2). Leonard et al. (Reference Leonard, Purdie, Langhorne, Haskell, Williams and Frew2006) contains a detailed description of the measurement sites.
Salinities are calculated from conductivity-temperature-depth (CTD) measurements, and the practical salinity scale is used to quantify salinity. Two Seabird SBE-37 (microcat) CTD loggers with accuracies of ± 0.002°C (in temperature), and ± 0.004 (in salinity) were deployed at 10/20 m and 50 m depth. A Seabird Electronics SBE-19plus profiling CTD (herein referred to as the CTD) was used to measure salinity and temperature to a depth of c. 275 m at site A. The stated accuracies of this instrument are ± 0.01°C (in temperature), and ± 0.01 (in salinity), however, temperature cross checks made routinely with the microcats (after applying the linear temperature correction to the CTD as described in Leonard et al. Reference Leonard, Purdie, Langhorne, Haskell, Williams and Frew2006) indicated temperature uncertainties were better than the stated accuracy. These profiles were conducted at 30 min intervals for 6, 24 or 48 hour periods.
A Seabird conductivity-temperature (CT) instrument, mounted on an L-arm to minimize the effect of an access hole (Smith et al. Reference Smith, Langhorne, Haskell, Trodahl, Frew and Vennell2001), was used to measure supercooling c. 0.15 m below the ice-water interface, with the freezing point of seawater being determined using the UNESCO formulation (UNESCO 1978). The accuracy of this instrument is ± 0.001°C (in temperature) and ± 0.004 (in salinity). This instrument was usually deployed at times when CTD profiles were taken. In addition water samples were collected from c. 1 m below the ice-water interface, from which the oxygen isotope composition of the seawater was measured.
Oceanographic setting
The basic features of the oceanography of McMurdo Sound have been summarized by Lewis & Perkin (Reference Lewis and Perkin1985) and Robinson et al. (Reference Robinson, Williams, Barrett and Pyne2010). The waters of the sound are conditioned by exchange with the cavity beneath the McMurdo Ice Shelf to the south and flow from the south-western Ross Sea to the north, where the dominant water mass below 100 m is HSSW, generated by the polynyas in this region (Loose et al. Reference Loose, Schlosser, Smethie and Jacobs2009). In general waters enter the sound from the north in the eastern sound and move in a cyclonic pattern to exit to the north in the western sound (Lewis & Perkin Reference Lewis and Perkin1985, Barry & Dayton Reference Barry and Dayton1988, Robinson et al. Reference Robinson, Williams, Barrett and Pyne2010). Diurnal tides dominate (Goring & Pyne Reference Goring and Pyne2003, Leonard et al. Reference Leonard, Purdie, Langhorne, Haskell, Williams and Frew2006, Robinson et al. Reference Robinson, Williams, Barrett and Pyne2010), modulated by a 13.99 day spring-neap envelope, although semi-diurnal internal tides have also been observed (Albrecht et al. Reference Albrecht, Vennell, Williams, Stevens, Langhorne, Leonard and Haskell2006). These tides carry warmer waters under the ice shelf (MacAyeal Reference MacAyeal1985b) as well as causing mixing of water from depth towards the surface (MacAyeal Reference MacAyeal1985a, Stevens et al. Reference Stevens, Robinson, Williams and Haskell2009).
Sites A and B are located in the eastern sound and thus might be expected to be dominated by the ocean climate from the north. This view has been compiled from spring/summer observations and modelling (e.g. Assman et al. Reference Assman, Hellmer and Beckmann2003), and contrasts with the measurement of the current at 6–8 m depth at site A. This surface current, which was southward in March and early April, was observed to swing toward the north-east from mid-April (Leonard et al. Reference Leonard, Purdie, Langhorne, Haskell, Williams and Frew2006). This general northward flow is in agreement with the late winter circulation pattern described by Lewis & Perkin (Reference Lewis and Perkin1985) and with the pattern of incorporated platelet ice in McMurdo Sound compiled by Dempsey et al. (Reference Dempsey, Langhorne, Robinson, Williams, Haskell and Frew2010) from historical measurements (see Fig. 3). To explore these competing influences we begin by examining the possible source(s) of water at our observation sites.

Fig. 3 Map of relative platelet abundance from Dempsey et al. (Reference Dempsey, Langhorne, Robinson, Williams, Haskell and Frew2010) and synoptic ocean currents adapted from Lewis & Perkin (Reference Lewis and Perkin1985). Greater/lesser platelet abundance is denoted by darker/lighter shading. The locations of site A and site B are indicated by red triangles. The light magenta arrow represents the residual surface current from 13–16 April at site A and the dark magenta arrow represents the residual surface current from 9–22 May.
A plot of potential temperature versus salinity (Fig. 4a) demonstrates the seasonal evolution of the stratification beneath the sea ice and the manner in which the water column becomes cooler and more saline through the winter months. The time series at 50 m also shows that the temporal variability of temperature and salinity decreases through winter. By early June the water column to 250 m has cooled below its surface freezing point, a strong indication of the water having had some interaction with an ice shelf at depth. As the end of winter approaches it can be seen that these surface waters are tending towards HSSW (Lewis & Perkin Reference Lewis and Perkin1985, Jacobs et al. Reference Jacobs, Fairbanks and Horibe1985, Loose et al. Reference Loose, Schlosser, Smethie and Jacobs2009) due to brine rejection caused by sea ice formation and probable advection of HSSW into the sound from the south-western Ross Sea.

Fig. 4 Potential temperature-salinity plot, with sigma-t indicated by the thin lines. The dashed line represents the surface freezing temperature. All measurements are from between 0 and 250 m depth. a. The lines represent time-averaged 24 or 48 hour values at 2 m intervals to a depth of 250 m at site A. The dots, colour coded with respect to time, represent data at 50 m taken at site B from April until 9 May and at site A after this. The box in the right of the figure represents the potential temperature-salinity signature of High Salinity Shelf Water (HSSW). b. Time-averaged 24 or 48 hour values plotted at 2 m intervals to a depth of 250 m at site A. Compared with data from October–November 1982 at site 29 (a similar location to site A), site 56 at the mouth of McMurdo Sound, and site 53 close to the McMurdo Ice Shelf in the centre of the sound from Lewis & Perkin (Reference Lewis and Perkin1985), and November 2004 from Albrecht (Reference Albrecht2005) at a site c. 10 km north-west of site A.
These observations are in general agreement with historical oceanographic observations made through the winter months in McMurdo Sound (Table I). However, none of these previous measurements have been of sufficient accuracy to observe the seasonal evolution of supercooling in the upper ocean. The earliest observations are from the British (Terra Nova) Antarctic Expedition (Deacon Reference Deacon1975). There was then a gap of approximately half a century and the next winter observations were made in the late 1950s and early 1960s (Gilmour et al. Reference Gilmour, McDonald and van der Hoeven1962, Tressler & Ommundsen Reference Tressler and Ommundsen1962, Littlepage Reference Littlepage1965). Interest in repeating such measurements has been revived in the past decade (Hunt et al. Reference Hunt, Hoefling and Cheng2003, Leonard et al. Reference Leonard, Purdie, Langhorne, Haskell, Williams and Frew2006, Mahoney et al. unpublished). Comparisons have not been made in Fig. 4b with the early observations of Table I because the re-analysis required to compare different sampling techniques is beyond the scope of this paper. Instead we put our data in perspective by comparing our temperature and salinity measurements with those reported at the end of winter by Lewis & Perkin (Reference Lewis and Perkin1985) and Albrecht et al. (Reference Albrecht, Vennell, Williams, Stevens, Langhorne, Leonard and Haskell2006). The winter data are consistent with those taken at a similar location in October and November 1982 by Lewis & Perkin (Reference Lewis and Perkin1985) at their site 29 (Fig. 1). Lewis & Perkin (Reference Lewis and Perkin1985) described how the water at sites, such as their site 29, has evolved as the result of ice growth in Ice Shelf Water (e.g. their site 53) as shown on Fig. 4b, mixed with water from the north (their site 56). However, data collected in November 2004 (Albrecht Reference Albrecht2005) (see Fig. 1 for site location) indicate that waters were less saline than both those at the end of 2003 (in September) and those measured at a similar location by Lewis & Perkin (Reference Lewis and Perkin1985). Robinson et al. (Reference Robinson, Williams, Barrett and Pyne2010) have alluded to the atypical oceanographic conditions that existed in the sound due to the iceberg modified operation of the Ross Sea polynya. These anomalies may be partially responsible for the discrepancies between 2003 and 2004.
From these salinity data we may calculate the mass of salt per unit area in the top 250 m of the water column as a function of time. In Fig. 5 we compare this to the total mass per unit area added to the water column due to the formation and desalination of land-fast sea ice at site A. The latter data are derived from temperature and salinity measurements on the first-year sea ice throughout the winter (Purdie et al. Reference Purdie, Langhorne, Leonard and Haskell2006). In the anomalous conditions of 2003 much of the sound was covered at the end of the summer with multi-year ice (refer to Fig. 2) c. 4.5 m thick, overlain with a snow cover of c. 725 mm thick. The ice cover thickened at a rate of c. 2.1 mm per day through the winter, whereas the ice forming within the former tanker basin at site A was growing at rates of up to 10 mm per day in March and April, eventually reaching a thickness of c. 1.85 m by late winter. Thus in 2003 the salt injection at site A would have been significantly greater than the average across the sound. Nonetheless the increase in the mass of salt in the water column exceeds that from sea ice growth at site A. From this we conclude that the increase in upper ocean salinity at the site is mainly determined by sea ice production in the Ross Sea, either in the marginal and pack ice zones or the Ross Sea polynya.

Fig. 5 Time comparison of the mass of salt injected by sea ice formation and desalination per unit area of the sea ice in the icebreaker channel and the mass of salt in the water column to a depth of 250 m. Note that data are matched on 10 April as the origin of the water column data was not measured.
In support of this conclusion we examine the computed salt surplus over winter at site A (defined as the mass of salt in the top 250 m minus the mass added to the water column due to ice formation and desalination). From Fig. 5 we see that by late winter there is a surplus of 37 kg m-2 at site A. Following on from the discussion above, the surplus at site A is expected to be significantly less than the surplus expected in those areas of the sound covered by multi-year ice, but may be representative of areas of the sound that were ice-free at the end of summer. If this surplus was taken to apply to the entire sound, we can estimate the necessary additional thickening of the sea ice cover to account for the difference between the mass of salt in the upper water column and the mass of salt added to the water column due to ice growth. If we take salinities and densities respectively of 34.5 and 1025 kg m-3 for the upper ocean, and 6 and 980 kg m-3 for the ice, we arrive at an additional ice cover thickening of 1.32 m, or increase in ice production of 4 km3 in the sound (taking the area of the sound to be c. 3000 km2). This is an order of magnitude less than the Ross Sea polynya model-derived sea ice production of 61.3 km3 for the period 15 June–16 July 2002 of Petrelli et al. (Reference Petrelli, Bindoff and Bergamasco2008). Consequently, although the opening of the Ross Sea polynya was six weeks later in summer 2002–03 than normal (Petrelli et al. Reference Petrelli, Bindoff and Bergamasco2008, Robinson et al. Reference Robinson, Williams, Barrett and Pyne2010), sufficient salt could have been produced there to account for the observed difference between salt injected due to local ice formation and the observed increase in the salinity in the top 250 m of the water column.
Further we estimate the flux of HSSW that would be required to explain the 37 kg m-2 salt surplus. Such a surplus requires c. 1011 kg of salt to be accumulated during a five month period over the area of McMurdo Sound, by mechanisms other than the freezing of sea ice. Assuming the salinity of HSSW advecting into the sound is 34.85, and that this replaces water with a salinity of 34.50 (as above), a volume flux of c. 0.025 Sv is needed to account for the surplus. In the upper 250 m of the water column it is assumed that the flow into the eastern half of the sound is from the north, with a similar flux of McMurdo Sound water flowing from the south through the western sound. Robinson et al. (Reference Robinson, Williams, Barrett and Pyne2010) estimated the average supply through the entire depth of the eastern sound (c. 20 km wide and c. 500 m deep) to the subice shelf cavity to be c. 1.8 Sv. Our estimate of the flux required to supply the observed salt surplus sits comfortably beneath this, confirming the supply of HSSW from the north as a probable contributor to the salt balance of McMurdo Sound.
The source of the near-surface waters is investigated further by examining the stable oxygen isotope ratios from water samples taken c. 1 m below the ice-water interface. In most cases the data point is an average over four samples taken at different times in the tidal cycle. These are shown in Fig. 6 with reference to Ross Sea water types reported in Jacobs et al. (Reference Jacobs, Fairbanks and Horibe1985) and Loose et al. (Reference Loose, Schlosser, Smethie and Jacobs2009). Most of the averaged data lie within error of the freeze-melt line of Antarctic Surface Water (AASW) as defined by Jacobs et al. (Reference Jacobs, Fairbanks and Horibe1985). Antarctic Surface Water is the name given to the mixed layer at the sea surface that has been modified by interactions with the atmosphere and ice. The presence of AASW at the surface in McMurdo Sound agrees with the February observations of Jacobs et al. (Reference Jacobs, Huppert, Holdsworth and Drewry1981). Figure 6 implies that the surface waters tend towards the properties of HSSW as winter proceeds, in agreement with Fig. 4a. Most striking is that there is little evidence of δ18O values characteristic of glacial melt. This contrasts with the late winter, near-surface measurements of Smith (Reference Smith2001) at a nearby location who reported δ18O values close to those characterizing glacially-modified Antarctic surface water (AASWG) or shallow ice shelf water (SISW) (Jacobs et al. Reference Jacobs, Fairbanks and Horibe1985). Indeed the only significant excursion from the trend occurs in late July/early August when the water was c. 5 mK warmer than would have been expected if it had cooled at a constant rate throughout the winter, more saline by 0.006, and isotopically heavier than the samples collected before and after. Marine frazil ice has positive δ18O values, with values of c. +2 (Tison et al. Reference Tison, Khazendar and Roulin2001). Warming of the ocean that caused melting of the marine frazil ice would therefore explain the observed δ18O anomaly and the decrease in salinity.

Fig. 6 Oxygen isotope ratio versus salinity for water sampled c. 1 m below the ice-water interface. In most cases the data point is an average over four samples taken at different times in the tidal cycle, with the range shown by a bar. There was only one measurement on 22 July. These are compared with δ18O-salinity signatures including ranges for Ross Sea water types circumpolar deep water (CDW), high salinity shelf water (HSSW), shallow ice shelf water (SISW), Antarctic surface water (AASW85) and glacially-modified Antarctic surface water (AASWG) reported in Jacobs et al. (Reference Jacobs, Fairbanks and Horibe1985) and Antarctic surface water as identified in Loose et al. (Reference Loose, Schlosser, Smethie and Jacobs2009) (AASW09). The dashed line indicates changes in the δ18O in the ocean as sea ice freezes or melts.
Thus the surface water at site A is clearly influenced by water from the north, as indicated by the higher δ18O values and the salinity of water, while the fact that the upper water column is cooled below surface freezing point suggests the additional influence of the ice shelf.
Winter cooling in upper ocean
Depth profiles of potential temperature as derived from the CTD casts taken at site A are shown in Fig. 7 for selected 48, 24 or 6 hour durations from April–September. Casts were taken to 250 m at c. 30 min intervals during each sampling period. Average salinity profiles over the same time intervals as measured by the CTD are shown for the seven month duration of the experiment (see Fig. 7). Each profile is the average of either 96, 48 or 12 casts. The most evident feature is the increase in salinity as winter progresses, presumably due to brine rejection during the formation of sea ice (Leonard et al. Reference Leonard, Purdie, Langhorne, Haskell, Williams and Frew2006) and the influx of HSSW into the sound. As this water was close to its freezing temperature, its density was determined by its salinity.
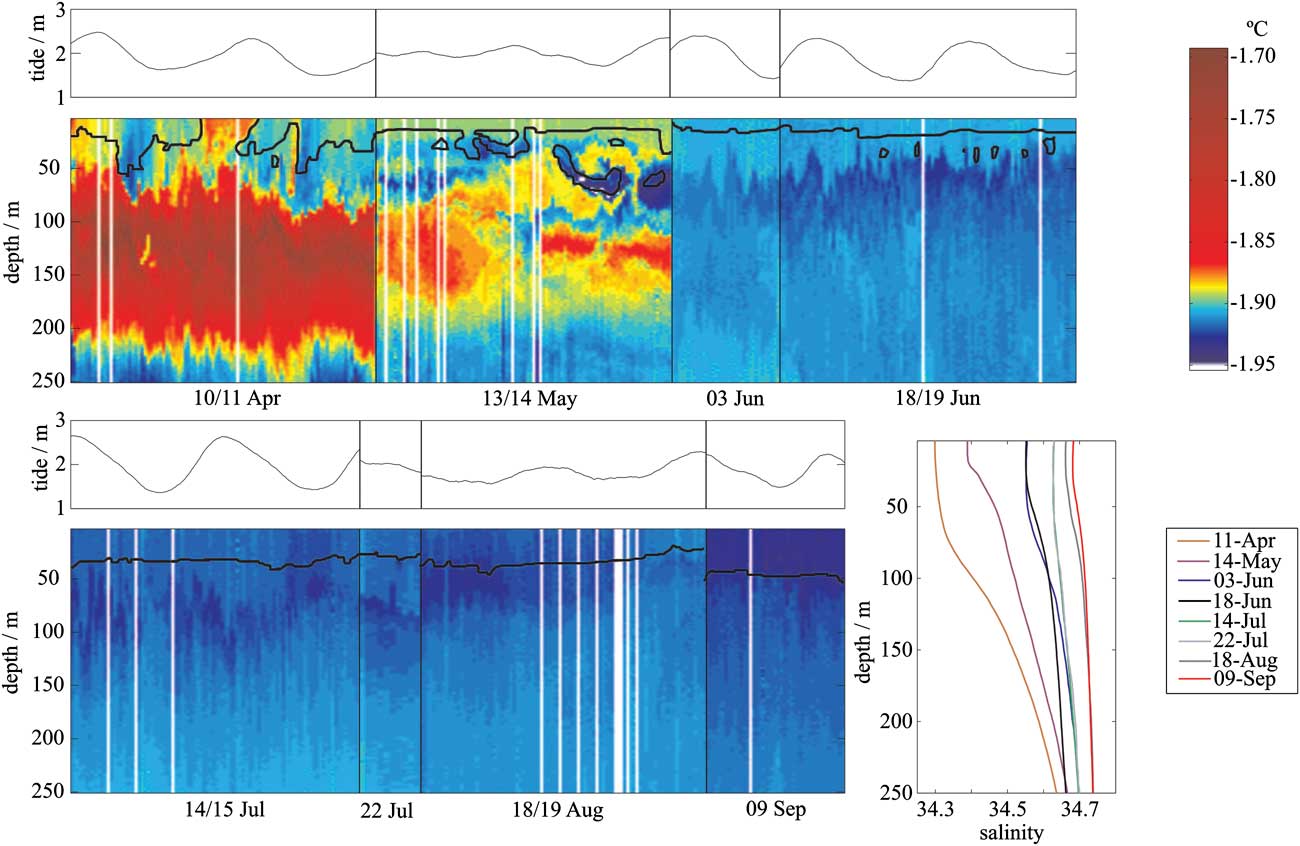
Fig. 7 Selected high temporal resolution temperature composites for April–September at site A. Composite is compiled from 96, 48 or 12 casts over 48, 24 or 6 hour periods respectively, with the width of the plot proportional to the length of the record. Tidal heights, measured at Scott Base, are predominantly diurnal and are shown above the composite. Salinity profiles are averaged over 48, 24 or 6 hour time periods. The heavy black line indicates the deepest limit of in situ supercooled water.
A very cold band of water at 50 m depth first appears in mid-May at site A. Initially it is held at the base of the mixed layer by the more buoyant water above. As winter progresses and the mixed layer becomes more saline due to salt rejection from the growing sea ice, this cold band of water gains access to the base of the sea ice cover. The remnants of the warmer water of the previous summer at mid depth are entirely eroded by early June.
An overview of the difference in temperature from the in situ freezing point as derived from CTD casts and moorings is shown in Fig. 8a, as the thickness of the supercooled layer developed through winter. As mentioned in the previous section there is a warming event in the latter half of July that temporarily reverses the trend of increasing depth and intensity of the supercooled layer over time. The trend is re-established by mid-August, and the September measurements show that the supercooled layer has reached a depth of c. 40 m and contains the most supercooled water measured over winter. Higher frequency variability in the depth of the supercooled layer is shown in Fig. 7, with transitory in situ supercooled water appearing between 30 and 70 m on 14 May and lasting c. 17 hours.

Fig. 8 Development of supercooling in the upper water column from April–September 2003. a. Supercooling below the ice-water interface at site A. Colour indicates the magnitude of the in situ supercooling. The small rectangles closest to the surface are from the conductivity-temperature (CT) instrument positioned 0.15 m below the interface, the vertically oriented lines are compiled from conductivity-temperature-depth (CTD) casts, and the horizontally oriented lines are from microcat moorings at 10 or 20 m. The grey colour indicates the absence of supercooling in the measurement record, and the dashed grey line indicates the deepest limit of the supercooled water. b. Depth-dependence of the difference from in situ freezing point in the top 40 m of the water column beneath freezing sea ice. Error bar of ± 0.004 is shown. Data are derived from three independent instruments: CTD casts (solid lines) averaged over 12, 48 or 96 casts, microcat moorings (circles) averaged over the same time period as the CTD cast, and CT deployments (squares).
The profile of in situ supercooling in this layer to a depth of 40 m is shown in Fig. 8b. From midwinter (July) the peak supercooling lies c. 4 m below the ocean surface, which is just over 2 m below the ice-water interface. The supercooling appears to approach zero at the interface as expected.
Heat sink for supercooling
The influence of supercooling on the formation of ice crystals in the water column and their appearance in the sea ice cover is examined in Fig. 9. Purdie et al. (Reference Purdie, Langhorne, Leonard and Haskell2006) have measured the conductive heat flux through the sea ice and the latent heat flux due to ice growth. The difference is assumed to be the contribution from the ocean, either as a heat flux Fw, or as an equivalent flux of ice crystals. The contribution of this residual flux to the ice thickness, ![]() at time t, is shown in Fig. 9. The hw (as described in Purdie et al. Reference Purdie, Langhorne, Leonard and Haskell2006) is consistent with observations of the crystal structure of the sea ice cover at site A (also shown in Fig. 9).
at time t, is shown in Fig. 9. The hw (as described in Purdie et al. Reference Purdie, Langhorne, Leonard and Haskell2006) is consistent with observations of the crystal structure of the sea ice cover at site A (also shown in Fig. 9).

Fig. 9 Ice growth due to the residual heat flux (conductive minus latent heat flux) from Purdie et al. (Reference Purdie, Langhorne, Leonard and Haskell2006) (solid black line). Also shown is the structure of the sea ice. The integral of the temperature deficit (supercooling) over the supercooled layer beneath the sea ice at the time the sea ice formed is also shown as solid red circles.
The figure also shows the integral of the supercooling, ΔT(z,t), through the water column to the lower boundary of the in situ supercooled layer, zb. That is, for positive depth z beneath the ice-water interface at time t, Fig. 9 shows ![]() . This integral is superimposed on Fig. 9 and its agreement with the temporal dependence of hw implies a correlation between the two quantities.
. This integral is superimposed on Fig. 9 and its agreement with the temporal dependence of hw implies a correlation between the two quantities.
If we assume the ice crystals in the water column grow in situ, relieving the supercooling close to the interface, we would expect the amount of near-surface supercooling to be reduced at times when there is a contribution to sea ice thickness from the oceanic heat sink. However, Fig. 9 shows the extent of supercooling appears to increase during times of ice growth/accumulation. That is
![\[--><$$> \displaylines{ {{h}_w}(t) \propto & {\int}_{\!\!\!\!0}^{t} {{{F}_w}\,dt} \, \ {\rm{and}}\,{\int}_{\!\!\!\!0}^{{{{z}_b}}} {\Delta T(z,t)\,dz \propto {{h}_w}(t)} \cr & \Rightarrow {\int}_{\!\!\!\!0}^{{{{z}_b}}} {\Delta T(z,t)\,dz \propto } {\int}_{\!\!\!\!0}^{t} {{{F}_w}\,dt} . \cr} \eqno\rm<$$><!--\]](https://static.cambridge.org/binary/version/id/urn:cambridge.org:id:binary:20160203064504941-0217:S0954102011000265_eqnU3.gif?pub-status=live)
This implies the presence of a heat sink below the supercooled layer which drives both the ice growth/accumulation and the increase in near-surface supercooling. Examination of Fig. 7 indicates that there is a band of very cold water below the supercooled layer at 50–100 m depth that appears to persist for months, and could act as a local heat sink. The McMurdo Ice Shelf lies only 7 km distant from site A and terminates in a broad flat region that extends c. 30 km from the ice front. This region is c. 40 m deep (McRae Reference McRae1984, Rack & Haas, personal communication 2009), and is the obvious area of last contact between the supercooled water and an ice shelf. Thus we conclude that the main source of near-surface supercooling is downward heat transfer to the outflowing halocline rather than direct contact with the ice shelf base.
This conclusion offers an alternative explanation for the observed changes in δ18O and striking lack of glacial melt noted in Fig. 6. The insert in Fig. 7 shows the average salinity (density) profiles at selected times through winter. It can therefore be seen that the stratification decreases over the winter, reducing the barrier to exchange between surface and deeper waters. Since we have identified the halocline water as having low temperatures, we might expect its δ18O signature to be similar to that of SISW, and if heat, salt and δ18O were mixed at the same rate, a line fit to the observations would have a steeper slope than the sea ice freezing line in Fig. 6. Consequently a stronger negative δ18O tendency might be expected as the stratification decreases over the winter. The δ18O time series could be interpreted as a rising trend until midwinter (mid-June), followed by a rather abrupt decrease from 22 July driven by the upward mixing of the pycnocline water of ice shelf origin as the density contrast disappeared. The increasing trend in the surface waters in early winter (until June) may be due to the remnants of the entrainment of HSSW from the north. Further speculation awaits the acquisition of additional data since there is evidence (Smith Reference Smith2001, Robinson, personal communication 2008, Mahoney & Gough, personal communication 2010) that the relatively heavy isotopic signatures presented herein may be peculiar to the presence of icebergs.
Discussion and conclusion
Measurements of salinity, temperature and δ18O were made in the upper ocean immediately beneath the sea ice cover, at a site adjacent to an ice shelf, through six months of winter in 2003. During 2003 the formation of new sea ice in McMurdo Sound and in the south-western Ross Sea was anomalously low due to the presence of the B-15a and C-19 icebergs in the western Ross Sea. Consequently atypical oceanographic conditions also existed in the sound (Robinson et al. Reference Robinson, Williams, Barrett and Pyne2010) and would almost certainly have influenced the oceanographic measurements. However, the 2003 winter observations are generally consistent with shorter term observations in other years, for example those of Lewis & Perkin (Reference Lewis and Perkin1985) and Smith et al. (Reference Smith, Langhorne, Haskell, Trodahl, Frew and Vennell2001). Oceanographic observations coupled with salt budget calculations for the sound are used to estimate that a flux of at least 0.025 Sv of HSSW was needed to account for the observed evolution of salinity in the sound. This almost certainly originated in the south-western Ross Sea.
A major feature observed in the CTD measurements is shown in Fig. 7. From early June at a depth of c. 70 m a band of very cold water was observed at the base of the mixed layer (defined by the haloclines in the insert) where it was confined by the more buoyant water above. As described by Leonard et al. (Reference Leonard, Purdie, Langhorne, Haskell, Williams and Frew2006), as winter progressed this layer became colder, and more saline due to freezing of sea ice and salt flux from the north. Consequently it also became thicker and denser. Eventually this cold water, which had been trapped by buoyancy in a band at the base of the mixed layer, became dense enough to gain access to the ice-water interface. This band probably originated beneath the McMurdo Ice Shelf and formed part of the circulation in McMurdo Sound.
During the six months of winter observation a layer of water that was supercooled below its in situ freezing point persisted adjacent to the sea ice at site A located 7 km from the McMurdo Ice Shelf. While the thickness of this layer was not constant, on average it was of the order of tens of metres deep. It appears there were only short time periods, for example, approximately five hours on 10/11 April (see Fig. 7), when it temporarily dissipated. This confirms the supposition of others (e.g. Hellmer Reference Hellmer2004, Stevens et al. Reference Stevens, Robinson, Williams and Haskell2009) that these features are persistent both in time and space.
In polar waters ocean temperature is effectively a passive tracer with salinity controlling both density stratification and freezing point. Thus both salinity and temperature determine supercooling. As winter progressed the supercooled layer trended towards greater thickness and extent of supercooling. However, it also varied with timescales of hours (see Fig. 7), with the deepest transitory in situ supercooled water appearing between 30 and 70 m on 14 May and lasting c. 17 hours. Variations of the order of days (Fig. 8a) were also observed. In particular it responded to a warming event in the ocean in late July. There are many possible drivers of this variability, ranging from high frequency processes associated with turbulence generation (Stevens et al. Reference Stevens, Robinson, Williams and Haskell2009), through mixing processes associated with shear and internal tides (Albrecht et al. Reference Albrecht, Vennell, Williams, Stevens, Langhorne, Leonard and Haskell2006, Stevens et al. Reference Stevens, Stewart, Robinson, Williams and Haskell2010) and extending to seasonal scale events (Mahoney et al. unpublished). Due to the large number of potential drivers, further speculation on the factors controlling the variability of thickness and extent of supercooling in this near-surface layer is beyond the scope of this paper.
Lewis & Perkin (Reference Lewis and Perkin1985) have shown that, at the end of winter, the pattern of near-surface supercooling is linked to the circulation of McMurdo Sound. Using data from other sources, Dempsey et al. (Reference Dempsey, Langhorne, Robinson, Williams, Haskell and Frew2010) have identified the pattern of platelet ice incorporated into the sea ice cover, this being consistent from year to year. The results broadly confirm the “platelet abundance index” deduced from spring measurements made in November 1984 by Barry (Reference Barry1988). As shown in Fig. 3 the patterns of late winter circulation and platelet ice abundance in the sea ice cover are clearly related. Further, Fig. 9 shows the heat sink below the supercooled layer, which drives some portion of the growth of platelet ice, also drives an increase in near-surface supercooling. Consequently the contours of platelet abundance in Fig. 3 reflect the pattern of winter oceanic heat flux in McMurdo Sound. We have therefore provided the evidence to link the long-assumed relationship between sea ice structure and oceanic circulation. Further we may hypothesize that the time evolution of the supercooled layer described in this paper could be extended to deduce the spatial distribution of negative oceanic heat flux over larger and more inaccessible areas of coastal Antarctic sea ice.
This paper provides a description of the conditioning of the upper ocean by interaction with an ice shelf. It shows that the influence is persistent, has a major influence on the upper ocean, and contributes significantly to sea ice thickness. Although this work increases our understanding of the complex interaction between ocean, sea ice and ice shelf, continued investigation of this system is required to further the development of methods to predict its response to a warming climate.
Acknowledgements
This study was funded by the Marsden Fund of New Zealand, the Foundation for Research Science and Technology, the University of Otago, the New Zealand National Institute of Water and Atmospheric Research and Industrial Research Ltd. The authors would like to thank Johno Leitch for field support, the Scott Base 2003 winter-over crew, Antarctica New Zealand and the U.S. Antarctic Program for logistical assistance, the technicians of the Department of Physics at the University of Otago for instrument construction, and Nicole Albrecht, Craig Stevens, Natalie Robinson, Inga Smith and Andy Mahoney for valuable discussions, and two anonymous reviewers for their insightful comments and suggestions for improving the manuscript.


