

Management Implications
Most plant demographic studies focus on vital annual rates (reproduction, survival, and growth). However, the implementation of invasive species management and control activities requires identifying months or seasons when the vital rates of these species increase. We provide evidence that the demographic study of invasive species such as black elderberry (Sambucus nigra) through multistate demographic models (based on capture–recapture methods of animals) can improve demographic prediction at the intra-annual scale. Our results showed that the application of management and control strategies is necessary for S. nigra during the rainy season, when there is a favored increase in the survival rates of seedlings, growth rates, and the number of fruits of adults. This knowledge can help focus management efforts at certain times of the year and stages of the life cycle of S. nigra. Therefore, applying multistate demographic models in invasive species could reduce economic costs and speed up concrete management actions.
Introduction
Demography represents a powerful tool to predict the increase of vital rates of invasive species and develop management and control strategies (Jelbert et al. Reference Jelbert, Buss, McDonald, Franco, Scott, Jones, Salguero-Gómez, Buckley, Knight, Silk, Sargent, Rolph, Wilson and Hodgson2019). Historically, population studies of invasive species have been analyzed with projection matrices that determine annual parameters (DeWalt Reference DeWalt2006; Jelbert et al. Reference Jelbert, Buss, McDonald, Franco, Scott, Jones, Salguero-Gómez, Buckley, Knight, Silk, Sargent, Rolph, Wilson and Hodgson2019; Jongejans et al. Reference Jongejans, Shea, Skarpaas, Kelly and Ellner2011; Ramula et al. Reference Ramula, Knight, Burns and Buckley2008). However, empirical evidence demonstrates that variation of the vital rates of plant species in an intra-annual period can have the same magnitude as inter-annual variation (Shriver Reference Shriver2016). Furthermore, invasive species exhibit demographic plasticity that allows them to modify their vital rates in response to variability in precipitation (Allaie et al. Reference Allaie, Reshi and Wafai2005; Drenovsky et al. Reference Drenovsky, Grewell, D’Antonio, Funk, James, Molinari, Parker and Richards2012; Wainwright et al. Reference Wainwright, Wolkovich and Cleland2012). Changes in the onset and duration of the rainy season promote a priority effect in the acquisition of resources in invasive species that favors a high production of flowers, fruits, and seeds and a high survival rate of the seedlings (Bonilla-Valencia et al. Reference Bonilla-Valencia, Castillo-Argüero and Martínez-Orea2017a; Munguía-Rosas et al. Reference Munguía-Rosas, Parra-Tabla and Montiel2013; Prevéy and Seastedt Reference Prevéy and Seastedt2014; Wainwright et al. Reference Wainwright, Wolkovich and Cleland2012; Wolkovich and Cleland Reference Wolkovich and Cleland2011). Likewise, it has been demonstrated that reproductive changes can modify the allocation of resources for survival and growth in adult stages (El-Barougy et al. Reference El-Barougy, Cadotte, Khedr, Nada and Maclvor2017; Madsen et al. Reference Madsen and Marko2016; Miller-Rushing et al. Reference Miller-Rushing, Høye, Inouye and Post2010; Shriver Reference Shriver2016).
At present, it is necessary to explore new methodological strategies to advance our understanding of the intra-annual demographic dynamics of invasive species (Averill et al. Reference Averill, DiTommaso, Mohler and Milbrath2011; Jelbert et al. Reference Jelbert, Buss, McDonald, Franco, Scott, Jones, Salguero-Gómez, Buckley, Knight, Silk, Sargent, Rolph, Wilson and Hodgson2019). For example, in many plants, individuals are not always detected during field surveys, and ignoring this imperfect detectability can result in biased estimates of demographic rates (Alexander et al. Reference Alexander, Slade, Kettle, Pittman and Reed2009; Shefferson et al. Reference Shefferson, Sandercock, Proper and Beissinger2001). Specifically, if individuals are erroneously considered dead or absent, whereas in reality they were present, then estimated vital rates may be seriously underestimated. This is particularly true for the juvenile phases of most plants, which may be undetectable within the surrounding vegetation (Kéry and Gregg Reference Kéry and Gregg2003). Demographic models for animal populations, based on the capture and recapture of individuals in the field, explicitly account for this imperfect detectability and have been widely applied to address several ecological questions and challenges, including the management and control of invasive species (Christy et al. Reference Christy, Yackel Adams, Rodda, Savidge and Tyrrell2010; Sandercock Reference Sandercock2006; Sass et al. Reference Sass, Cook, Irons, McClelland, Michaels, O’Hara and Stroub2010). In particular, multistate models (Brownie et al. Reference Brownie, Hines, Nichols, Pollock and Hestbeck1993; Nichols and Kendall Reference Nichols and Kendall1995) allow estimation of survival and growth rates of different life cycle stages based on the simultaneous estimation of the probability of detection of such different stages. For instance, seedlings have a lower probability of being detected during field surveys compared with adult plants (Kéry and Greg 2003). In addition, most of these capture–recapture methods, including multistate models, can be applied at an intra-annual scale (Vargas-García et al. Reference Vargas-García, Argaez, Solano-Zavaleta and Zúñiga-Vega2019; White et al. Reference White, Kendall and Barker2006). Such an application allows examining the effects of environmental factors that vary within years (e.g., the rainy season) on the life history and demographic rates of species of interest (Moustakas and Evans Reference Moustakas and Evans2015). Therefore, we propose that multistate demographic models that calculate stage-specific detection probabilities represent a way to evaluate the response of invasive plants to environmental variability. Based on this analytical approach, we can identify critical times of the year that promote increased survival, growth, and reproduction of invasive species (Moustakas and Evans Reference Moustakas and Evans2015; White and Burnham Reference White and Burnham1999; White et al. Reference White, Kendall and Barker2006).
Through a multistate demographic model, we analyze the demographic dynamics of black elderberry (Sambucus nigra L.), also known as “elderberry, American elder or common elder” (Atkinson and Atkinson Reference Atkinson and Atkinson2002). Sambucus nigra is an invader tree up to 15-m high; of European origin, it has been expanding quickly in the disturbed temperate forests of Africa and America (Atkinson and Atkinson Reference Atkinson and Atkinson2002; Bonilla-Valencia et al. Reference Bonilla-Valencia, Castillo-Argüero and Martínez-Orea2017a; CABI 2020; Cornelissen et al. Reference Cornelissen, Gresnigt, Vermeulen, Bokdam and Smit2014; Goodall and Braack Reference Goodall and Braack2019; Hidayati et al. Reference Hidayati, Baskin and Baskin2000; Kabuce and Priede Reference Kabuce and Priede2006; Möllerová Reference Möllerová2005; Vibrans Reference Vibrans2019). Sambucus nigra nowadays ranges from Canada to Panama as a component of woody scrub vegetation that may appear in previously disturbed areas (Atkinson and Atkinson Reference Atkinson and Atkinson2002; Hidayati et al. Reference Hidayati, Walck and Taylor2010). It currently occurs in the Abies religiosa temperate forest in the Magdalena River basin (MRB) in Mexico City, an area severely affected by deforestation, livestock grazing, and branched plants (Bonilla-Valencia et al. Reference Bonilla-Valencia, Espinosa-García, González, Lindig-Cisneros, Martínez-Orea, Vega-Peña and Castillo-Argüero2020; Santibáñez-Andrade et al. Reference Santibáñez-Andrade, Castillo-Argüero and Zavala-Hurtado2015).
The aims of this study were twofold. First, we assessed the reproductive response of S. nigra to the rainy season through the repeatability index, which quantifies repetition of traits as a function of the environment, calculating phenotypic plasticity index (Munguía-Rosas et al. Reference Munguía-Rosas, Parra-Tabla and Montiel2013; Nakagawa and Schielzeth Reference Nakagawa and Schielzeth2010). We hypothesized that low repeatability indexes and high phenotypic plasticity index values indicate that the reproductive phenology of S. nigra directly responds to the rainy season, whereas, high repeatability indexes and low phenotypic plasticity index values indicate that the reproductive phenology of S. nigra does not respond to the rainy season. Second, we used a multistate demographic model to evaluate the additive and interactive effects of the rainy season, reproductive phenology, and the stage category (size) on the survival and transition/retrogression probabilities among stage categories. We hypothesized that S. nigra presents a resource acquisition strategy that favors soil moisture availability during the rainy season. Therefore, we expect that the rainy season promotes a greater allocation to reproductive structures and an increase in the survival and transition rates of S. nigra.
Materials and Methods
Study Area and Field Methods
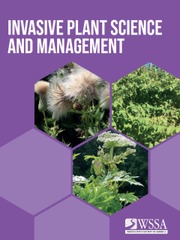
This study was carried out in an Abies religiosa forest in the MRB, southwest of Mexico City, Mexico (19.2313889°N, 99.3416667°W) (Figure 1A and B) (Santibáñez-Andrade et al. Reference Santibáñez-Andrade, Castillo-Argüero and Zavala-Hurtado2015). The climate is temperate subhumid according to Köppen’s classification, with a rainy season from June to October and a dry season from November to May (García de Miranda Reference García1973). The winter minimum temperature is 0 C, and the summer maximum is 20 C. The annual mean precipitation ranges from 950 to 1,300 mm (Dobler-Morales Reference Dobler-Morales2010). We established seven plots (25 by 25 m) using a simple random method (x, y), leaving at least 50-m distance between them. All individuals of S. nigra in each plot (n = 255) were surveyed six times (every 2 mo on average) from January to December 2015. We measured the diameter at breast height (DBH) in the woody individuals and the basal diameter in non-woody individuals. In cases where more than one trunk was present (policaulescence), the basal area was the sum of all trunks or stems. The individuals were classified into four categories depending on DBH and basal diameter. All individuals with early leaves and a basal diameter less than 1 cm were classified as seedlings, and all non-woody individuals with a basal diameter of 1.1 to 5.0 cm were classified as juveniles. All woody individuals with DBH of 5.1 to 15 cm were classified as adults 1, and woody individuals with DBH > 15 cm were classified as adults 2.
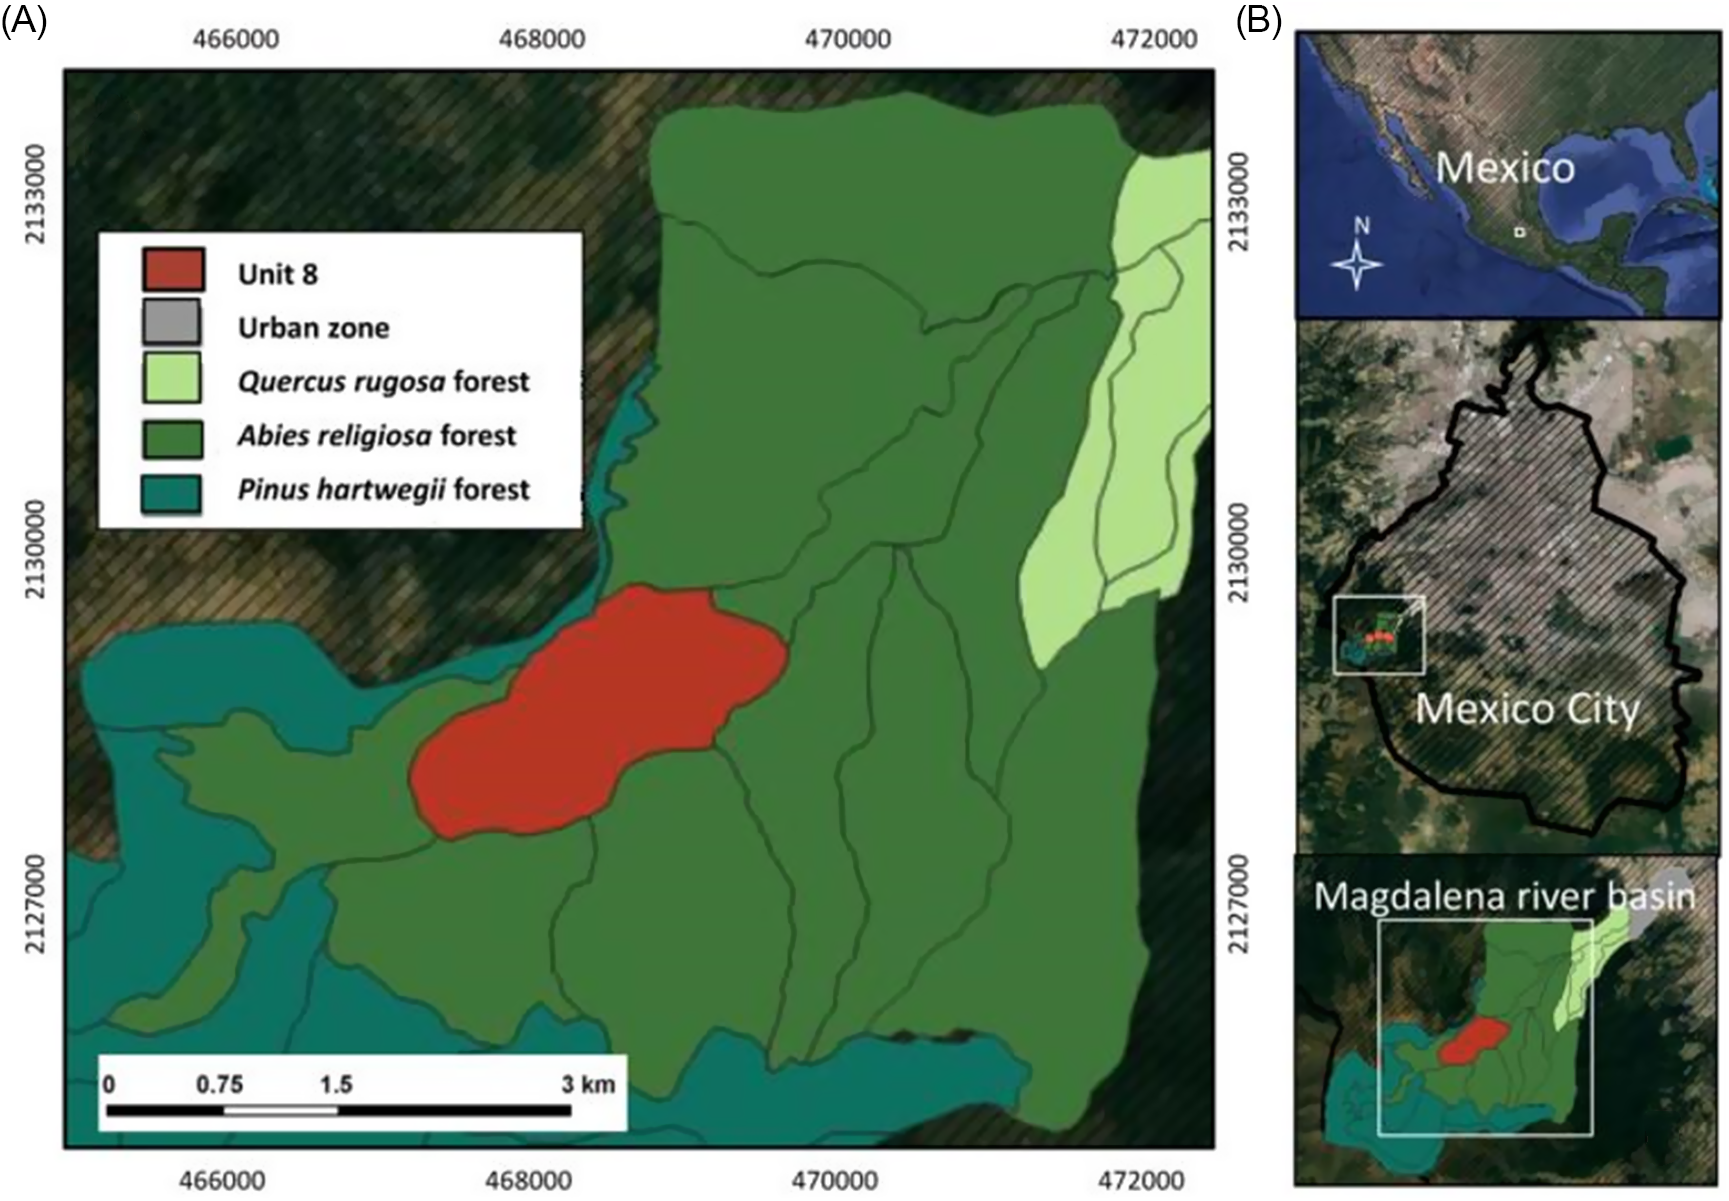
Figure 1 Location of the study site (A) within the Abies religiosa forest of Mexico City, Mexico (B).
Reproductive Patterns
We estimated the average number of mature flowers and fruits produced by individuals in adult categories monthly during the year of study (2015). The species presents corymbose racemes in adult plants and displays creamy-white flowers pollinated by bees, beetles, and flies (Figure 2A) (Arreguín-Sánchez Reference Arreguín-Sánchez and Rzedowski2001; Atkinson and Atkinson Reference Atkinson and Atkinson2002; Debussche and Isenmann Reference Debussche and Isenmann1994). The fruits are bivalve drupes, dark purple to black at maturity (Figure 2B), with three to five seeds mainly dispersed by birds (Arreguín-Sánchez Reference Arreguín-Sánchez and Rzedowski2001; Atkinson and Atkinson Reference Atkinson and Atkinson2002; Debussche and Isenmann Reference Debussche and Isenmann1994). To quantify the number of mature flowers and fruits per individual, we used the scale proposed and modified by Bonilla-Valencia et al. (Reference Bonilla-Valencia, Castillo-Argüero and Martínez-Orea2017a). A U-test was performed to establish differences in the number of flowers and fruits between the two categories of adult trees. In addition, we carried out a Shapiro-Wilk test to determine normality. Both analyses were carried out using the statistical program R v. 3.5.2 (R Development Core Team 2019).
Figure 2 Reproductive structures of Sambucus nigra: (A) white inflorescences and (B) drupes (fruits). (C) Adult individual. (Drupes modified from Kabuce and Priede [Reference Kabuce and Priede2006].)
Repeatability and Phenotypic Plasticity Indexes
To assess the response of reproductive phenology to the rainy season variation for 2 yr, we calculated repeatability and phenotypic plasticity indexes, following the method outlined by Nakagawa and Schielzeth (Reference Nakagawa and Schielzeth2010) and proposed by Munguía-Rosas et al. (Reference Munguía-Rosas, Parra-Tabla and Montiel2013) for reproductive phenology studies. We considered reproductive phenological data for 2 yr, including current reproductive phenological data (2015) and the previously obtained data (2014) for the same individuals (Bonilla-Valencia et al. Reference Bonilla-Valencia, Castillo-Argüero and Martínez-Orea2017a). The repeatability index (RI) is the total variation among repeated measures of certain traits (Nakagawa and Schielzeth Reference Nakagawa and Schielzeth2010). RI considers that phenotypic plasticity is defined as an expression of different phenotypes in response to environmental variability (Nakagawa and Schielzeth Reference Nakagawa and Schielzeth2010; Stoffel et al. Reference Stoffel, Nakagawa and Schielzeth2017). RI values are low when environmental conditions affect phenotype and are obtained from different measures (Stoffel et al. Reference Stoffel, Nakagawa and Schielzeth2017). Therefore, RI is considered inversely proportional to the phenotypic plasticity index (PI) (Nakagawa and Schielzeth Reference Nakagawa and Schielzeth2010). We first calculated the adjusted RI through a linear mixed-effects model (LMM) with the rpt.remlLMM.adj function from the package rptR (Stoffel et al. Reference Stoffel, Nakagawa and Schielzeth2017), using R v. 3.5.2 (R Development Core Team 2019). LMM estimated RI through the variation among groups (V G) over the sum of V G and within-group (residual) variance (V R) (e.g., group, months, and years) (Stoffel et al. Reference Stoffel, Nakagawa and Schielzeth2017):
 $${\rm{RI}} = {{{V_{\rm{G}}}} \over {{V_{\rm{G}}} + {V_{\rm{R}}}}}$$
where RI is the repeatability index, and V G is the variation among groups. V R is the within-group (residual) variance. When RI is equal to 1, it indicates repeated measurements at the same time (monthly), and when it is equal to 0, it indicates the absence of measurements at the same time (monthly).
The repeatability indexes were assessed with a 95% confidence interval (CI), calculated with a parametric bootstrap using 1,000 permutations. The rainy season was based upon a nearby study area (Monte Alegre station; SMN 2018). The amount of precipitation was considered a fixed effect on the repeatability indexes. Meanwhile, the plot number and month of the year were considered as random crossed effects. Through the values of l, the phenotypic plasticity indexes (PI) were obtained with the following equation:
 $${\rm PI}=1-{\rm RI}$$
where PI is the phenotypic plasticity index and RI is the repeatability index. When PI is equal to 1, it indicates phenotypic plasticity, and when it is equal to 0, it indicates the absence of phenotypic plasticity.
Multistate Models Analysis
We estimated the survival (ϕ), transition (ψ), and detection (p) rates of S. nigra throughout six sampling occasions (times or visits, denoted as t) within a year (January to December 2015) for four stage classes into which the population was sorted: seedling, juvenile, adults 1, and adults 2. These rates were estimated with multistate models using maximum-likelihood routines in the computer program MARK, based on capture–mark–recapture analyses (White and Burnham Reference White and Burnham1999). This procedure is used mainly in animal species to reduce the uncertainty in detecting individuals (recapture probabilities) (White and Burnham Reference White and Burnham1999). In our study species, several individuals of all stage classes were not detected at least once during our field surveys (30 out of 154 seedlings [19%], 9 out of 44 juveniles [20%], 4 out of 28 adults 1 [14%], and 2 out of 29 adults 2 [7%]), which justified the use of demographic models that explicitly estimated stage-specific detection probabilities. Multistate models accounted for this imperfect detectability and permitted the calculation of demographic rates on intra-annual scales (Brownie et al. Reference Brownie, Hines, Nichols, Pollock and Hestbeck1993; Nichols and Kendall Reference Nichols and Kendall1995; Stanley and Burnham Reference Stanley and Burnham1998; Vargas-García et al. Reference Vargas-García, Argaez, Solano-Zavaleta and Zúñiga-Vega2019). In the constructed models: (1) The survival rate (ϕ) is the probability that an individual survives the time interval i to i + 1. (2) The transition rate (ψ) is the probability of transit between stages during the interval starting at time i. The transition probability included individuals’ transit to the next stage (ψG; growth) and individuals’ transit from the previous stage (ψR; retrogression). (3) The detection rate (p) is the probability of sampling (resighting) the individuals in each category at time i (White et al. Reference White, Kendall and Barker2006). Our models considered transit probabilities to the following stages (ψG): from seedlings to juveniles, from juveniles to adults 1, and from adults 1 to adults 2, and the probabilities of permanence in the same stage category (1 – ψ). These models also considered the transit probabilities from a particular stage to the previous stage, representing retrogression probabilities (ψR) of juvenile to seedling, adults 1 to juvenile, and adults 2 to adults 1.
We considered that survival (ϕ), transition/retrogression (ψ), and detection (p) probabilities of S. nigra varied depending on the following factors: (1) stage categories (st: seedlings, juvenile, adults 1, and adults 2) across sampling occasions (t), (2) reproductive activity (r) determined by the presence of reproductive structures (reproductive or non-reproductive), (3) phenological stage (ph), making the distinction between flower production (February to May) and the presence of fruits (August to October), and (4) season (s). We divided the year into two periods (seasons): the rainy season (May to October) and the dry season (November to April) (according to Monte Alegre weather station, Mexico City; SMN 2018).
We built models that represented different hypotheses about variation in ϕ, p, and ψ. A set of 605 models was analyzed, where ϕ, ψ, andp varied as a function of the different factors. Regarding ϕ and ψ, 11 types of models were constructed. Therefore, for ϕ and ψ, (1) we built null or constant models (.) in which we estimated a single intercept for the parameters of survival (ϕ) and transition/retrogression (ψ). We built models in which survival (ϕ) and transition/retrogression (ψ) probabilities varied among (2) stage categories (st), (3) reproductive activity (r), (4) phenological reproductive stage (ph), and (5) seasons (s). Likewise, for ϕ and ψ, we included models that considered the (6) additive (st + s) and (7) interactive (st * s) effects of the stage categories and season. For ϕ and ψ, the models also considered the (8) additive (st + r) and (9) interactive (st * r) effects of the stage categories and reproductive activity, as well as the (10) additive (st + ph) and (11) interactive (st * ph) effects of stage categories and phenology stage. We only considered the effects of ph and r for adults 1 and adults 2. We did not consider the interaction between ph and r as a source of variation for ϕ and ψ across sampling occasions (t), because these two factors are alternative (mutually exclusive) ways to model the effect of reproduction. In addition, for detection probability (p), five types of models were constructed—a null or constant model and models that considered variation among stage categories (st), reproductive activity (r), phenological reproductive stage (ph), and season (s).
Based on the Akaike information criterion adjusted for small sample sizes (AICc), we selected the best-fitting model, corresponding to the lowest AICc. We also calculated ΔAICc, which is the difference between the AICc values of each model with respect to the best-supported model (Burnham and Anderson Reference Burnham and Anderson2002). Models that differ by fewer than two AICc units (ΔAICc < 2) also had strong support in the data (Burnham and Anderson Reference Burnham and Anderson2002). In addition, for each model, we calculated AICc weight (w), which represented a relative measure of the strength of evidence in favor of each model. Based on these weights (w), we calculated weighted averages across all models for the survival (ϕ), detection (p), and transition (ψ) rates of plants in different stage classes (Burnham and Anderson Reference Burnham and Anderson2002).
Results and Discussion
Repeatability and Phenotypic Plasticity Indexes of Sambucus nigra
Phenotypic plasticity is one of the main attributes that allow several invasive species to adjust their flowering and fructification patterns to environmental variability (Atlan et al. Reference Atlan, Hornoy, Delerue, Gonzalez, Pierre and Tarayre2015; Colautti et al. Reference Colautti and Anderson2017; Munguía-Rosas et al. Reference Munguía-Rosas, Parra-Tabla and Montiel2013; Prevéy and Seastedt Reference Prevéy and Seastedt2014). Sambucus nigra showed low repeatability index values in patterns of flowers (Rl = 0.22, SE = 0.04, CI = 0.14 to 0.31) and fruits (Rl = 0.21, SE = 0.04; CI = 0.15 to 0.28). Therefore, we confirmed our expectation that the reproductive phenology of the species of study has high phenotypic plasticity index values (flowers: Pl = 0.78; fruits: Pl = 0.79). Although a comparison of the reproductive responses of S. nigra and the native species of the community was not made in the present study, S. nigra probably demonstrated an earlier reproductive response to the rainy season. We found evidence that S. nigra increased flower production during the dry season and fruit production in the rainy season (Figure 3).
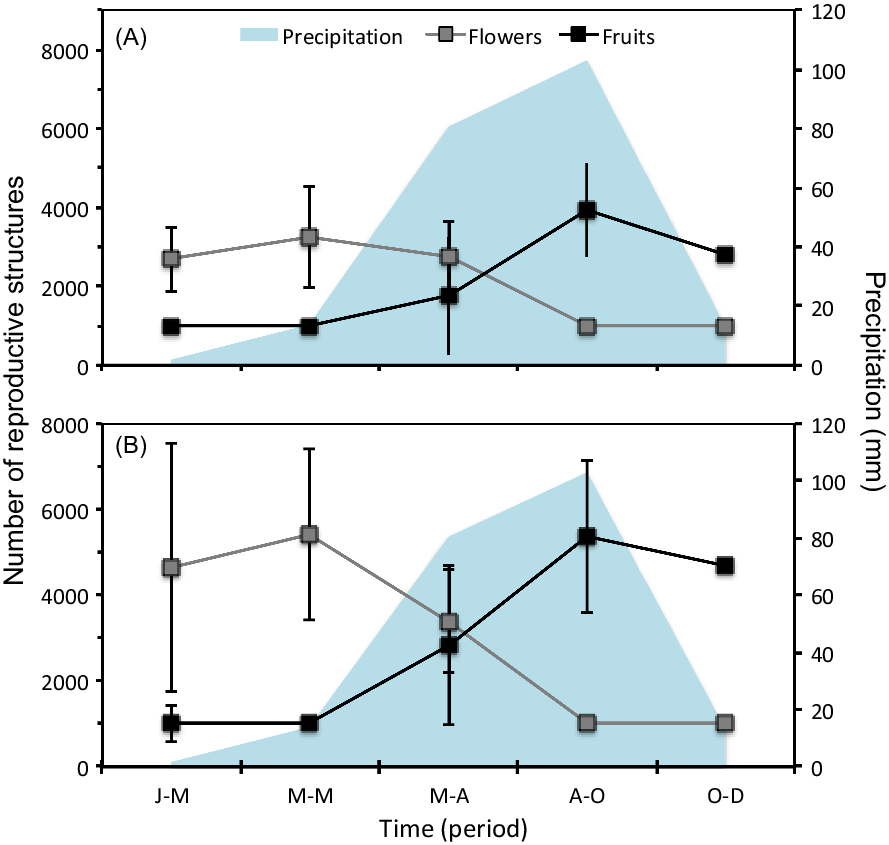
Figure 3 Precipitation values and number of reproductive structures of Sambucus nigra: (A) adults 1 and (B) adults 2. Vertical bars denote SE. Periods: J-M, January to March; M-M, March to May; M-A, May to August; A-O, August to October; O-D, October to December.
In contrast, most native species of the community present a high production of flowers and fruits in the middle and at the end of the rainy season (Bonilla-Valencia et al. Reference Bonilla-Valencia, Martínez-OreaY, Barajas-Guzmán, Romero-Romero and Díaz-López2017b). Even though more studies are required to evaluate how the reproductive characteristics of S. nigra promote its invasion, these characteristics probably favor its performance during the first stages of its life cycle. For example, the development of fruits at the start of the rainy season (Figure 3) could favor the early dispersal of its seeds and a priority effect in the acquisition of resources during their germination (as seen in Miller-Rushing et al. Reference Miller-Rushing, Høye, Inouye and Post2010; Schantz et al. Reference Schantz, Sheley and James2019; Wainwright et al. Reference Wainwright, Wolkovich and Cleland2012). In the study area, S. nigra showed a higher establishment of seedlings during the start of the dry season, just before the recruiting of most of the species in the community (LB-V, personal observation).
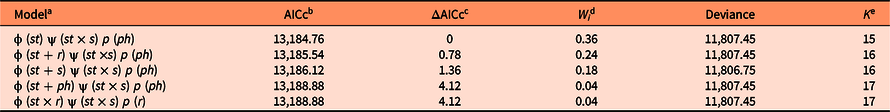
Population Model of Sambucus nigra
For S. nigra, we marked a total of 255 individuals at the beginning of the study, of which 154 were seedlings, 44 juveniles, 28 adults of category 1, and 29 adults of category 2. Table 1 shows the best-fitting multistate models (ΔAICc < 2) that explain intra-annual variation in survival (ϕ), transition (ψ), and detection (p) rates of S. nigra. Survival rates (ϕ) of S. nigra respond to the additive effects of the stage categories (st) with the reproductive allocation (r) and the season (s) (Table 1). Yearly averages and precipitation totals have been incorporated as aggregate measurements of variability in the demography; therefore, intra-annual demographic studies are necessary to understand how the variation in the vital rates of plant species respond to the rainy season in real time (Shriver Reference Shriver2016). In this study, we demonstrated that the rainy season promoted changes in vital rates of S. nigra within a year. Results supported the theory that the environmental variability in short timescales influenced the demographic dynamics of invasive species (Allaie et al. Reference Allaie, Reshi and Wafai2005; El-Barougy et al. Reference El-Barougy, Cadotte, Khedr, Nada and Maclvor2017; Richardson et al. Reference Richardson, Pyšek, Rejmánek, Barbour, Panetta and West2000; Shea et al. Reference Shea, Sheppard and Woodburn2006; Wainwright et al. Reference Wainwright, Wolkovich and Cleland2012). For example, Sebert-Cuvillier et al. (Reference Sebert-Cuvillier, Paccaut, Chabrerie, Endels, Goubet and Decocq2007) demonstrated that black cherry (Prunus serotina Ehrh.), an invasive tree species in temperate forests in Europe, continually modified its demographic rates according to environmental variability. It is probable that the effect of the rainy season is mainly important for the survival rate of S. nigra during the seedling stage. The survival rates of seedlings increased during the rainy season (mean ± SE: 0.95 ± 0.01; Figure 4A). Meanwhile, the survival rates of juveniles and both adult categories did not differ between seasons (Figure 4B–D). The rainy season is frequently a critical factor during the first stages of the life cycle of most plants (Perkins and Owen Reference Perkins and Owens2003; Shriver Reference Shriver2016), as observed in glossy privet (Ligustrum lucidum W.T. Aiton), an invasive tree species (Fernandez et al. Reference Fernandez, Ceballos, Aragón, Malizia, Montti, Whitworth-Hulse and Grau2020).
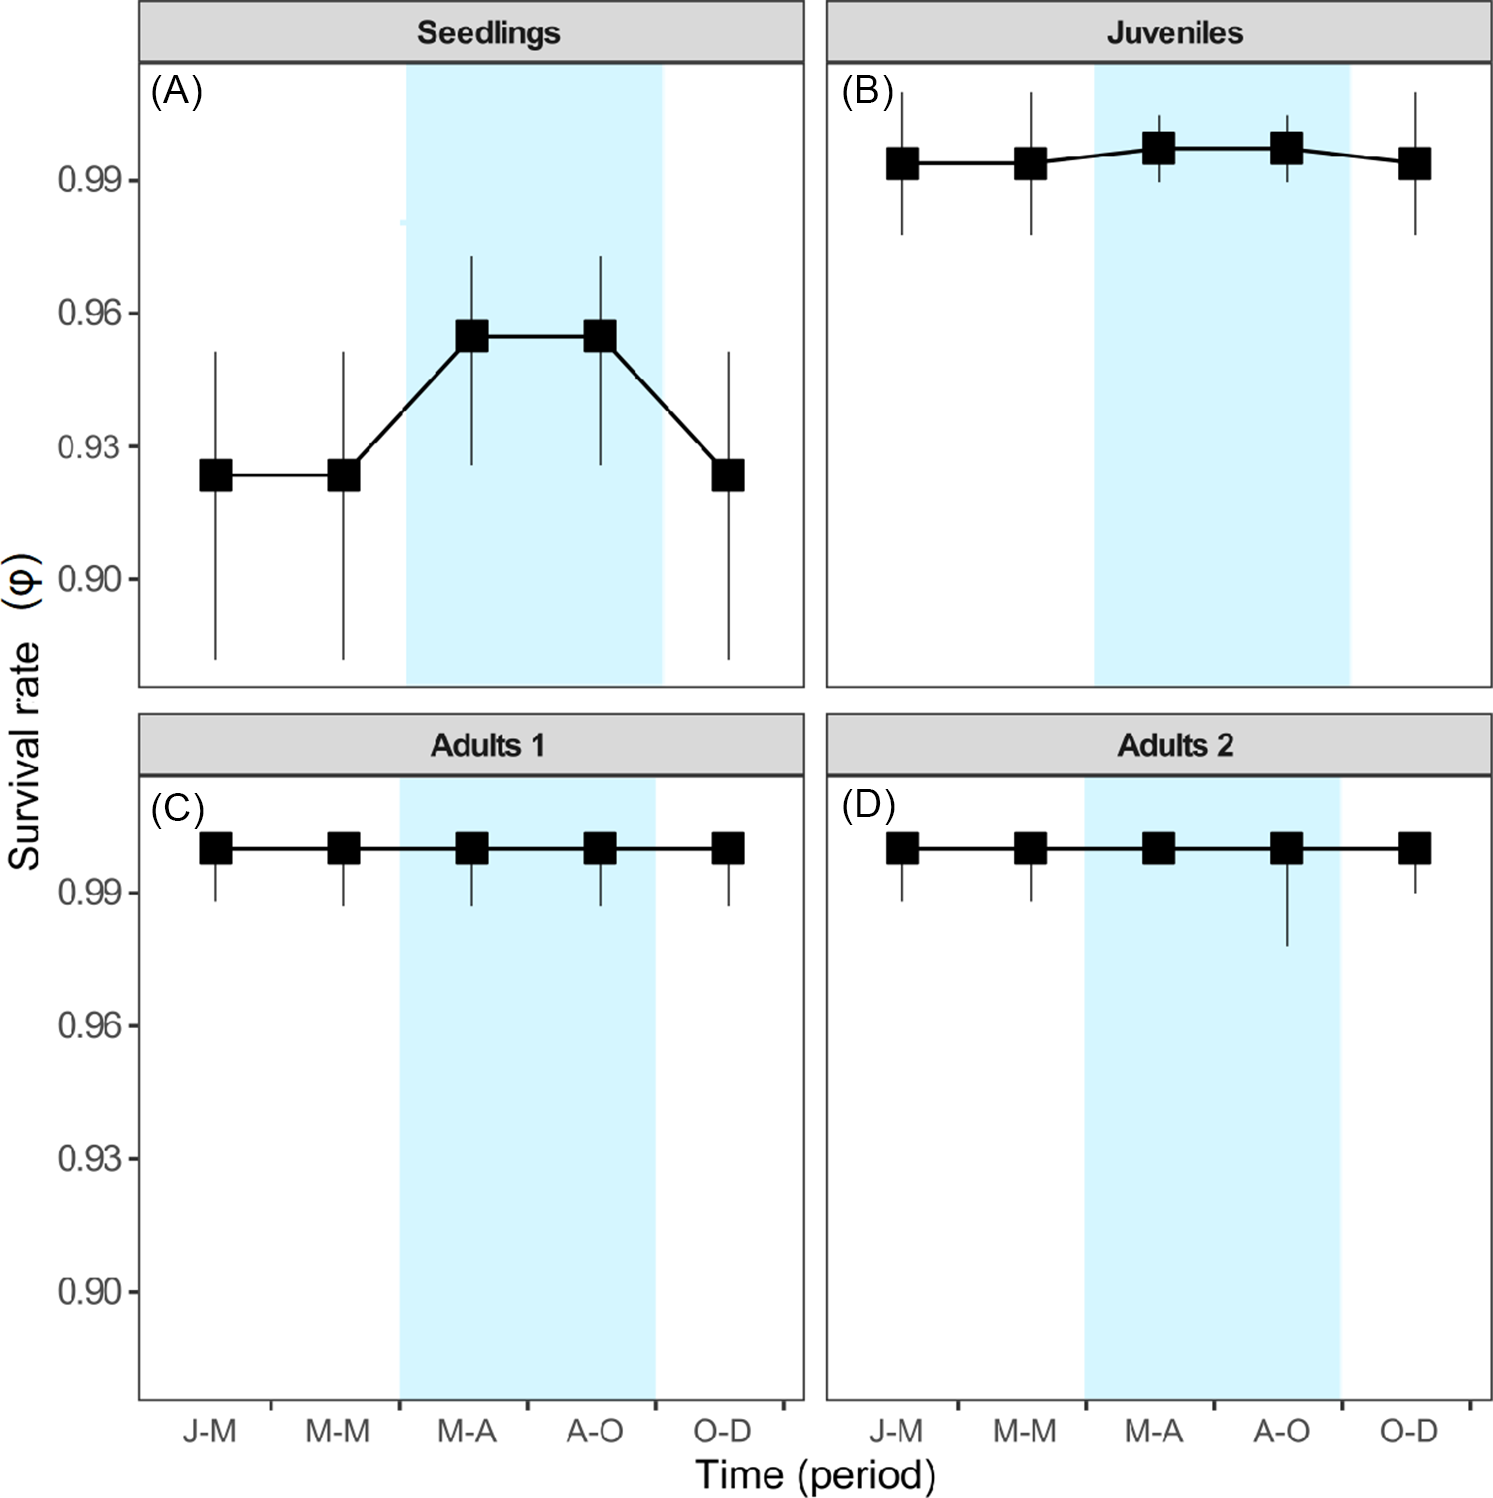
Figure 4 Model-averaged estimates of survival rates (ϕ) for (A) seedlings, (B) juveniles, (C) adults 1, and (D) adults 2. Estimates are shown per stage class. Vertical bars denote 95% confidence intervals. Blue indicates the rainy season. Periods: J-M, January to March; M-M, March to May; M-A, May to August; A-O, August to October; O-D, October to December.
Table 1. Best-fitting multistate models from a population of Sambucus nigra in an Abies religiosa forest in the Magdalena River basin, southwest of Mexico City, Mexico.

a Survival (ϕ), transition (ψ), and detection (p) rates may vary among stages (st) across sampling dates reproductive activity (r), phenological reproductive stage (ph), season (s) and may be constant among stages (.).
b The fit of each model to the observed data was evaluated using a corrected version of Akaike’s information criterion (AICc).
c ΔAICc indicates the difference in the AICc value of each model with respect to the top model.
d W i Akaike weights indicate the relative support for each model in the data.
e K indicates the number of parameters in each model.
The best-fitting multistate models (ΔAICc < 2) demonstrated that the interaction between state category (st) and season (s) affect the transition rate (ψ) of individuals of S. nigra (Table 1). Sambucus nigra showed contrasting transition/retrogression rates between early and adult stages (Figure 5), while the transition rate from juveniles to adults 1 did not differ between seasons (∼1). The rainy season likely negatively affects growth in the early stages of the life cycle of S. nigra. During the rainy season, transition rates (ψG) from seedling to juvenile stage decreased (mean ± SE: 0.07 ± 0.01; Figure 5A), and retrogression rates (ψR) increased (0.52 ± 0.04; Figure 5C). Compared with the early stages of S. nigra, during the rainy season, the transition rate (ψG) from adults 1 stage to adults 2 stage increased (mean ± SE: 0.11 ± 0.04; Figure 5B), and retrogression rates (ψR) decreased (mean ± SE: 0.08 ± 0.04; Figure 5D). In temperate forests, the increase of pests and herbivores during the rainy season considerably affected the seedlings (Hernández-Santin et al. Reference Hernández-Santin, Cuautle, de las, García-Guzmán Jl, Badano and Luna-Castellanos2019), while the adult plants could withstand these biotic stresses due to their size and greater capacity to survive (Saenz-Pedroza et al. Reference Saenz-Pedroza, Feldman, Reyes-García, Meave, Calvo-Irabien, May-Pat and Dupuy2020). Particularly for S. nigra, Pineda-Romero (Reference Pineda-Romero2016) found terpenoids in adult leaves of S. nigra that favored defense against herbivores.
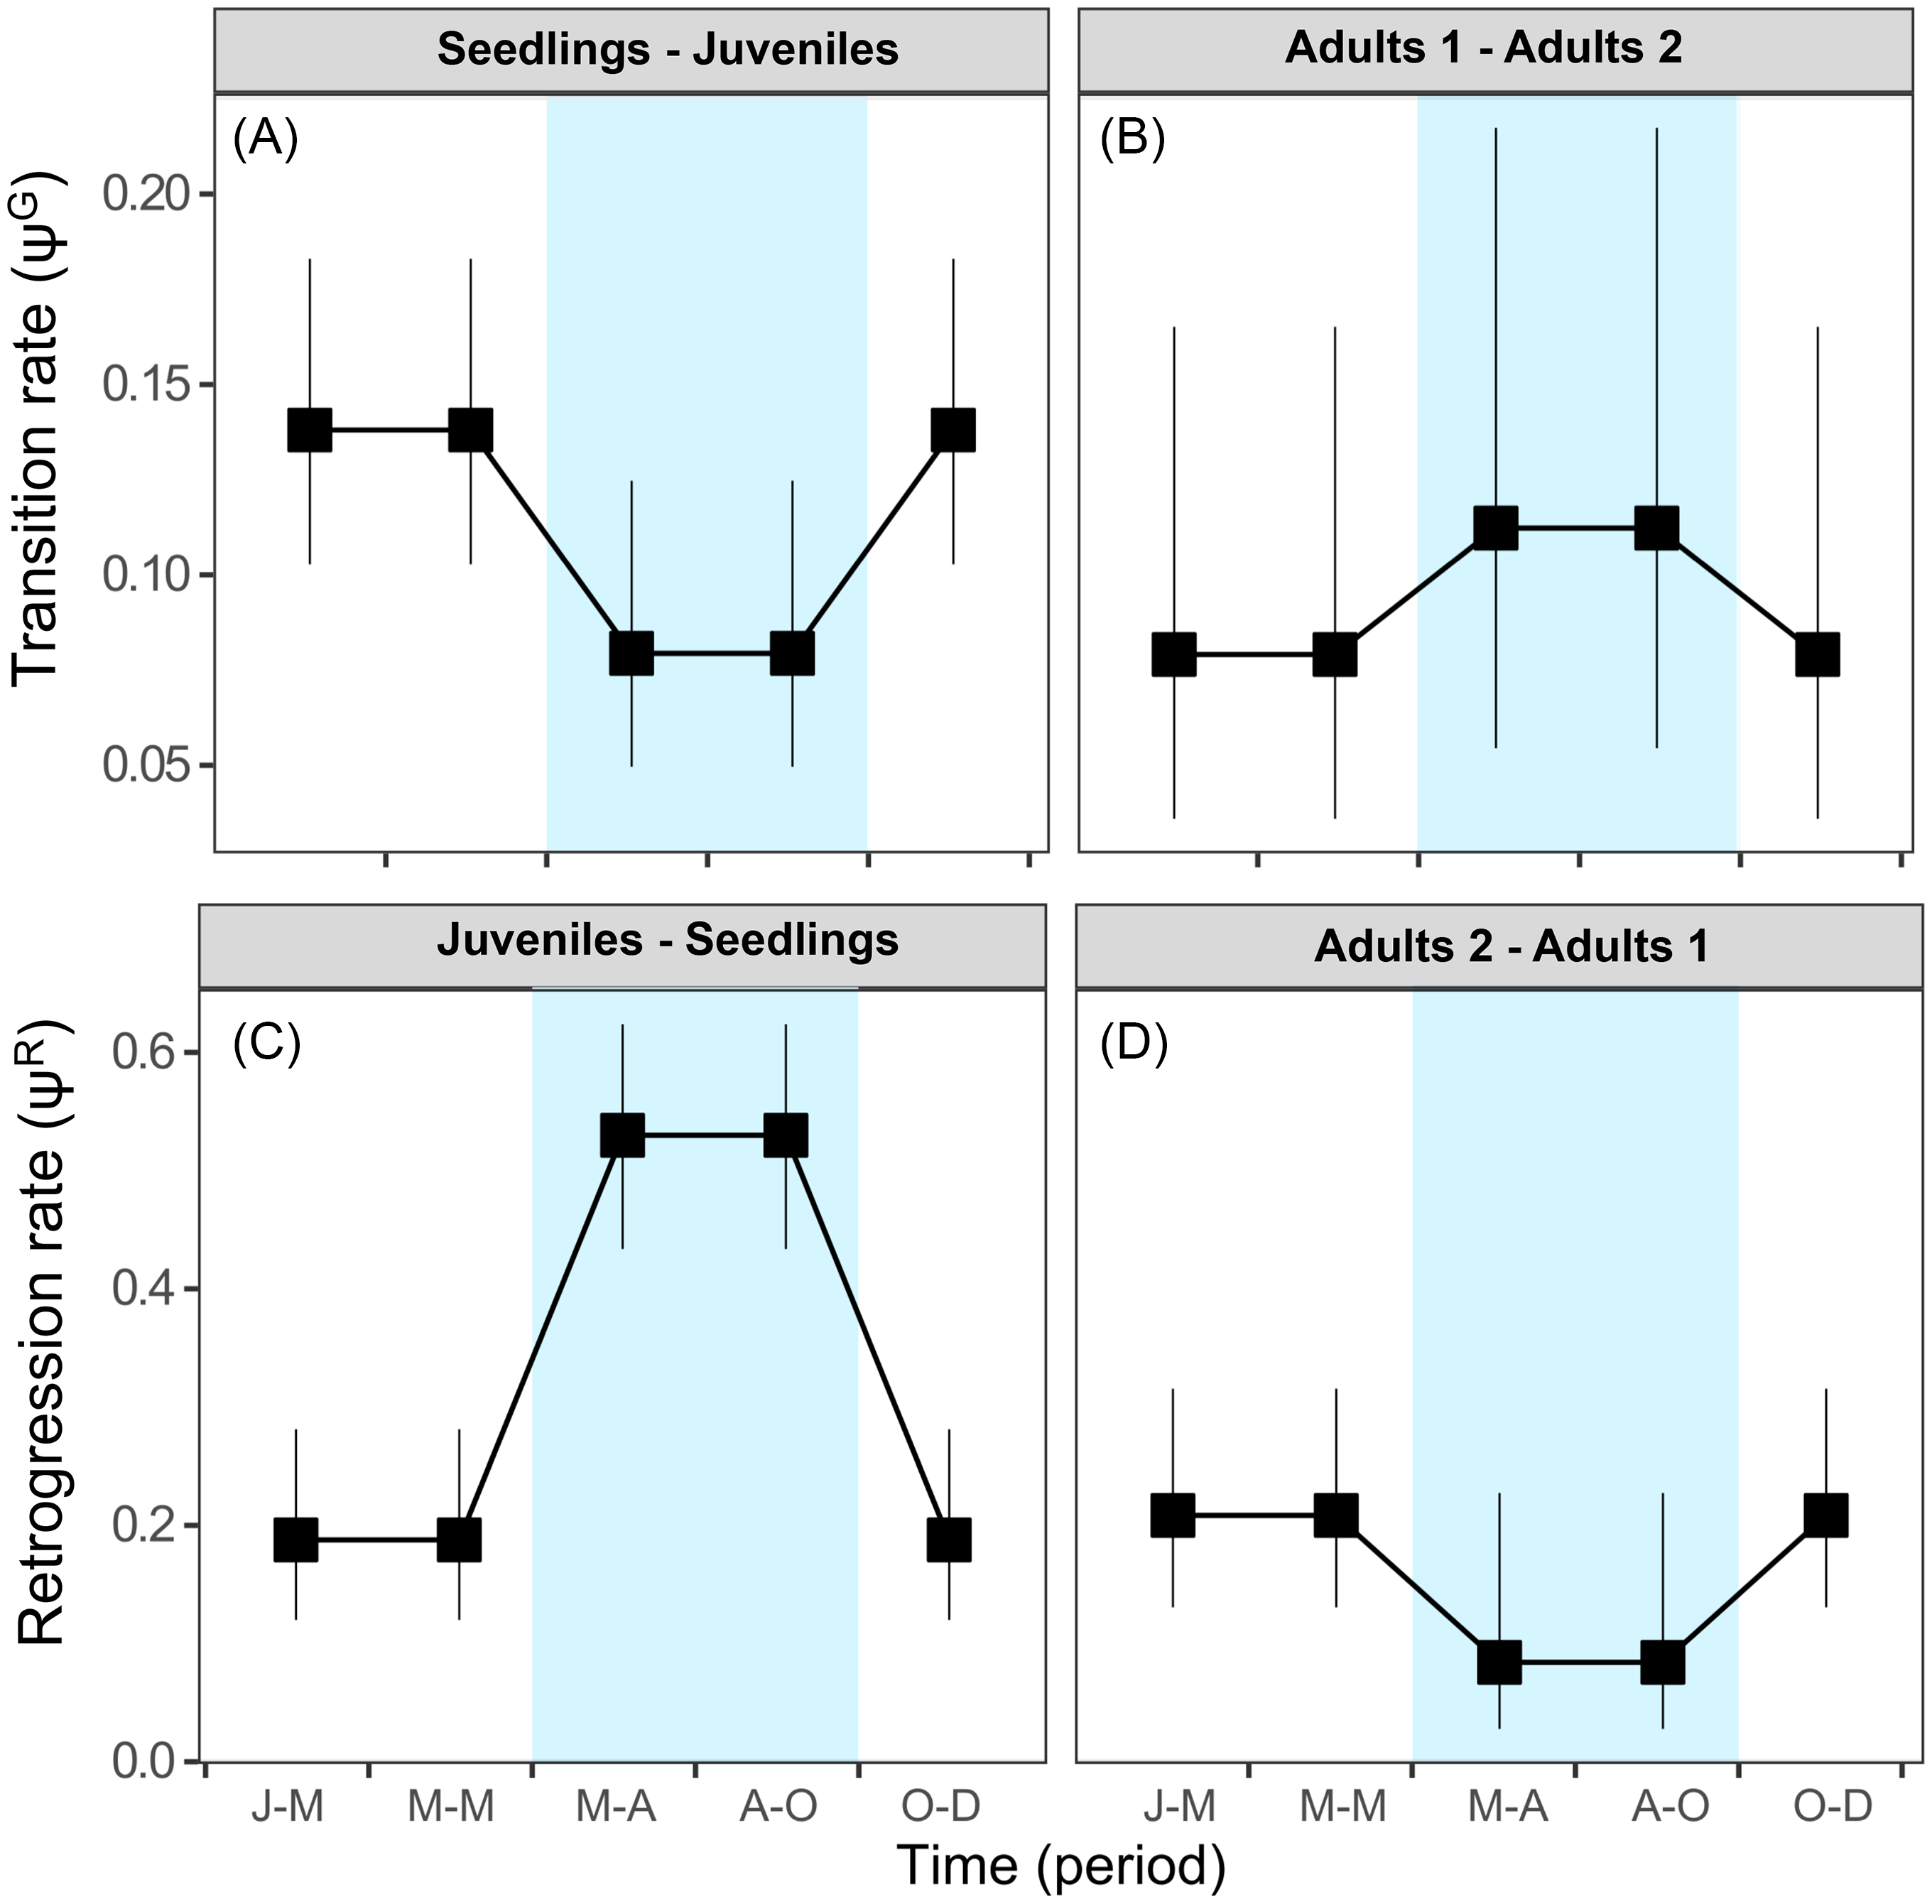
Figure 5 Model-averaged estimates of transition rates (ψG) for (A) seedlings to juveniles and (B) adults 1 to adults 2. Model-averaged estimates of retrogression rates (ψR) for (C) juveniles to seedlings and (D) adults 2 to adults 1. Estimates are shown per stage class. Vertical bars denote 95% confidence intervals. Blue indicates the rainy season. Periods: J-M, January to March; M-M, March to May; M-A, May to August; A-O, August to October; O-D, October to December.
The contrasting effect of the rainy season on the transition/retrogression rates of seedlings of S. nigra (Figure 5) is probably due to asymmetrical competition for light. It has been demonstrated that the rainy season acts as a promoter for secondary growth for adult trees and favors the increase of tree cover (Ali Reference Ali2019; Moustakas and Evans Reference Moustakas and Evans2015; Saenz-Pedroza et al. Reference Saenz-Pedroza, Feldman, Reyes-García, Meave, Calvo-Irabien, May-Pat and Dupuy2020). This reduces light availability under the canopy and negatively affects the growth of seedlings (Figure 5B and D). Sambucus nigra light dependence has been reported in other studies. The survival of seedlings increases considerably under open canopy conditions with higher light incidence, which occur in highly perturbed areas (Atkinson and Atkinson Reference Atkinson and Atkinson2002; Bonilla-Valencia et al. Reference Bonilla-Valencia, Castillo-Argüero and Martínez-Orea2017a; Van Der Maarel et al. Reference Van Der Maarel, De Cock and De Wildt1985). Therefore, the survival, transition, and retrogression rates of S. nigra are probably also explained by other factors that vary on an intra-annual scale, such as light, temperature, and biotic interactions, which were not measured.
Our results coincide with those of Baker (Reference Baker1974) and Jelbert et al. (Reference Jelbert, Stott, McDonald and Hodgson2015), who propose that invasive species simultaneously show high growth and reproduction rates. Sambucus nigra simultaneously shows high reproductive structure values and growth rates (Figures 3 and 5). However, the compensatory responses between growth and reproduction of S. nigra are probably visible in the following year (as seen in Jongejans et al. Reference Jongejans, Shea, Skarpaas, Kelly and Ellner2011). Therefore, to determine whether these trends represent a competitive advantage for S. nigra, future studies are necessary to evaluate the compensation mechanisms between growth and reproduction over the years. Likewise, it is important to mention that the demographic dynamics of S. nigra may be different in other populations. For example, in temperate forests located in the intertropical zone, environmental conditions are related to an altitude effect, and the rainy season effect is comparable to that of tropical forests (Challenger Reference Challenger, Vega, Peters and Monroy-Vilchis2003). Similarly, the effect of the rainy season may be different in populations of S. nigra located in the holarctic zone, where the rainy season is associated with the winter season (Challenger Reference Challenger, Vega, Peters and Monroy-Vilchis2003).
Similar to conditional vital rates based on population projection matrices and integral projection models (IPMs), the multistate demographic models are efficient tools for incorporating environmental covariates on survival and transition/retrogression rates of invasive species (Franco and Silvertown, Reference Franco and Silvertown2004; Jongejans et al. Reference Jongejans, Shea, Skarpaas, Kelly and Ellner2011). The main advantage of multistate models over projection matrices and IPMs is the direct estimation of stage-specific detection probabilities (p). In vegetation studies, p is not related to recapture probability, as occurs in demographic studies of animals (Caswell Reference Caswell2000; White et al. Reference White, Kendall and Barker2006). For plant species, these probabilities can be related to the sampling capacity of individuals in difficult to access sites or sites with dense vegetation. In addition, seedlings and juveniles may be so small as to pass unnoticed by field observers, and in plant species that exhibit dormancy, detection probabilities may be drastically low, because dormant stages remain belowground and are unobserved (Kéry and Gregg Reference Kéry and Gregg2004; Kéry et al. Reference Kéry, Gregg and Schaub2005; Shefferson et al. Reference Shefferson, Sandercock, Proper and Beissinger2001). Therefore, determining the probability of detection can improve the accuracy of estimates of survival and transition in invasive plant species, mainly in areas where it is impossible to observe all individuals (Moustakas and Evans Reference Moustakas and Evans2015). For example, detection rates (p) of S. nigra were less than 1 (0.866 to 0.996) for all the stage classes during our study (Supplementary Table S1). Fixing p = 1 (assuming that all living plants were observed during our field surveys), our best-supported model (the first model listed in Table 1) resulted in a large increase in the AICc value (ΔAICc = 68,786).
Additionally, applying multistate models can positively influence costs and efforts in the management plans of other invasive species. These models can evaluate demography on a short timescale (e.g., intra-annual scale). Therefore, this approach can speed up identifying critical times of year that favor certain stages of invasive species. We recommend implementing strategies focused on controlling the increase in the survival rates of seedlings, the growth rates, and the number of fruits of adults of S. nigra during the rainy season. Similar to Ramula et al. (Reference Ramula, Knight, Burns and Buckley2008), we found that invasive species with a long life cycle (e.g., shrubs and trees) require management plans focused on controlling reproduction and growth. However, in the Abies religiosa forest, it is unknown whether native species’ demographic dynamics are affected negatively due to the presence of S. nigra. Therefore, in terms of potential management strategies for S. nigra, we recommend evaluating its effects on the establishment and growth of native species (as seen in Adams et al. Reference Adams, Jennings and Warnock2020).
Supplementary Material
To view supplementary material for this article, please visit https://doi.org/10.1017/inp.2021.37
Acknowledgments
This work was supported by the Program DGAPA-PAPIIT (IN-216014), PAPIME PE201817. This paper constitutes a partial fulfillment of the Graduate Program in Biological Sciences of the Universidad Nacional Autónoma de Mexico (UNAM) and is part of the master’s degree of LB-V, who acknowledges scholarship and financial support provided by the National Council of Science and Technology (CONACyT-CVU: 631419) and UNAM. We are thankful to Professor Marco Antonio Romero-Romero for his support in the use of software. No potential conflict of interest is reported by the authors.