


1. INTRODUCTION
The globalization of the shipping industry makes it difficult to establish safety incentive programmes which would lead to the reduction of the frequency of shipping accidentsReference Wilde2. Strict inspections, detentions in port, bans and prohibitions to operate, etc. are common attempts, mainly adopted in the USA, Paris and Tokyo MoU regions, to promote the operation of safer ships3. As a result, the number of substandard vessels operating in those regions has decreased during the last two decades. Nevertheless, since these policies do not effectively reward ships or shipping companies with a lower ratio of accidents but simply encourage them to comply with international standards, the rate of maritime mishaps goes beyond control. As can be observed in Figure 1, the total number of shipping casualties varies, keeping pace with the global trade and the freight markets4.

Figure 1. Total shipping casualties and total losses 1994–2009 (vessels>500 GT). Source: www.iumi.com.
The accident rate per cargo carrying ship-year is thought to be a consequence of a homeostatic control process in which the degree of caution of those engaged in maritime transport determines the rate of accidents, and, as a consequence, this resulting rate determines the level of caution in the shipping operators' behaviourReference Wilde5. In this closed-loop process all types of accidents, near accidents and marine incidents contribute to alter the perception of risk which those involved in maritime transport have; but not all the mishaps have the same consequences for the economy, human life or the environment.
Careful observation of shipping incidents leads us to perceive other aspects apart from their mere occurrence. Historical review shows that dramatic maritime mishaps are not as frequent nowadays as they used to be in the pastReference Boisson6; in fact, if marine accident statistics are analysed today, it will be seen that the incidence of total losses of vessels is diminishing. In Figure 1 we observe that, while the tendency of the frequency of all type of casualties has been moving upwards, total losses, observed alone, have maintained a slightly downward trend during the same period. This fact indicates that some factors have been operating to reduce the severity of incidents, even though they have not altered the frequency of mishaps.
If we analyse the accidents that occurred to the ships of the world cargo carrying fleet during 2005 and 2006 and classify the mishaps using the necessary number of days under repair as the level of seriousness of each incident, we obtain the results shown in Figure 2, where we can see a known effect of the accident theory which establishes that the frequency of incidents decreases as the damages caused increaseReference Skiba7. Very serious accidents, which caused repair for more than 300 days or total losses, represent 4·6% of the total occurrences, while marine incidents, those in which ships were 10 days or less under repair, represent 61·6%. This observation is consistent with other industrial investigationsReference Heinrich8.

Figure 2. Accidents by type occurred to the ships of the world cargo carrying fleet in the period 2005–2006. Source: authors.
When we consider each accident type separately, the frequency changes. Depending on how accidents such as collisions, groundings, fires, contacts, damages to machinery, etc. evolve, they may end up in simple incidents for some ships or serious accidents for others. The risk homeostasis theory explains how human conduct alters the probability of occurrence of marine incidents; but the differences in their severity prove the existence of factors that can alter the extent of the damages caused by the behaviour of those engaged in the maritime transport.
2. MARITIME SAFETY AND POLLUTION PREVENTION STANDARDS AND THE LEVEL OF SERIOUSNESS OF ACCIDENTS
The experts of the maritime insurance industry have been expressing their concern about the increasing number of shipping casualties in recent years9. Nevertheless, only some mishaps, mainly those causing damage to human life or the environment, have been a matter of concern to the public and to sectors not interested in maritime commercial activity. This concern, external to the maritime business, perceptibly influences the implementation of accident prevention rules. It can be said that the mechanism that generates maritime safety and pollution prevention standards is not being moved by the occurrence of marine accidents but by those at certain level of severity. Therefore, such standards should not be expected to be directed to reducing the frequency of mishaps, but mainly their seriousness.
The presumption that the maritime safety and pollution prevention regulations are mainly designed to prevent the most serious accidents is, in fact, reflected in the rules related to the obligation to investigate maritime casualties. The most important conventions, associated with safety and pollution prevention, adopted by the International Maritime Organization (IMO) provide that each Administration must conduct an investigation of any casualty occurring to any of its ships subject to the provision of regulations and must supply the IMO with the findings of such an investigation10. The Organization specifically states it is more interested in those accidents classified as very serious11; as a result, accident prevention policies are designed to alleviate the consequences of this type of accident, such as the loss of human life or environmental damage, which cannot be compensated by the shipping industry.
From a theoretical point of view, risk can be defined as a combination of the likelihood of the occurrence of a hazardous event or exposure and the severity of the damage causedReference Jorgensen12. Mathematically, it is usually defined as:
Where p is the probability of occurrence of the mishap and D is the value of the damage associated to the incident. Following this theoretical approach to the concept of risk, two possible ways appear to reduce its quantity, either decreasing the severity of the damage (D) or the probability of occurrence of incidents (p). Both are in fact contained in the international maritime safety and pollution prevention regulations to reduce the amount of risk in the activity of the world cargo carrying fleet.
By going through the international standards, we can observe that many of them are aimed at reducing the probability of occurrence of accidents. Rules related to the prevention of collisions, information about ice, weather, derelicts and other perils to navigation, the existence of efficient ship-borne navigational equipment and systems, aids to navigation, automatisms, etc. are directed at reducing the probability of collisions, contacts or groundings. But the risk homeostasis theory considers that these improvements in safety will be transformed in a more efficient and riskier activity due to the behaviour of the people linked to the operation of ships, who do not find any economic motivation in being cautious. This natural impulse to optimize the efficiency of maritime transport reduces the potential benefits of safety improvements, maintaining the probability of the occurrence of shipping accidents in the level of the precedent stage.
Despite these unsuccessful actions to reduce the amount of risk by decreasing the probability of occurrence of maritime accidents, there are many other standards which are directed to reduce the severity of the damage caused by incidents. Regulations concerned with subdivision and stability of ships13 do not alter the probability of suffering collisions, contacts or groundings, but they reduce the seriousness of these events thus preventing, for example, the total loss of ships or severe pollution. The existence of effective life-saving appliances and radio communication equipments onboard and the good familiarity of the crew with such devices do not alter the probability of the ship sinking, but these standards reduce the severity of these incidents thus preventing the loss of lives. Efficient fire fighting appliances and fire resistant structures onboard do not reduce the probability of a fire, but they are useful to minimize the extent of the damage to the ship.
If we accept that the multiple combinations of the mandatory safety and pollution prevention regulations hardly ever alter the probability of maritime accidents, but that they are effective in reducing their severity, it should be expected that, during a long period of observation of maritime mishaps, statistics would reflect that substandard ships tend to suffer more serious accidents than those of high standard, although the tendency to suffer an accident in both types of ships is similar due to the homeostatic process. The objective of this work is to analyse if this tendency is satisfied.
3. ANALYSIS OF THE ASSOCIATION BETWEEN THE LEVEL OF SAFETY AND POLLUTION PREVENTION STANDARDS OF THE CARGO CARRYING SHIPS AND THE SERIOUSNESS OF THEIR ACCIDENTS
To undertake the investigation of the relationship between the standard of vessels and the severity of mishaps, we have used the same sample as in our previous paperReference Baniela and Rios14, which consists of 2,584 maritime incidents which occurred during the years 2005 and 2006 worldwide and were reported by the Lloyd's Marine Intelligence Unit (LMIU). Only cargo carrying vessels of 100 GT or above have been recorded. In order to know the level of seriousness of each incident, the number of days under repair has been recorded for each vessel with information obtained from LMIU. It is assumed that the higher the number of days is, the more serious the accident will be. In case of total loss, 365 days have been recorded to facilitate calculations. The accidents have been put into four groups taking into consideration their severity, as shown in Figure 2.
The evaluation of the level of safety and pollution prevention standard of the vessels involved in the accidents has been carried out following the criteria used by the Paris MoU to identify substandard shipping. Thus, the flag, the classification society, the age, the tonnage and the type of every ship involved have been recorded. According to the Paris MoU Secretariat information, it is assumed that the profile of the vessel of lowest safety and pollution prevention standard is that of a small-sized, old general cargo or reefer ship, flying the flag of a country included in the black list and either classified by a very low performance society or with unknown class. Conversely, the highest standard ship is a big-sized, new and specialised vessel, flying a white list flag and classified by a very high performance society.
Statistical analyses have been made with an appropriate computer program. Many outputs, not essential to this investigation, have been omitted to reduce the extent of this paper15.
3.1. Association between the flag of vessels and the seriousness of accidents
Following the information contained in the Paris MoU 2005 and 2006 annual reports, all the ships involved in incidents during this period have been classified into four groups according to the list of the flag they were flying at the time of the incident. The black list has been subdivided into two groups: one for those countries included in the very high risk group and the other for those in the high and medium risk one.
In Figure 3, the frequencies per type of accident for each flag group are shown. It can be observed that there are perceptible differences among the flag groups. The more substandard the flag list is, the smaller the difference of frequencies among accident types will be. This observation leads us to assume that there is an association between the level of safety and pollution prevention standard of the ships measured by the performance of their flag and the level of severity of the incidents they are involved in. To measure this relationship, we have made a table of contingency where the frequency of accidents per cell is shown. The result is shown in Table 1, which allows us to see the differences among cells at a glance. The statistical significance of these differences can be tested with the Pearson's chi-square test. If the proportion of ships in the different columns varies between rows (and, therefore, vice versa) the table shows association between the two variables. If there is no contingency, the two variables are independent. In this case, a chi-square value of 156·972 with an associated significance of less than 0·01 indicates that there is a relationship between the flag of ships and the seriousness of the accidents they are involved inReference Bulmer16.

Figure 3. Bar chart with the number of incidents by type and Paris MoU flag list of the cargo carrying vessels involved in incidents during 2005 and 2006. Source: authors.
Table 1. Contingency table showing the distribution of maritime accidents occurred during 2005 and 2006 per type of accident and Paris MoU flag group. Source: authors.

To investigate this relationship, we use techniques of correspondence analysis Reference Benzécri17. This method is traditionally applied to contingency tables and breaks up the chi-square statistic associated to this table into orthogonal factors. The summary in Table 2 shows a relationship between the row and column variables, and the number of dimensions needed to display this relationship. The singular values are measures of association by dimension between the row and column variables, with larger values indicating stronger relationships. The squares of the singular values equal the inertias, which are capable of being added over dimensions. Here, the first two dimensions have 97·9% of the inertia in the solution, so the third dimension is unnecessary. The graphical representations obtained with these statistical techniques have an easy interpretation: the shorter the distance (measured in chi-squared values) between points, the higher their relationship.
Table 2. Summary of statistics and inertias of the correspondence analysis between the type of accident and the Paris MoU flag group. Source: authors.

The bi-plot representation of Figure 4 shows that ships registered in countries included in the white list by the Paris MoU tend to be involved in marine incidents and less serious accidents. Vessels flagged in grey list countries tend to suffer serious accidents and those in the black list (high and medium risk) are associated to serious and very serious accidents. Finally, ships registered in countries included in the black list (very high risk) tend to be clearly involved in very serious casualties.

Figure 4. Bi-plot of the correspondence analysis between the type of accident and the Paris MoU flag group of the ships involved. Source: authors.
3.2. The Classification Society (CS) of cargo carrying vessels and the severity of their accidents
In this analysis, the level of safety and pollution prevention standard of the ships involved in an accident will be evaluated according to the performance of the society classifying the vessel. The degree of performance of societies when acting as Recognized Organizations18 is assigned by the Paris MoU Secretariat. Following this information, the Classification Societies of the investigated ships have been included in four groups as shown in Table 3. The information about the Classification Society of the vessels at the time of the incident was taken from Lloyd's Register Fairplay and when no information appears, unknown class is reported.
Table 3. Grouping of the Classification Societies of the investigated ships according to their level of performance in the Paris MoU region. Source: Paris MoU.

By measuring the level of seriousness of accidents by the number of needed days under repair and by grouping the ships involved in an accident by the level of performance of their Classification Society, we obtain the average days shown in Figure 5. It can be observed that ships classified by low performance organizations or with unknown class have an average of 90 days under repair. On the contrary, ships classified by very high and high performance societies have a significantly lower average (24 and 30 days respectively) than others. The differences observed in the average (severity of accidents) depending on the level of performance of the Classification Societies lead us to assume that there is an association between both variables. In order to know if such differences are statistically significant, we have used the non-parametric Kruskal-Wallis method for testing equality of population medians among groups, without making any assumption about the distributionReference Lecoutre19. The mean ranks obtained are shown in Table 4, where we can appreciate that the values of the groups of ships classified by high and very high performance societies are very close. Nevertheless, the mean ranks in the group of ships classified by medium and low performance societies and ships with unknown class differ widely from the other groups. The chi-square value obtained is 39·311 with an associated p-value below 0·01. The output is shown in Table 5.

Figure 5. Average days under repair for the cargo carrying vessels that suffered any type of incident during 2005 and 2006 and grouped by their Classification Society performance in the Paris MoU region. Source: authors.
Table 4. Output of the Kruskal-Wallis test showing the N and mean rank values. Source: authors.

Table 5. Output showing the chi-square statistic and the significance. Source: authors.

Significant levels below 0·01 indicate that the group locations differ. This means that ships classified by societies with high and very high performance in the Paris MoU region tend to be involved in less serious accidents than those classified by low performance ones or with unknown Classification Societies. To get a more detailed examination of their relationship, we use categorical values for both variables obtaining the correspondence table of Table 6, where we can see the number of vessels classified by type of accident and class society performance.
Table 6. Contingency table and summary statistics for the correspondence analysis of the relationship between the classification societies of the ships involved in accidents during 2005 and 2006 and the type of accident. Source: authors.

In Table 6, we have also displayed the output with the chi-squared and its significant value, which confirms the association between variables. The inertias obtained show that a two-dimension graph is suitable. The results obtained, seen in Figure 6, show that ships classified by societies of high and very high performance are closely associated to marine incidents and less serious accidents. Vessels classified in medium performance societies tend to be involved in serious accidents and ships classified by societies with low performance or with unknown class are associated either with serious or very serious incidents. It can be observed that the higher the performance of the society is, the less serious the accidents of the ships classified are.

Figure 6. Two-dimension graph showing the association between the Classification Society performance in the Paris MoU region and the type of accident of the vessels involved in incidents during 2005 and 2006. Source: authors.
3.3. The age of cargo carrying vessels and the severity of their accidents
With the aim of investigating if there is any kind of relationship between the age of ships and the seriousness of the accidents they are involved in, we have divided the cargo carrying vessels that suffered accidents during 2005 and 2006 into four groups according to their age at the time of the incident. As previously, the incidents were divided into four groups according to their severity measured by the number of days under repair. The result of this classification is shown in the cross-tabulation of Table 7, where the columns represent the variable type of accident and the rows the variable age.
Table 7. Table showing the frequency of accidents occurred to the ships of the world cargo carrying fleet during 2005 and 2006 classified by type of accident and age of vessels. Source: authors.

The differences of values in the cells of the above table can be better appreciated in the bar chart of Figure 7, where it can be observed that the number of very serious casualties increases as the age of ships is greater. Taking this type of accident as a percentage of the total accidents that occurred in the group, the differences are more significant. This observation leads us to the intuitive idea that the newer the ships are, the more trifling are the accidents they are involved in.
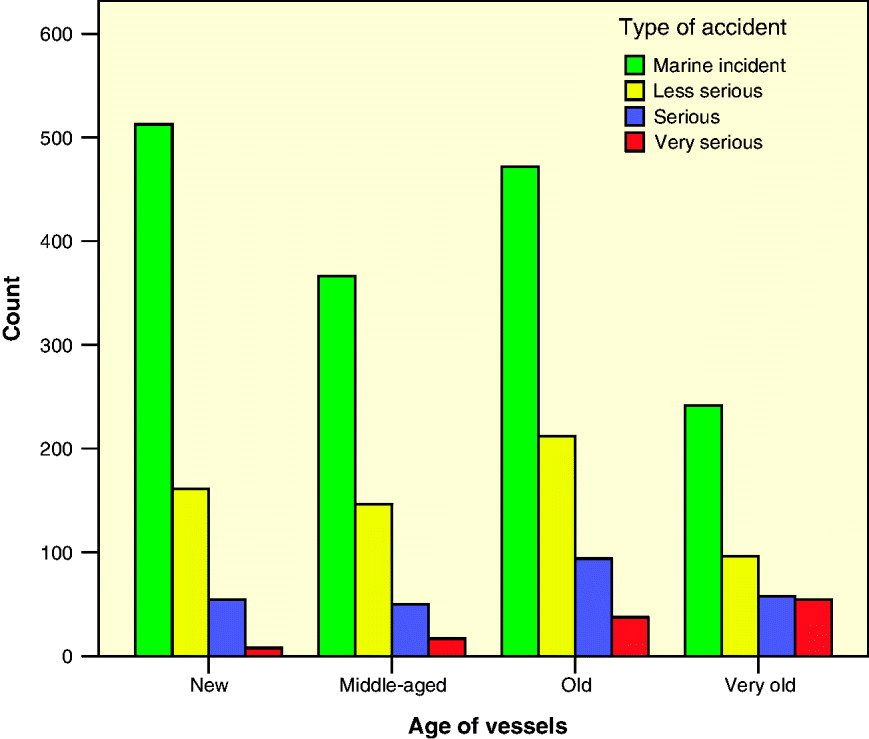
Figure 7. Bar chart with the number of incidents by type and age of the cross-tabulation of Table 7. Source: authors.
To know if the differences observed above are statistically significant we have made, as before, a chi-square test using the data of Table 7. With this statistic, the hypothesis that the row and column variables in a cross-tabulation are independent can be tested. The output of this method is shown in Table 8.
Table 8. Output with the statistical values and their significance. Source: authors.

The low significant values observed by the Pearson Chi-Square and the Likelihood Ratio (below 0·01) indicate that there is a perceptible relationship between the two variables although we do not know the strength or direction of the relationship. To study these matters in depth, we use the correspondence analysis obtaining the inertias shown in the output of Table 9. The value of the cumulative proportion of inertia for two dimensions is 99·7%, which means that a bi-plot representation is adequate. This is shown in Figure 8, where new vessels are closely associated to marine incidents. Middle-aged ships tend to be involved in less serious accidents and marine incidents and old vessels tend to suffer less serious and serious accidents. Ships of more than 30 years old tend to be involved in a higher percentage of very serious casualties. The relationship between the age of ships and the level of seriousness of accidents is statistically significant and direct, which means that the older the vessel is, the more serious the accident will be.

Figure 8. Bi-plot of the correspondence analysis between the type of accidents and the age of the ships involved. Source: authors.
Table 9. Output with the statistics and inertias of the correspondence analysis of data in Table 7. Source: authors.

3.4. The size of cargo carrying vessels and the severity of their accidents
In order to analyse the relationship between the size of ships and the seriousness of the accidents they are involved in, we have classified the vessels in four groups taking into account their size measured by the tonnage GT and the severity of the accident as we have done before. The result of the classification of ships that suffered incidents during 2005 and 2006 is shown in Table 10. If we represent the values of the cells of the contingency table in a bar chart, we obtain Figure 9, where we can observe that the bigger the ship is, the smaller the differences among the type of accidents are.

Figure 9. Percentage of accidents of vessels that suffered incidents during 2005 and 2006 classified by size and type of accident. Source: authors.
Table 10. Vessels that suffered incidents during 2005 and 2006 classified by size and type of accident. Source: authors.

The differences observed in Figure 9 suggest a relationship between the type of accident and the size of vessel variables. To know if this is statistically significant, we obtain the values of the Pearson Chi-Square and also the Likelihood Ratio for the distribution of the accidents shown in the cross-tabulation of Table 10. These values can be seen in the output of Table 11. The p-values associated to the obtained Pearson Chi-Square and Likelihood Ratio statistics are less than 0·01. So we can conclude that there is an association between the size of vessels and the seriousness of the accidents they are involved in. We use the correspondence analysis, as we have done before with the age of ships to understand the strength and direction of this relationship better. The inertias obtained are shown in Table 12. With two dimensions we have 97·8% of the cumulative proportion of inertia. Therefore, the bi-plot representation shown in Figure 10 is adequate.

Figure 10. Bi-plot of the correspondence analysis between the type of accidents and the size of the ships involved. Source: authors.
Table 11. Output showing the statistics obtained for the distribution of the accidents shown in Table 9. Source: authors.

Table 12. Output showing the inertias of the correspondence analysis of the contingency table in Table 10. Source: authors.

We can observe that bigger ships are associated with less serious accidents. Conversely, small vessels are clearly associated with very serious casualties. The relationship between the size of ships and the severity of the accidents in which they are involved is inverse: the bigger the ships are, the less serious the accidents will be.
3.5. The type of cargo carrying vessels and the severity of their accidents
According to the Paris MoU information, and due to the circumstances of the shipping market, the less specialised vessels operating in the region (general cargo and refrigerated cargo vessels) have a safety and pollution prevention standard level lower than those types included in the specialised fleet (tankers, bulk carriers, containers, passenger ships, etc.). Assuming the significant differences in the grade of the standards in the above mentioned groups, we have classified the vessels of the cargo carrying fleet by type in two groups. To investigate if the low standard types tend to be involved in more serious incidents than the high standard ones, we will use the number of days under repair as an indication of the level of severity of the accidents. The statistics obtained for both groups of vessels are shown in Table 13, which displays the number of cases, mean value, standard deviation and standard error for the test variable days under repair within categories defined by the grouping variable type of ship. We can observe that the average number of days under repair obtained for non-specialised ships is 53·88, while the average for specialised types is 29·09. This difference is shown in Figure 11.

Figure 11. Average days under repair for specialised and non-specialised vessels of the world cargo carrying fleet that suffered accidents during 2005 and 2006. Source: authors.
Table 13. Output with the statistics of the days under repair for specialised and non-specialised vessels of the world cargo carrying fleet that suffered accidents during 2005 and 2006. Source: authors.

The values of the means of the two groups suggest that such a big difference cannot happen by chance and to know if this is statistically significant, we use the parametric independent samples t test procedure Reference Sheskin20 to compare the two group means displayed in the group statistics table in Table 13. The output of this test is shown in Table 14.
Table 14. Output of the independent two sample t-test procedure of the days under repair for specialised and non-specialised vessels of the world cargo carrying fleet that suffered accidents during 2005 and 2006. Source: authors.

The value for the Levene test (less than 0·01) indicates that we must use the results that do not assume equal variances for both groups of ships. The low value for the t test (less than 0·01) indicates that there is a significant difference between the two group means. The 99% confidence interval for the mean does not contain zero; this also indicates that the difference is significant. To confirm this result, we have used the non-parametric alternative to the t test: the Mann-Whitney U method. Table 15 lists summary statistics. In this test, the two groups are combined and the data are ranked. Mean rank lists the average of ranks for each group. If the groups have the same location, these values should be similar. To test whether the locations differ, the Mann-Whitney U Test or the Wilcoxon W Test are used and the results, which are shown in Table 16, yield identical conclusions. Small significant values (in this case, less than 0·01) indicate that the two groups have different locations.
Table 15. Output of the statistics for the Mann-Whitney U test of the days under repair for specialised and non-specialised vessels of the world cargo carrying fleet that suffered accidents during 2005 and 2006. Source: authors.

Table 16. Output of the Mann-Whitney U and Wilkinson W tests of the days under repair for specialised and non-specialised vessels of the world cargo carrying fleet that suffered accidents during 2005 and 2006. Source: authors.

The results obtained with either the parametric or the non-parametric tests lead us to the same conclusion: the type of vessels pointed by the Paris MoU with a high level of safety and pollution prevention standard tends to be involved in less serious accidents than those of low standard (reefers and general cargo ships). This result is concordant with other investigations21.
4. ANALYSIS OF THE COMBINED EFFECTS OF THE FIVE VARIABLES
In Section 3 we have investigated the relationship between the variables used by the Paris MoU to identify the level of safety and pollution prevention standard of the ships of the world cargo carrying fleet and the level of seriousness of the accidents they are involved in. These variables (flag, classification society, age, size and type of ship) studied individually have shown a significant association with the level of severity of accidents, pointing out that the lower the standard of vessels is, the more serious the accidents are.
In order to know how the variables work together, we have analysed their combined effect. For this purpose, we give ordinal values to each of them taking into account the direction of the level of safety and pollution prevention standard established in the Section 3 subparagraphs, as it is shown in Table 17.
Table 17. Ordinal values assigned to the variables. Source: authors.

If we assign the values to each variable for every cargo carrying ship which was involved in an incident during 2005 and 2006 and we add the five values, we obtain an arbitrary scale with a score that goes from 5 to 18 for every vessel. This represents the safety and pollution prevention standard level. It is assumed that increasing numbers on the scale represent the increasing belief that the vessel belongs to the substandard category and therefore the strength of conviction that it will be involved in a serious accident; decreasing numbers indicate the contrary. Thus, the higher the score of the ship, the greater the likelihood of a serious accident. Considering a particular level of seriousness of the accidents measured by the number of days under repair, we establish a binary classification, in which the number of days under or above an agreed value labels the accident as not serious or serious respectively.
With the scores of the vessels and their binary classification, ROC curves are obtained and used to know how well the arbitrary level of the safety standard assigned to each vessel predicts the actual type of accident occurred22. In this type of graph, the area under the diagonal is 0·5 and if the curve obtained is close to this diagonal line, it means that serious or not serious accidents are randomly happening despite the score of the vessels involved. The further the curve lies above the reference line, the more efficient the prediction will beReference Egan23. When the value of the area under the curve is close to 1, this means that near 100% of the substandard (high score) ships were involved in serious accidents and also that near 100% of the high standard (low score) ones in not serious incidents. In this analysis, the value of the area under the ROC curves is used to give us an idea of the accuracy of the level of safety and pollution prevention standard of ships (measured by the Paris MoU) to predict a particular degree of severity of an accident.
In Figure 12 we have obtained the graphs for four different levels of seriousness of accidents. In the first ROC curve, we have classified the accidents in two groups (not serious if the ship was 10 days or less under repair and serious if the repair took more than 10 days). The number of ships involved in serious incidents was 991 and in not serious 1,593. The area under the curve obtained is 0·588, which is close to the diagonal (0·5). This means that accidents with this level of severity are randomly happening to standard and substandard vessels. We can say that the mere occurrence of incidents, without taking into account their severity, is happening to the ships by chance despite their safety standard level.

Figure 12. ROC curves with the value of the area under the curve of the cargo carrying vessels involved in incidents during 2005 and 2006 for four types of accidents in a binary classification according to the number of days under repair. Source: authors.
When we increase the level of seriousness of incidents in a binary classification, the areas under the ROC curves increase, showing that a higher percentage of substandard ships is involved in serious accidents and a higher percentage of standard ones is involved in not serious incidents. If we agree that the level of severity of incidents in “total losses and accidents where the vessel involved was 300 days or more under repair”, the last graph in Figure 12 shows an area under the ROC curve of 0·812, which is usually considered a significant value. This indicates that the safety and pollution prevention standard level assigned to the vessels, according to the Paris MoU criteria, is useful to identify the profile of the ship prone to be involved in this type of casualty, even though a certain level of uncertainty remains in the result.
Considering the level of seriousness in “more than 300 days under repair and total losses”, we want to know the effect of each variable separately. For this purpose, we obtain the ROC curves of Figure 13, where we observe that, taking into account the areas under the curves, the classification society and the age of the vessels are the most influential variables in the case of very serious casualties, followed by the size, the flag and the type of ship.

Figure 13. ROC graph with the value of the area under the curves for each variable of the cargo carrying vessels involved in very serious accidents during 2005 and 2006 (lost or with 300 days or more under repair). Source: authors.
The most appropriate way to investigate the contribution of each variable to explain this level of severity of accidents is using logistic regression modelsReference Kleinbaum24. If we consider the type of accident a categorical response variable with two outcomes, as we have done with the ROC analysis, we can use the binary logistic regression procedure to determine whether the incident is more likely to be “not serious” (300 days under repair or less) or “serious” (total loss or >300 days under repair). With this analysis, we want to identify the variables which are indicative of ships prone to being involved in a serious accident. We use the predictor categorical variables: the flag, the class, the age, the size and the type of every ship with assigned values according to Table 17. Then, we made a model to predict the probability of a given vessel being involved in a serious accident (total loss or an incident of more than 300 days under repair). If we call z the measure of the total contribution of every predictor variables, the model can be defined as follows:
Where β0, is the intercept and β1, β2, β3, β4, β5 are the regression coefficients of the variables. The value of each coefficient is the size of contribution of their explanatory variable. This model may describe the relationship between the above mentioned variables and a binary response variable (type of accident), expressed as a probability that has only two possible values: “serious” or “not serious”25.
The output of Table 18 shows the coefficients and associated statistics of the model obtained with the computer when we introduce the 2,584 incidents labelled as “serious” or “not serious”. These coefficients are estimated through an iterative maximum likelihood method. As can be seen, in the first step the five variables are in the model. Taking into consideration the significance of the Wald statistic, in the second step the variable Size was removed, and in the third step, the variable Flag was removed. The elimination of these two variables from the logit model does not mean that they have no influence on the type of accidents, but that their effect disappears due to the interaction with the other variables. The actions of the Flag and the Size, analysed alone, have shown a significant relationship with the severity of the shipping accidents26 in the last paragraphs.
Table 18. Output of SPSS showing estimated coefficients and associated statistics of the logistic regression model to explain accidents (more than 300 days under repair and total losses) occurring to cargo carrying vessels during 2005 and 2006. Source: authors.

The result obtained with the logistic regression analysis shows that the tendency of a ship to be involved in a very serious accident is explained by the classification society of the vessel, its age and type. The disappearance of the variable Flag seems to reflect what is happening nowadays in the maritime industry, where most of the maritime Administrations entrust the inspection and survey of vessels to classification societies of their confidence; this practice links the Flag and the Class. The removal of the variable Size from the model can also be explained by, on the one hand, the fact that the bigger the ship, the stronger the pressure of the insurance industry to have the vessel classified in a reliable society and, on the other hand, the tendency of bigger ships to be specialised type vessels; both facts link the variable Size to the variables Class and Type. The situation of the shipping business makes the role of Class, Age and Type more relevant in the logit model due to the interaction with the other variables.
5. CONCLUSIONS
The empirical results obtained in this work lead us to conclude that there is a significant relationship between the safety standards and the severity of shipping accidents. This association shows the tendency of substandard vessels to suffer more serious accidents than others. The uncertainty, caused by the fact that some very high standard ships suffer very serious casualties whereas some substandard vessels operate without being affected by a major accident, does not contradict that previously mentioned relationship, but it shows that the capacity of standards to prevent the risks introduced by technological innovations in the maritime transport is slowed by the economic rationale which, traditionally, imposes the adoption of prevention measures after maritime accidents occur, not before.
Analyses show that the higher the severity of the accidents is, the more accurate the safety standards to predict them will be. This efficiency diminishes until it disappears in less serious incidents. As a consequence such standards are ineffective to prevent the occurrence of incidents, but efficient to mitigate their seriousness. The propensity of a cargo carrying vessel to develop an incident into a more serious accident can be explained by the degree of reliability of its classification society, its age and type.
For these analyses, the measure of the standard of ships was obtained with the variables elaborated by the Paris MoU to identify substandard vessels. These factors are based on the observation of the degree of compliance of vessels with international safety and pollution prevention regulations. Thus, following the philosophy of the ISO 9000 series and the International Safety Management Code27 and the results of this paper, it can be assumed that, in a particular cargo carrying vessel, each level of deviations from those regulations and procedures has an associated probability of getting involved in a serious casualty after an incident occurs.
It is assumed that due to the homeostatic process, shipping accidents are randomly happening to ships of the world cargo carrying fleet, but the significant relationship between the level of the safety standard of vessels and the degree of seriousness of the incidents they are involved in lead us to accept an accident causation theory, in which maritime incidents start in a particular ship by chance and this initial event develops into a final stage, where the lower the standard of the ship is, the greater the extent of the damage will be. This sequence follows an accident deviation model Reference Kjellen28.


