


Deaths from noncommunicable diseases are projected to rise to 52 million by 2030 (1), and it is estimated that 80 percent of these will occur in low and middle income countries (LMIC) (2). Access to appropriate technologies is crucial to reverse this trend, but unfortunately access to health technology is usually inversely related to health need worldwide. Affordability continues to be one of the biggest obstacles for poor people and poor countries to gain access to health technology (Reference Howitt, Darzi and Yang3).
Millennium development goal 8E advocates better cooperation with pharmaceutical companies to improve access to affordable drugs in LMIC (4). Among other measures, differential pricing (DP) based on purchasing power parity has been recommended by the World Health Organization (WHO) and other institutions as a possible mechanism to secure more affordably priced medicines (5). DP has been applied to vaccines, as well as to HIV drugs and contraceptive products. However, in the case of innovative drugs, pharmaceutical companies continue to apply global pricing policies, setting similar prices for all countries or even higher prices in lower-income countries (Reference Morel, McGuire and Mossialos6;Reference Gelders, Ewen, Noguchi and Laing7). In Latin America (LA), many innovative drugs have higher prices than in high-income countries (Reference Tobar and Charreau8). This is frequently the case with new cancer drugs, meaning that high prices not only restrict patients’ access to treatment, but also impose an economic burden on patients and their families creating a high risk of catastrophic expenditure and impoverishment. Globally, the proportion of the price paid by patients out-of-pocket for pharmaceuticals is inversely related to the country's gross domestic products (GDP) (9).
In this study, we analyze the case of trastuzumab and the possible impact of global pricing policies on patient access. Breast cancer is the most prevalent form of malignant disease among women, with an estimated global incidence of 1.05 million new cases every year (Reference Parkin, Bray, Ferlay and Pisani10). In LA, it is estimated that more than 100,000 women will be diagnosed with breast cancer every year (Reference Lozano-Ascencio, Gomez-Dantes, Lewis, Torres-Sanchez and Lopez-Carrillo11). Approximately 10–30 percent of breast cancers over-express the human epidermal growth factor receptor 2 (HER2/ErbB2), which is associated with clinically aggressive disease and a poor prognosis (Reference Plosker and Keam12). Trastuzumab (Herceptin®) is a humanized monoclonal antibody used in the treatment of breast cancer that over-expresses HER2. Its addition to first-line chemotherapy has shown to improve time to disease progression and overall survival in randomized, multicenter trials (Reference Liao, Zhang, Li, Yao and Wang13).
Several economic evaluations performed in high-income countries have shown that trastuzumab is a cost-effective intervention according to local decision-making thresholds (Reference Chan, Leung, Lu and Lin14–Reference Hall, Hulme and McCabe24). Although not without controversy due to its high cost, it has become the standard of care for adjuvant therapy in patients with HER2-positive early-stage breast cancer in high-income countries. Trastuzumab has been available in LA since 2000 but its inclusion and financing by countries’ healthcare systems is heterogeneous. The concept of value-based pricing to inform price negotiations for the particular context and patient group has been applied in some high-income countries (Reference Sullivan, Peppercorn and Sikora25). As economic considerations to prioritize resource allocation decisions are increasingly being accepted in the LA region (Reference Banta26;Reference Pichon-Riviere, Augustovski and Rubinstein27), cost-effectiveness information could be valuable in deciding on the incorporation of trastuzumab to health benefit packages or in informing price negotiations.
OBJECTIVES
The objective of this study was to evaluate the potential implications that current pricing policies of trastuzumab might have in terms of cost-effectiveness, coverage, and accessibility for patients with early HER2-positive breast cancer in seven LA countries: Argentina, Bolivia, Brazil, Colombia, Chile, Peru, and Uruguay.
METHODS
The present study was part of a larger project, funded by the Global Health Research Initiative (Reference Di Ruggiero, Zarowsky and Frank28). The project involved the creation of a research network of LA investigators and policy makers to select a health technology relevant to participating countries’ health policies, perform a multicountry economic evaluation and promote the use of the generated evidence in policy making. Trastuzumab was selected, among a list of candidate technologies proposed by the participating countries, after conducting a prioritization process that involved scoring the candidate technologies according to ten predefined attributes (e.g., the disease burden for which the technology was proposed, inappropriate variation in practice, equity aspects related to access and availability). Once selected, the model structure, required parameters, and a common methodology for identifying costs and resource use were developed by consensus among the country research teams in two face to face meetings that included clinical experts, health economists, epidemiologists, and decision makers. A literature review of existing health economic evaluations of trastuzumab was conducted to inform this process.
A Markov model was programmed in a Microsoft Excel platform using a lifetime horizon with yearly cycles. Similar to other published models (Reference Skedgel, Rayson and Younis15–Reference Liberato, Marchetti and Barosi17), the analytical structure contains five different states: “Remission” (R), “Loco-regional recurrence” (LR) including contra-lateral breast cancer, “Distant recurrence” (DR) including metastasis, “Breast cancer death” and “Death due to other causes” (see Fig. 1). Patients in the LR state may return to remission after a successful treatment. Breast cancer deaths can occur only in patients in the DR state. The effect of trastuzumab was modeled by changing the transition probabilities from R and LR to DR, and it was assumed there were no cancer recurrences after year 20 of follow-up. Although heart failure (HF) is a major adverse effect associated with trastuzumab, to simplify the analytical structure we did not include a HF state. However, its impact was accounted for by adding its weighted influence, according to the incidence of symptomatic HF, to the cost and quality of life during the first cycle of active adjuvant trastuzumab therapy. Cardio toxicity was assumed to develop during the first cycle, last only 1 year, be reversible in 100 percent of the patients and produce no additional mortality.

Figure 1. Markov model scheme.
A hypothetical cohort of 10,000 women was modeled for each strategy. All the individuals enter the model in the R state, are 55 years old, have a HER2-positive early breast cancer, which has been completely excised and treated with at least four cycles of adjuvant chemotherapy, and are able to receive adjuvant treatment with trastuzumab. For model development and reporting, we followed the recommendations of the International Society for Pharmacoeconomics and Outcomes Research (ISPOR) – Society for Medical Decision Making (SMDM) modeling task force (Reference Caro, Briggs, Siebert and Kuntz29).
Cost-Effectiveness Analysis and Derivation of Cost-Effective Price Thresholds
The analysis was carried out from the perspective of each country's healthcare system. Cost-utility and cost-effectiveness assessments were carried out to compare the long-term costs and outcomes of 12 months of adjuvant chemotherapy for HER2-positive breast cancer with and without trastuzumab. Cost-effectiveness was evaluated using the incremental cost-effectiveness ratio (ICER). ICERs are calculated as the ratio between the difference in costs and the difference in benefits between the two interventions. Costs include the costs of implementing the strategy (trastuzumab cost, HER2 and HF screening), the healthcare resources used as a result of that strategy (HF treatment), minus any medical costs averted (i.e., episodes of cancer recurrence). The difference in benefits is the differences in health outcomes between the trastuzumab and the non-trastuzumab arm (expressed as life-years [LYs] or quality-adjusted life-years [QALYs] gained). Thus, the ICER reflects the additional cost for each additional unit of outcome obtained as a result of using trastuzumab.
In addition to the cost-effectiveness analysis, we also performed a threshold analysis to estimate the price that would make trastuzumab cost-effective in each country. For the derivation of these cost-effective price thresholds (and, by implication, the value-based prices), we set a desired incremental cost per QALY gained for each country as equal to the per capita GDP. While there is limited scientific evidence on which to specify cost-effectiveness thresholds in low and middle income countries, we chose this value of one GDP per capita (GDPPC) for several reasons. It has been suggested by the WHO as a threshold below which health-care interventions can be considered cost-effective (Reference Sachs30) and it is often referenced in Latin America, or used for resource allocation decision making when considering the adoption of new health technologies. For example, Mexico explicitly considers one GDP per capita per LY or QALY as the maximum acceptable value of the ICER when deciding the inclusion of technologies in the public healthcare system (Reference Barajas and Ríos31) and is also the threshold to define a technology as cost-effective in Chile (32) and Colombia (33).
This practice is also observed in other parts of the world, where many countries, implicitly or explicitly, apply a value close to their national GDP per capita. In the United Kingdom, the National Institute for Health and Clinical Excellence (NICE) has been using a cost-effectiveness threshold range between 20,000 and 30,000 pounds per QALY, a figure very close to the national GDPPC (26,000 pounds). A similar practice is followed in Australia, where the commonly cited threshold is around USD 55,000 (Reference George, Harris and Mitchell34), slightly less than its GDPPC of USD 66,400. Cost-effectiveness analyses in the USA commonly use a figure of USD 50,000–100,000 per LY or QALY as a threshold for assessing the cost-effectiveness of an intervention (GDP per capita in United States is USD 48,300). Although it remains a matter of debate, one GDP per capita per LY or QALY is recognized almost universally as a threshold below which an intervention can certainly be regarded as cost-effective. In the sensitivity analysis, we also evaluated the results under a three GDPPC threshold, because this is the upper bound of the threshold range suggested by the WHO.
Expected future costs and benefits were converted to present values through discounting. Following the recommendations of most LA guidelines (Reference Augustovski, Garay, Pichon-Riviere, Rubinstein and Caporale35), costs and effects were discounted at a rate of 5 percent per annum.
Epidemiological, Effectiveness, Safety, and Quality of Life Data
For the base case analysis, the transition probabilities between states, clinical benefit of trastuzumab and risk of cardiac toxicity were estimated from the results of the HERA trial (Reference Gianni, Dafni and Gelber36–Reference Piccart-Gebhart, Procter and Leyland-Jones38). The model was calibrated until the overall survival and disease-free survival curves at 5 years were within ±2.5 percent of the values of the trial. A hazard ratio of 0.59 for trastuzumab was used for the first 5 years. Because no evidence was available for a longer time horizon, we decided not to model additional benefits of trastuzumab beyond this period.
After a search of primary preference-based studies, the quality of life weights were obtained from two studies that used the EQ-5D index (Reference Paul, Richard and Rabin39), one in breast cancer patients (Reference Lidgren, Jonsson, Rehnberg, Willking and Bergh16) and another in patients with symptomatic heart failure (Reference Calvert, Freemantle and Cleland40). Age-specific death rates for all other causes were obtained from each country's National Vital Statistics. General model input parameters are shown in Table 1 and country specific parameters in Table 2.
Table 1. General Model Inputs

Note. 1way SA, ranges used in the one way sensitivity analysis; R, remission; LR, loco-regional recurrence; DR, distance recurrence; BCD, breast cancer death; HF, heart failure.
Table 2. Country Specific Inputs

Note. Her2+ test**: this cost was weighted in each country to reflect all the tests needed to identify the number of women included in the model according to the local proportion of Her2+ breast cancers (Weighted cost per woman = Her2+ test cost /proportion of Her2+ breast cancers)
*** All costs followed a micro-costing approach. Sources for each country are: ARGENTINA: Local expert estimation, Base de Costos Unitarios IECS (55) BOLIVIA: Local expert estimation; BRAZIL: Local experts estimation based on: Instituto Nacional del Cáncer INCA (http://www.inca.gov.ar), Departamento de informática do SUS DATASUS (http://www.datasus.gov.br), Banco de Preços em Saúde (http://bps.saude.gov.br); CHILE: Local expert estimation, Dirección de Compras y Contratación Pública (https://www.mercadopublico.cl), Estudio costo-efectividad de intervenciones en salud (56); COLOMBIA: Local expert estimation based on published literature (Reference Martinez and Diaz57, Reference Sánchez-Castillo58). PERU: Local expert estimation, Tarifario del Instituto Nacional de Enfermedades Neoplásicas, (59) Oncosalud (http://www.oncosalud.com.pe); URUGUAY: Local expert estimation based on Fondo Nacional de Recursos (http://www.fnr.gub.uy).
****Estimated from the model. See the alternative scenario analyses section.
Her2+, proportion of incident breast cancers that are HER2 positive; HF, heart failure.
Resource Use and Costs
Cost estimations were based on a micro-costing approach. The process was guided by a common costing template which had previously been designed and validated amongst the country teams. Public sector sources such as registries and hospital charges were used in all countries. When necessary, inflation adjustments were applied using local Consumer Price Indexes (CPI). The total cost of the treatment with trastuzumab was calculated considering a first dose of 8 mg/kg, followed by sixteen doses of 6 mg/kg for an average woman weighing 63 kg and including a drug wastage rate of 10 percent. In the first year, the R state in the trastuzumab arm also included the cost of routine HF screening for all patients, the weighted cost of HF treatment, and the weighted cost of the HER2+ tests needed to identify the patients in each cohort, according to the local HER2+ prevalence in each country. All costs were expressed in 2012 U.S. dollars (USD). See Table 2.
Alternative Scenario Analyses
In addition to the base case analysis, two different scenarios were developed to account for the structural uncertainty of extrapolating trial data to each country's specific epidemiological situation.
Alternative scenario 1: in this scenario transition probabilities (from R to LR, from R to DR, and from LR to DR) were calibrated to obtain, in the non-trastuzumab arm, 5-year survival rates similar to those expected in each country for a cohort of patients with the same characteristics of those included in trastuzumab clinical trials. The estimation of these expected survival rates was based on Globocan data (41), the relative risk of death of each breast cancer stage and HER2+ patients from international studies (Reference Bland, Menck and Scott-Conner42;Reference Paik, Bryant and Tan-Chiu43), the proportion of HER2+ cases (Reference Prieto and Torres44–Reference Vázquez, Krygier and Barrios48), and the mix of breast cancer stages at diagnosis in each country. In this scenario the absolute clinical benefit of trastuzumab turns out to be greater, as it has the same relative effect (HR = 0.59) but on higher patient risks, because disease prognosis is poorer in LA countries as compared to clinical trial data. Therefore, this scenario is favorable to trastuzumab.
Alternative scenario 2: this scenario uses, for the non-trastuzumab arm, the same transition probabilities estimated for the alternative scenario 1, but the transition probabilities for the trastuzumab arm are adjusted to obtain an absolute benefit of trastuzumab for each country similar to the absolute benefit observed in clinical trials:
 \begin{equation*}
{\rm TpTz}_2 = {\rm TpNT}_1 - ({\rm TpNT}_{\rm b} - ({\rm TpNT}_{\rm b} \times {\rm HR})
\end{equation*}
\begin{equation*}
{\rm TpTz}_2 = {\rm TpNT}_1 - ({\rm TpNT}_{\rm b} - ({\rm TpNT}_{\rm b} \times {\rm HR})
\end{equation*}
where TpTz2: transition probability for the trastuzumab arm in scenario 2, TpNT1: Transition probability for the non-trastuzumab arm from scenario 1, TpNTb: Transition probability for the non-trastuzumab arm in the base case, HR: Base Case Hazard ratio of trastuzumab.
(TpNTb – (TpNTb x HR) is the absolute benefit (i.e., absolute reduction in the transition probabilities) attributable to trastuzumab in the base case (i.e., using clinical trials data). This value subtracted to the transition probabilities of scenario 1 result in the new transition probabilities for scenario 2.
This scenario is more conservative in terms of the benefits of trastuzumab because adjustment results in a smaller effect of trastuzumab, in relative terms, than that observed in the clinical trials. Adjusted transition probabilities for scenarios 1 and 2 are shown in Table 2.
Sensitivity Analysis
A deterministic sensitivity analyses (DSA) was performed to estimate the impact of uncertainty on results by varying each parameter separately into a specific range of values. The most influential parameters in the DSA were included in a probabilistic sensitivity analysis where all inputs were varied simultaneously across 10,000 Monte Carlo simulations, according to specific probability distributions. Ranges and distributions are detailed in Table 1.
RESULTS
The addition of 12 months’ adjuvant treatment with trastuzumab was both more effective and more costly than standard care in all countries and all scenarios. In the base case analysis, undiscounted results showed that trastuzumab results in a gain ranging from 1.67 to 2.13 LYs or 1.05 to 1.36 QALYs, at an incremental cost of USD 23,374 to USD 60,741 per patient in a lifetime horizon across countries. Corresponding discounted values were 0.87 to 1.00 LY; 0.51 to 0.60 QALYs; and USD 24,700 to USD 60,800, representing a cost per QALY gained that ranges from USD 42,100 to USD 110,300 (Table 3). These ICERs, expressed in terms of GDPPC per QALY gained, ranged from 3.6 in Uruguay to 35.5 in Bolivia.
Table 3. Base Case Results per Country. Life-years, quality-adjusted life-years, costs, incremental cost-effectiveness ratios, and indicative price of trastuzumab to be cost-effective under a willingness to pay thresholds of one GDP per capita per QALY (2012 USD).
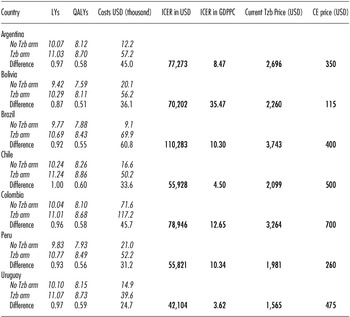
Note. GDPPC are those reported by World Bank 2010: Argentina = USD 9,124; Bolivia = USD 1,979; Brazil = USD 10,710; Chile = USD 12,431; Colombia = USD 6,240; Peru = USD 5,401; Uruguay = USD 11,633. Exchange rates per country come from International Monetary Fund 2012 (WEO outlook database): Argentina $/USD = 4,67; Bolivia $/USD = 6,86; Brazil $/USD = 1,84; Chile $/USD = 476,5; Colombia $/USD = 1.775,0; Peru $/USD = 2,89; Uruguay $/USD = 19,10.
LY, life-years; QALYs, quality-adjusted life-years; USD, United States dollars; ICER in USD, incremental cost-effectiveness ratio expressed in United States dollars per QALY; ICER in GDPPC, incremental cost-effectiveness ratio expressed as gross domestic product per capita (GDPPC); Tzb, trastuzumab; CE price, indicative in-country value for one vial of 440 mg of trastuzumab in order to be cost-effective under a willingness to pay thresholds of one GDPPC per QALY; No Tzb arm, No Trastuzumab arm; Tzb arm, Trastuzumab arm; Difference, difference between Tzb arm and No Tzb arm.
In the alternative scenarios, the main differences were in the estimation of benefits. These variations affected the ICERs between ±25 percent as compared to the base case scenario. The first alternative scenario showed results more favorable to trastuzumab, with a discounted incremental benefit and cost that ranged from 1.05 to 1.26 LYs; 0.67 to 0.87 QALYs; and USD 26,087 to USD 61,102, which corresponded to an ICER between USD 30,600 to USD 87,200 or 2.6 to 27.2 GDPPC per QALY in Uruguay and Bolivia, respectively. In the second alternative scenario, the most conservative in terms of trastuzumab effect, discounted incremental benefit and cost ranged from 0.65 to 0.88 life-years; 0.38 to 0.53 QALYs; and USD 25,701 to USD 61,277, which corresponded to an ICER between USD 63,800 to USD 142,800 or 5.5 to 43.8 GDPPC per QALY. (See Supplementary Table 1 for further details on results per scenario.)
The deterministic sensitivity analysis (DSA) showed consistent results across countries. Supplementary Figure 1 summarizes the results of the DSA in a tornado diagram. The most influential parameters were the discount rate, the HR of trastuzumab and the cost of trastuzumab treatment. These parameters, along with other eighteen variables, were included in the probabilistic sensitivity analysis (PSA). The PSA showed a 0 percent probability of trastuzumab being cost-effective if the willingness-to-pay (WTP) threshold is one GDPPC per QALY. This result was consistent across all countries and in the three different scenarios analyzed. Under a WTP threshold of three GDPPC per QALY, the probability of trastuzumab being cost-effective continued to be zero in all countries except for Chile and Uruguay, where the values were 4.3 percent and 26.6 percent, respectively. (The cost-effectiveness acceptability curves per country can be seen in Supplementary Figure 2.)
We also estimated an indicative in-country price for one 440 mg vial of trastuzumab at which trastuzumab would be cost-effective for a willingness to pay per QALY of one GDPPC. Table 3 shows this, and compares these results with the current selling prices of trastuzumab in each country. To be cost-effective, under this one GDPPC per QALY threshold, the selling price of trastuzumab would need to decrease between 69.6 percent in Uruguay to 94.9 percent in Bolivia.
DISCUSSION
The results of our analyses show that in these seven LA countries the ICER of trastuzumab ranged from USD 42,000 to USD 110,000 per QALY gained. In terms of current dollars, these results are slightly higher than those obtained in economic evaluations (EEs) of trastuzumab in high-income countries (Reference Chan, Leung, Lu and Lin14–Reference Hall, Hulme and McCabe24), although the differences are not large. This is explained by the similar differences in cost and in benefits reported in these previous EEs. According to our model, the use of trastuzumab may produce an incremental benefit of 0.51 to 0.60 QALYs. These values are similar to the ones obtained in EEs carried out in United Kingdom, Finland, or Canada (0.5, 0.7, and 0.6 QALYs, respectively) (Reference Fagnani, Colin, Arveux, Coudert and Misset21;Reference Purmonen, Pankalainen, Turunen, Asseburg and Martikainen23;Reference Hall, Hulme and McCabe24), even though we used a slightly higher discount rate. In our study, trastuzumab cost, one of the most important components to explain the cost difference in trastuzumab EE, was between 25.6 and 61.3 thousand dollars. These values were also comparable to those reported in other EEs (33.5, 44.3, and 51.7 thousand dollars in United Kingdom, Finland, or Canada, respectively) (Reference Fagnani, Colin, Arveux, Coudert and Misset21;Reference Purmonen, Pankalainen, Turunen, Asseburg and Martikainen23;Reference Hall, Hulme and McCabe24).
However, although the difference in cost, the difference in benefits, and the resulting ICERs look quite similar in terms of current dollars to those observed in high-income countries, their interpretation differs dramatically when analyzed in the context of these LA countries. This becomes apparent when the cost-effectiveness is expressed in terms of GDP per capita as the decision threshold. Several EE of trastuzumab performed in high-income countries found ICERs close to one GDPPC per QALY (1.5, 0.8, 1.1, and 1.5 GDPPC per QALY in Finland, United States, United Kingdom, and Canada, respectively) (Reference Fagnani, Colin, Arveux, Coudert and Misset21;Reference Purmonen, Pankalainen, Turunen, Asseburg and Martikainen23;Reference Hall, Hulme and McCabe24;Reference Kurian, Thompson and Gaw49). Therefore, they generally concluded that trastuzumab was a cost-effective intervention. However, even though we obtained ICERs for LA that were broadly similar in terms of current dollars, they were very far from this threshold of one GDPPC per QALY, ranging from 3.6 GDPPC per QALY in Uruguay to 35.5 GDPPC per QALY in Bolivia.
There is a relationship between the wealth of countries and their level of healthcare expenditure. In fact, less wealthy countries typically spend smaller proportions of their GDP in health care. Therefore, there is no reason to expect that, when judging the cost-effectiveness of interventions, poorer countries would apply higher thresholds (in terms of GDPPC per QALY) than those used in high-income countries. This becomes evident if we measure the cost-effectiveness in terms of per capita health expenditures, where the gap between our results and those obtained in high-income countries becomes even greater. In the EEs of trastuzumab performed in United States, United Kingdom, Finland, and Canada the ICERs obtained were between 5.4 and 16.1 times the mean value that countries’ health expenditure per capita per year. In contrast, according to our study, LA countries would need to spend an equivalent to 60.3 (Uruguay) to 825.9 (Bolivia) yearly health expenditures per capita to gain one additional QALY using trastuzumab. Supplementary Figure 3 shows the ICERs of trastuzumab in terms of yearly health expenditures per head in each country.
Currently, almost all countries in LA tend to provide universal coverage. Within the limit of their economic possibilities, they are also willing to cover access to innovative therapies. The use of economic evidence to prioritize resource allocation is becoming increasingly accepted in LA (Reference Banta26;Reference Pichon-Riviere, Augustovski and Rubinstein27) and the role of cost-effectiveness information is becoming more important to support price negotiations and to decide whether or not to incorporate health technologies into health benefit packages. Just as Mexico has set a threshold of one GDPPC per LY or QALY to determine whether a product is cost-effective or not and to decide on its incorporation into the healthcare system (Reference Barajas and Ríos31), it is expected that the rest of the countries in the region will also begin to consider a threshold between one and three GDPPC, as recommended by the WHO (Reference Sachs30) and similar to those explicitly or implicitly used in high-income countries. Under this scenario, if global pricing policies continue to set similar prices internationally, it will be very unlikely for innovative drugs to be cost-effective in LA or other developing countries.
In LMIC innovative drugs can be expected to have similar clinical effectiveness to that observed in high-income countries, although it may also be substantially lower due to less developed health systems, compliance issues or other factors. However, in most cases, they will have much more unfavorable cost difference ratios. While in high-income countries the costs avoided by fewer recurrences or complications can offset much of the additional cost imposed by the new pharmaceuticals, this is not usually the case in LMIC, whose medical costs are proportionally much lower. This inevitably entails similar or higher ICERs in current dollars, and much higher ICERs and less cost-effective results in terms of GDPPC.
Therefore, LMIC may not provide access to these new pharmaceuticals if they begin to evaluate cost-effectiveness to inform coverage decisions, unless they adopt significantly higher cost-effectiveness thresholds, such as five or ten or more GDPPC per QALY, which does not sound reasonable nor sustainable. So, LMIC will need to negotiate lower prices, more related to their countries’ income, to make new health technologies available for their population. Drug price is the only component of the equation of cost-effectiveness that can be modified to achieve ICERs more consistent with local decision-making thresholds in LMIC. This concept of value-based pricing of drugs, or approval based on incremental cost-effectiveness in relation to average national income, is being used in some high-income countries, and constitutes a promising method for setting limits on the cost of new cancer treatments worldwide (Reference Sullivan, Peppercorn and Sikora25). Its application in LMIC is an even more urgent need.
Our study has several limitations. We took several steps to ensure our model results appropriately reflect the actual situation in each country. Despite these efforts, the lack of good quality local information about breast cancer epidemiology, health resource usage, unit costs, and utilities of different health states are a major limitation of our study and increase the uncertainty of our estimates. However, despite these limitations, and as shown in the sensitivity analysis, the results seem robust. At its current price in LA, adjuvant trastuzumab for early breast cancer in HER2-positive women is a health intervention that cannot be considered cost-effective under current standards, despite having proven to be highly cost-effective in high-income countries. In July 2012, the Brazilian government decided to fund the use of trastuzumab within its public health system (50). However, because the price of trastuzumab in Brazil was 62 percent higher than the international average, and 115 percent higher than the price prevailing in the United States, the decision was made conditional on achieving a price reduction of 63 percent.
The problem presented here does not only concern Latin America. While trastuzumab is the standard of care in most high-income countries and generally found to be cost-effective, it remains controversial in many due to its high costs, as do many other new drugs. Also, the problem is not confined to trastuzumab. Many other new and expensive cancer treatments are currently being funded with public resources in LA, many of which have shown in high-income countries much more unfavorable cost-effectiveness profiles than trastuzumab. LA countries that are currently providing coverage to trastuzumab and other innovative drugs might be paying a very high opportunity cost in terms of benefits forgone, due to the fact that they are allocating their resources to non–cost-effective interventions. Danzon et al. (Reference Danzon, Towse and Mulcahy51) suggest that one way out of this impasse would be to apply differential pricing, based on local assessments of value for money, as described in this study. The implication is that rich countries would pay higher prices than poorer ones, either through an explicit process agreed by all, or on the understanding that individual country prices would remain confidential.
There is a clear awareness that cancer will become a major disease burden in LA countries (Reference Goss, Lee and Badovinac-Crnjevic52). To improve the affordability of key drugs and health technologies, while maintaining incentives for innovation, will be one of the main challenges to reduce the burden of noncommunicable diseases in the coming decades, in rich and poor countries alike. Various strategies have been proposed to secure affordable priced medicines (53) and increase access to cancer care (Reference Knaul, Frenk and Shulman54) and their discussion is beyond the scope of this study. However, beyond the many choices available to governments and health systems, health technology assessment should play a central role. The rigorous evaluation of the cost-effectiveness of interventions to prioritize resource allocation and support price negotiations is critical to make innovative drugs available and affordable in developing countries.
SUPPLEMENTARY MATERIAL
Supplementary Figures 1–3 http://dx.doi.org/10.1017/S0266462315000094
Supplementary Table 1 http://dx.doi.org/10.1017/S0266462315000094
CONFLICTS OF INTEREST
The authors declare that there are no conflicts of interest.


