Introduction
In many natural and crop systems, plants are subject to attack from a range of insects and mites. Damage can vary from loss of the apical meristems or ‘terminals’, loss of reproductive structures, loss of photosynthetic capacity (mesophyll feeders) or assimilate (phloem feeders) or loss of leaf area (leaf tissue consumers) (Crawley, Reference Crawley1983). Compensation in plants following damage caused by invertebrate herbivores is well established in both ecological and agricultural literature (Brook et al., Reference Brook, Hearn and Kelly1992a; Trumble et al., Reference Trumble, Kolodny-Hirsh and Ting1993) Understanding the compensatory responses of economically important crops to pest damage can allow development of plant damage thresholds which, combined with pest abundance thresholds, can reduce use of pesticides to prevent damage that is not economic.
Crawley (Reference Crawley1983) made the important distinction between compensation at the plant level and at the population or crop level. Compensation at the individual plant level involves changes in plant architecture, growth dynamics and allocation patterns that may allow plants to recover from damage (see, for instance, Peterson et al. (Reference Peterson, Danielson and Higley1992) ), often with little loss of productivity, measured as either ecological fitness or crop yield (Crawley, Reference Crawley1983). Many studies have investigated compensation at the plant level, by confining known densities of herbivores to given areas of host plants or using simulated damage applied uniformly to plants in plots, to more precisely understand plant responses to damage and implications for fitness or yield (Brook et al., Reference Brook, Hearn and Kelly1992b; Wilson et al., Reference Wilson, Sadras, Heimoana and Gibb2003).
However, herbivore damage is rarely uniform in either agricultural or natural systems (Wilson & Room, Reference Wilson and Room1983; Taylor, Reference Taylor1984; Karban, Reference Karban1997), resulting in a non-uniform distribution of damage between plants, which may alter plant-to-plant interactions between neighbours (Crawley, Reference Crawley1983). For instance, Sadras (Reference Sadras1996b) showed that terminal loss in cotton plants allowed neighbours to achieve higher yield, resulting in complete or sometimes over-compensation at the crop level. Conversely, loss of fruit resulted in undamaged plants having a lower yield than expected had their neighbours not been damaged (Sadras, Reference Sadras1997). In other words, plant level compensation (e.g. branching after apical damage) will occur irrespective of what the neighbours are doing; however, the growth of neighbours will influence the damaged individual's ability to compensate. Therefore, conclusions based on understanding derived from uniform damage experiments, whether using uniform infestation with pests or using simulated damage, may be biased.
On young cotton (Gossypium hirsutum L.), shoot damage involves terminal damage and/or reduced leaf area, the topic of this study. For instance, the primary pests of seedling cotton in Australia are onion thrips (Thrips tabaci Lindeman), tomato thrips (Frankliniella schultzei (Trybom)) and western flower thrips (F. occidentalis (Pergande)), which feed on leaf primordia and young leaves, causing distorted growth and reduced leaf area (Chisholm & Lewis, Reference Chisholm and Lewis1984; Sadras & Wilson, Reference Sadras and Wilson1998; Lei & Wilson, Reference Lei and Wilson2004), lepidopteran larvae, such as the cutworms (Agrotis spp.), lesser armyworm (Spodoptera exigua (Hübner)), the cotton bollworm (Helicoverpa armigera (Hübner)) and the native budworm (H. punctigera (Wallengren)), which remove leaf area, as well as damaging the plant terminal, and coleopteran pests, such as flea beetles (Nisotra submetallica Blackburn and Chaetocnema sp. Blackburn), which cause lacerations or holes in leaves.
Crop response to herbivory, therefore, depends on the type (e.g. vegetative vs. reproductive), timing, intensity and spatial distribution of damage, and it involves both individual plant responses and responses mediated by plant-to-plant interactions. Here, we investigated the responses of cotton crops to non-uniform early season loss of leaf area affecting differentially neighbouring plants. We tested whether neighbour interactions are important in the recovery of cotton from non-uniform early season loss of leaf area and asked ‘if interactions do occur, are they important in interpreting likely compensatory responses to pest damage?’ We used manual damage as an approximation of the outcomes of pest damage that results in reduced leaf area (e.g. see fig. 1 in Lei & Wilson (Reference Lei and Wilson2004) showing effects of thrips damage), though a plant's responses to real pest damage and artificial defoliation may well differ (Baldwin, Reference Baldwin1990) and can be influenced by many factors including the defoliation pattern (Macedo et al., Reference Macedo, Peterson, Dausz and Weaver2007). However, as we were most interested in plant-to-plant interactions in response to non-uniformly distributed damage, spatial distribution of damage is more critical than exactly replicating the effects of herbivores.

Fig. 1. (a) Illustration of the way in which each different plant damage treatment, complete (100%) and partial (75%) leaf area removal, was achieved for each leaf. (b) Distribution of plant damage for 0–100% of plants damaged. Vertical lines indicate individual plants, ‘x’ indicates damaged plants and the short horizontal bars indicate the possible triplet combinations with target plants which were damaged ‘D’ or undamaged ‘U’. (c) Illustration of repeated damage at two, four and six nodes.
Materials and methods
Three experiments were conducted at the Australian Cotton Research Institute, Narrabri, New South Wales (30°13′S, 149°47′E). To exclude possible confounding effects of natural lepidopteran pest damage, all experiments used transgenic Bt-cotton cv Sicala V-2i, containing the Monsanto Co. Cry 1Ac gene. The protein expressed by this gene provides protection against the primary cotton pests in Australia, Helicoverpa spp., as well as a number of other minor lepidopteran pests. To protect against early season damage from other pests such as thrips, aphids or sucking bugs, the systemic insecticide aldicarb (Temik, Bayer Australia Ltd) was applied at sowing at 450 g ai ha−1. Crops were also checked regularly for the presence of pests, which were controlled as required according to standard thresholds (Deutscher et al., Reference Deutscher, Wilson and Mensah2005). Seeds were sown as a single row on raised beds 1 m apart at about 15 seeds m−2, resulting in a plant stand of 10–12 plants m−2 (e.g. plants were about 10 cm apart along the row and separated by 1 m across the row). Experiment 1 was sown on 15 October 1997; experiment 2 on 1 October 1998; and experiment 3 on 21 October 1999. All experiments used a randomized block design with four replications. In experiments 1 and 2, plots were three rows wide (=3 m) and 3 m long. In experiment 3, longer plots were used (6 m) to allow for destructive dry matter harvests. When damage was inflicted, all rows in a plot were damaged. Damage was varied in the proportion of plants damaged and degree of leaf area removal from damaged plants (table 1, fig. 1). Damage was inflicted when plants had two, four and six true leaves (experiment 1: 10, 17 and 28 November; experiment 2: 21 September, 3 and 16 November; experiment 3: 19, 24 November and 3 December, respectively) (fig. 1c).
Table 1. Effect of intensity and distribution of damage on yield and maturity of cotton for experiments from 1997–2000. Expected yield for non-uniformly damaged plots (25, 50 and 75% of plants damaged) was calculated using the yields for the 0% and 100% plants damaged in the appropriate proportions.

In experiment 1, we used a high damage severity per plant (100% leaf area removal, excluding the cotyledons, known hereafter as complete leaf area removal; fig. 1a) and a range of damage distributions between plants (0, 25, 50, 75 and 100% of plants damaged; fig. 1b). High damage severity was used as a starting point as Wilson et al. (Reference Wilson, Sadras, Heimoana and Gibb2003) found that leaf area removal in excess of 80% was required to reduce yield. Complete leaf area removal was achieved by cutting the leaf off at the junction of the blade and petiole. Where 25, 50 or 75% of plants were damaged, the same plants were re-damaged between successive damage events (fig. 1c), approximately simulating the effect of pests which establish on and repeatedly damage a plant (e.g. thrips). In the 25% of plants damaged plots, the first plant in the row was damaged, then the next three left undamaged, then the next plant damaged, and so on. A similar process was applied to the other treatments.
Experiment 2 included all of the experiment 1 treatments, as well as a less severe leaf area removal treatment (75% leaf area removal per plant, known hereafter as partial leaf area removal; fig. 1a) across all damage distributions. Partial leaf area removal was achieved by cutting along one side of the mid-vein, thereby removing 50% of leaf area, then cutting the remainder in half, perpendicular to the mid-vein, thereby leaving 25% of the original leaf area. This treatment was added because we wanted to test if the severity of damage (complete vs. partial leaf area removal) influenced the strength of neighbour interactions.
In experiment 3, we partially replicated the treatments of experiment 2 by again comparing the effects of complete or partial leaf area removal, but only for two damage distributions: 75% and 100% of plants damaged. This was done to confirm the effect of complete or partial leaf area removal. We also added a ‘random’ distribution treatment for comparison of a different damage distribution pattern. In the random distribution treatment, 75% of the plants in the plot were damaged according to a random distribution using either complete or partial leaf area removal. In subsequent damage events in the random treatment, a different random distribution was used but only for the leaves that had grown between the two damage events. The random treatment simulated situations where pests do not necessarily re-damage the same plant. The random treatment was replicated within the experiment at two intensities.
Plant measurements
In experiment 1, we recorded plant height, number of nodes and number of flower buds (squares) on 2 December 1997, after the last damage treatment had been imposed. Measurements were made on the central plants of triplets. The triplets described the status of the neighbours on either side of the target plant, i.e. UDU signified a damaged target plant (D) with undamaged plants (U) on either side along the row (see fig. 1b). Five central plants were measured from each triplet combination in each plot. Hence, in the undamaged plots, the triplet was UUU; in the 25% damage, they were: UUU, UDU, UUD; in the 50% damage, they were: UDU or DUD; in the 75% damage, they were: DDD, DDU, DUD; and in the 100% damage, it was DDD. For simplicity, the UUU triplets are referred to as undamaged triplets and the DDD as damaged triplets.
In experiment 2, a simpler system of recording was used to compare differences in responses of neighbours between the complete and partial leaf area removal treatments. For each of these damage levels, five centre plants of each of the triplets, DDD, UDU, UUU and DUD, where appropriate, were selected at random from non-harvest areas of each plot and their number of nodes, height, number of squares and number of flowers recorded. Samples were collected on 26 November 1998, ten days after the last damage event and on 7 January 1999.
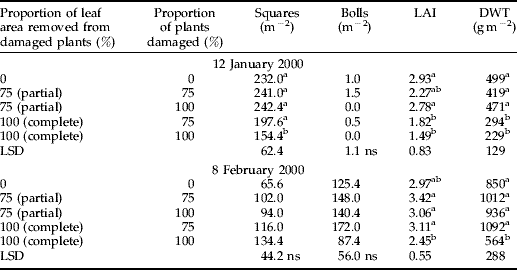
In experiment 3, larger plots were used, allowing for harvest of 0.5 m of row taken from the middle row of each plot, excluding the random damage plots. Before the harvest was taken, plants were classed according to their neighbour status in triplets, as described for experiment 1, and tagged accordingly. Within the plots where samples were taken, the number of plants of any particular triplet varied between treatments due to the differences in the frequency of particular triplets in treatments with different damage distributions. For each plant collected, its neighbour status was recorded along with the number of nodes, squares, flowers and bolls produced, leaf area and dry weight (including tap root). Two plant harvests were taken, on 12 January 1999 and on 8 February 2000.
Harvest by neighbour
To measure final yield and maturity date and to understand how damage had affected the yield of plants, weekly harvests were made from the time the first fruit (boll) opened until the last boll had opened. Shortly before the first bolls opened, 2 m sections of the central row of each plot were marked. Within these sections, each plant was individually labelled according to its damage treatment and its neighbour status as the centre plant of a triplet. For each plot at each harvest, the different neighbour triplets were harvested separately, counting the number of bolls harvested on each date. This continued weekly, harvesting the new group of open bolls each week, until all bolls were harvested. Each sample was then weighed separately, ginned to separate seed from lint and the lint weight recorded. For each triplet in each plot, summing the lint weight across dates allowed us to derive a final yield for the central plants of the triplet. Summing the total lint weights harvested for each plot allowed a final lint yield per metre to be calculated. Maturity date was estimated as the date at which 60% of bolls had opened (Snipes & Baskin, Reference Snipes and Baskin1994).
Statistical analysis
Effects of treatments on plant and crop growth, yield and maturity were tested using ANOVA in Genstat for Windows 8th edition (Payne et al., Reference Payne, Harding, Murray, Soutar, Baird, Welham, Kane, Gilmour, Thompson, Webster, Wilson and Payne2005). Where ANOVA indicated statistically significant differences, Fisher's protected least significant difference (LSD) was used to compare means. As all treatments did not occur in all years, we were interested to understand differences in results between experiments (years) and used ANOVA to compare the yield of the treatments common to experiments 1 and 2, experiments 2 and 3 and those that occurred in all three experiments. Significant interaction effects (treatment×year) would indicate potential for different responses to treatments between years.
We were also interested in comparing the actual yield of treatments (Ya) with their expected yield (Ye), which was calculated as:
where pd and pu are the actual proportions of damaged and undamaged plants in the crop, and Yd and Yu are the yields of damaged and undamaged plants measured in the uniform treatments. This comparison allowed testing of the null hypothesis of no neighbour effect on compensation after damage, i.e. Ye=Ya. Statistical tests of this hypothesis included ANOVA, using yields from individual plots and regression analysis. Since both actual and expected yield have errors, model II (reduce major axis) regression was used (Niklas, Reference Niklas1994; Fila et al., Reference Fila, Bellocchi, Acutis and Donatelli2003). Acceptance of the null hypothesis requires an intercept not different from zero and a slope not different from one. As suggested by Dent & Blackie (Reference Dent and Blackie1979), we verified that the intercept and slope simultaneously are not different from 0 and 1, respectively, using an F statistic with 2 and n–2 degrees of freedom, as explained in the IRENE package (Fila et al., Reference Fila, Bellocchi, Acutis and Donatelli2003).
Results
Effect of damage on crop yield and maturity
Only the damage treatments that included a high proportion of plants damaged (75 or 100% of plants) combined with a high degree of damage per plant (e.g. complete leaf area removal) reduced crop yield or delayed maturity compared with the undamaged control (table 1). Yields were high in experiment 1, due to low insect pest numbers and warmer temperatures through the later half of the growing season, allowing plants to set and mature more bolls. In experiment 2, the crop experienced less favourable weather (higher rainfall and more cloudy days), as well as higher pest pressure late in the crop season (see fig. 5 in Wilson et al. (Reference Wilson, Mensah, Fitt, Horowitz and Ishaaya2004) ), which meant that yields were reduced despite insecticides being applied when pests exceeded threshold. Conditions in experiment 3 were intermediate with moderate insect pressure, and yields were more typical of commercial crops. Analysis of between-year effects showed no interaction of experiment (year) with treatments for experiments 1 and 2 (F=1.31; df=4, 24; P=0.294) or experiments 2 and 3 (F=1.98; df=4, 24; P=0.129), indicating a consistent response to damage treatments between these pairs of experiments. There was a significant, though slight, treatment by year interaction for the treatments common to all experiments (F=3.24; df=6, 28; P<0.001) due to a high undamaged treatment yield in experiment 1 only.
Effect of damage and neighbour status on plant growth
In experiment 1, plant growth assessments were taken about four weeks after the last damage event in early December. At this time, complete leaf area removal significantly reduced plant growth (height, number of nodes and square production) (df=9,187; P<0.05 in all cases) (fig. 2a–c; compare black and grey bars). Neighbour status only affected plant height where undamaged target plants next to damaged neighbours (DUD) were shorter than those in undamaged triplets (UUU) (fig. 2b). Otherwise, neighbour status had no significant effect, e.g. damaged plants that had undamaged neighbours on either side had less nodes, were shorter and had fewer squares than control plants but were similar to damaged plants with damaged neighbours (fig. 2a–c; compare black bars). Similarly, undamaged target plants in DUD triplets were similar to the target plants in undamaged triplets (UUU) (fig. 2a–c; compare grey bars).

Fig. 2. Nodes, height (cm) and flower buds (squares) per plant for plants of different neighbour status (uniformly undamaged, UUU; uniformly damaged, DDD; damaged plant between undamaged plants, UDU; and so on) and damage distribution, none damaged (0%), 25, 50, 75 or 100% of plants damaged by removing all true leaves on three occasions (two, four and six true leaves) in experiment 1. Measurements were made on 2 December 1997. Light grey bars are undamaged target plants, while black bars are damaged target plants.
In experiment 2, assessments of plant growth were made about three and nine weeks after the final damage event in mid-November and early January. Both the degree of leaf area removal and neighbour status significantly influenced plant growth (figs 3 and 4). On the first date, node production was reduced in the complete leaf area removal treatment but not the partial leaf area removal treatment (F=23.52; df=6, 28; P<0.001) (fig. 3a). For the complete leaf area removal treatment, undamaged target plants with damaged neighbours (DUD) had more nodes than undamaged controls (UUU) (fig. 3a; compare pale grey bars which are undamaged target plants). Damage significantly reduced plant height (F=16.88; df=6, 28; P<0.001), with the complete leaf area removal treatment causing a larger reduction (fig. 3; compare dark grey (partial leaf removal) and black bars (complete leaf removal) with UUU)). Plant height was influenced by neighbours as the undamaged target plants with damaged neighbours (DUD) were shorter than the target plants in undamaged triplets (UUU) (fig. 3b; compare between the pale grey bars).

Fig. 3. Nodes per plant for plants of different neighbour status (uniformly undamaged, UUU; uniformly damaged, DDD; damaged plant between undamaged plants, UDU; and so on) and damage distribution, none damaged (0%), 75 or 100% of plants damaged by removing all true leaves on three occasions (two, four and six true leaves), experiment 2, 26 November 1998. Light grey bars are undamaged target plants, while dark grey bars are damaged target plants with partial leaf area removal (75% of leaf area removed), and black bars are damaged target plants with complete leaf area removal (100% of leaf area removed).

Fig. 4. Nodes, height (cm) and flower buds (squares) per plant for plants of different neighbour status (uniformly undamaged, UUU; uniformly damaged, DDD; damaged plant between undamaged plants, UDU; and so on), experiment 2, 7 January 1999. Light grey bars are undamaged target plants, while dark grey bars are damaged target plants with partial (75%) leaf area removal, and black bars are damaged target plants with complete (100%) leaf area removal.
On the second date, in experiment 2, neither partial nor complete leaf area removal affected node production or square production in damaged (DDD) compared with the undamaged triplets (UUU), but they did reduce plant height (fig. 4a–c; compare DDD with UUU). Node production, plant height and square production all showed neighbour interactions. In the complete leaf area removal treatment, undamaged target plants with damaged neighbours (DUD) produced more nodes than the undamaged controls (UUU) (fig. 4a; compare pale grey bars, legend as for fig. 3). In both the partial and complete leaf area removal treatments, target damaged plants with undamaged neighbours (UDU) had fewer nodes than the target plants in damaged triplets (DDD) (fig. 4a; compare within dark grey bars and black bars). Damaged target plants with undamaged neighbours (UDU) were shorter than target plants in damaged triplets (DDD) (fig. 4b; compare within dark grey bars and black bars), but undamaged target plants with damaged neighbours (DUD) were no different to target plants in undamaged triplets (UUU) (fig. 4b; compare between pale grey bars). In the complete leaf area removal treatments, square production of damaged target plants with undamaged neighbours (UDU) was reduced compared with target plants in damaged triplets (DDD) (fig. 4c; compare between black bars), while that of undamaged target plants with damaged neighbours (DUD) was significantly increased compared with that of target plants in undamaged triplets (UUU) (fig. 4c; compare between pale grey bars).
In experiment 3, the effect of uneven damage was assessed on the stated dates, as for experiments 1 and 2. On the first date (January 12), the heaviest damage treatment, 100% of plants damaged by complete leaf area removal, reduced the number of squares compared with the undamaged control. The leaf area index and dry weight of the two treatments with complete leaf area removal were also significantly less than the undamaged control. On the second date (February 8), there were no significant differences between treatments in square or boll production; however, LAI and DWT of the heaviest damage treatment remained below that of the undamaged control (table 2).
Table 2. Number of squares, bolls, leaf area index (LAI) and plant dry weight (DWT) for control and damage treatments in experiment 3, 1999–2000.

ns, not significant.
Neighbour status had a strong effect on plant growth and fruit production for both dates in experiment 3. On both dates, undamaged target plants with damaged neighbours (DUD) had more nodes (for complete damage), more squares, greater leaf area and higher dry weight than target plants in undamaged triplets (UUU) (fig. 5; compare the pale grey bars). This effect was stronger for the complete than the partial leaf area removal treatment. Similarly, in the 75% of plants damaged treatments, damaged target plants in damaged triplets (DDD) or in triplets with an undamaged neighbour (DDU) in the 75% of plants with complete leaf area removed treatment had significantly fewer squares, bolls, leaf area and dry weight than damaged target plants in damaged triplets (DDD) in the 100% of plants damaged treatment. This trend was evident, but not significant, in the partial leaf area removal treatment.

Fig. 5. Nodes, flower buds (squares), bolls, leaf area (cm2) and dry weight (g) per plant for plants of different neighbour status (uniformly undamaged, UUU; uniformly damaged, DDD; damaged plant between undamaged plants, UDU; and so on) and damage distribution, none damaged (0%), 75% or 100% of plants damaged, experiment 3, 12 January (left) and 8 February (right) 2000. Light grey bars are undamaged target plants, while dark grey bars are damaged target plants with partial (75%) leaf area removal, and black bars are damaged target plants with complete (100%) of leaf area removal.
Relationship between damage, neighbour status and plant yield
There were strong neighbour effects for plant yield. In experiment 1, damaged target plants with one or both neighbours undamaged (UDU or DDU) yielded significantly less than the target plants in damaged triplets (fig. 6, see grey bars). Interestingly, even the damaged target plants with damaged neighbours (DDD) in the 75% of plants damaged treatment yielded less than similar plants in the damaged triplets, possibly indicating an effect that carries further than one neighbour. Conversely, undamaged target plants with damaged neighbours on both sides (DUD) yielded far more than target plants in undamaged triplets (UUU; fig. 6, see black bars). However, the yield of undamaged target plants with one damaged neighbour (UUD) did not differ from the target plants in damaged triplets. Undamaged target plants in undamaged triplets (UUU) yielded more than target plants in damaged triplets (DDD), indicating the effect of damage on yield.

Fig. 6. Cotton lint yield per plant (g) per plant for plants of different neighbour status (uniformly undamaged, UUU; uniformly damaged, DDD; damaged plant between undamaged plants, UDU; and so on) and damage distribution, none damaged (0%), 25, 50, 75 or 100% of plants damaged by removing all true leaves on three occasions (two, four and six true leaves) in experiment 1. Light grey bars are undamaged target plants, while black bars are damaged target plants.
In experiment 2, there were two severities of damage, partial or complete leaf area removal. The complete leaf area removal treatment showed neighbour status interactions with yield, which were essentially similar to experiment 1 (fig. 7a, see grey bars). Damaged target plants with undamaged neighbours (UDU) yielded less than target plants in damaged triplets (DDD), though this was only significant for the 25% of plants damaged treatment. Undamaged target plants with damaged neighbours (DUD) on both sides yielded more than those in undamaged triplets (UUU) (fig. 7a, compare black bars). In contrast, when the severity of damage was reduced to partial leaf area removal, the trends in neighbour interactions were less pronounced (fig. 7b). Only the undamaged target plants with damaged neighbours (DUD) yielded significantly more than the other treatments.
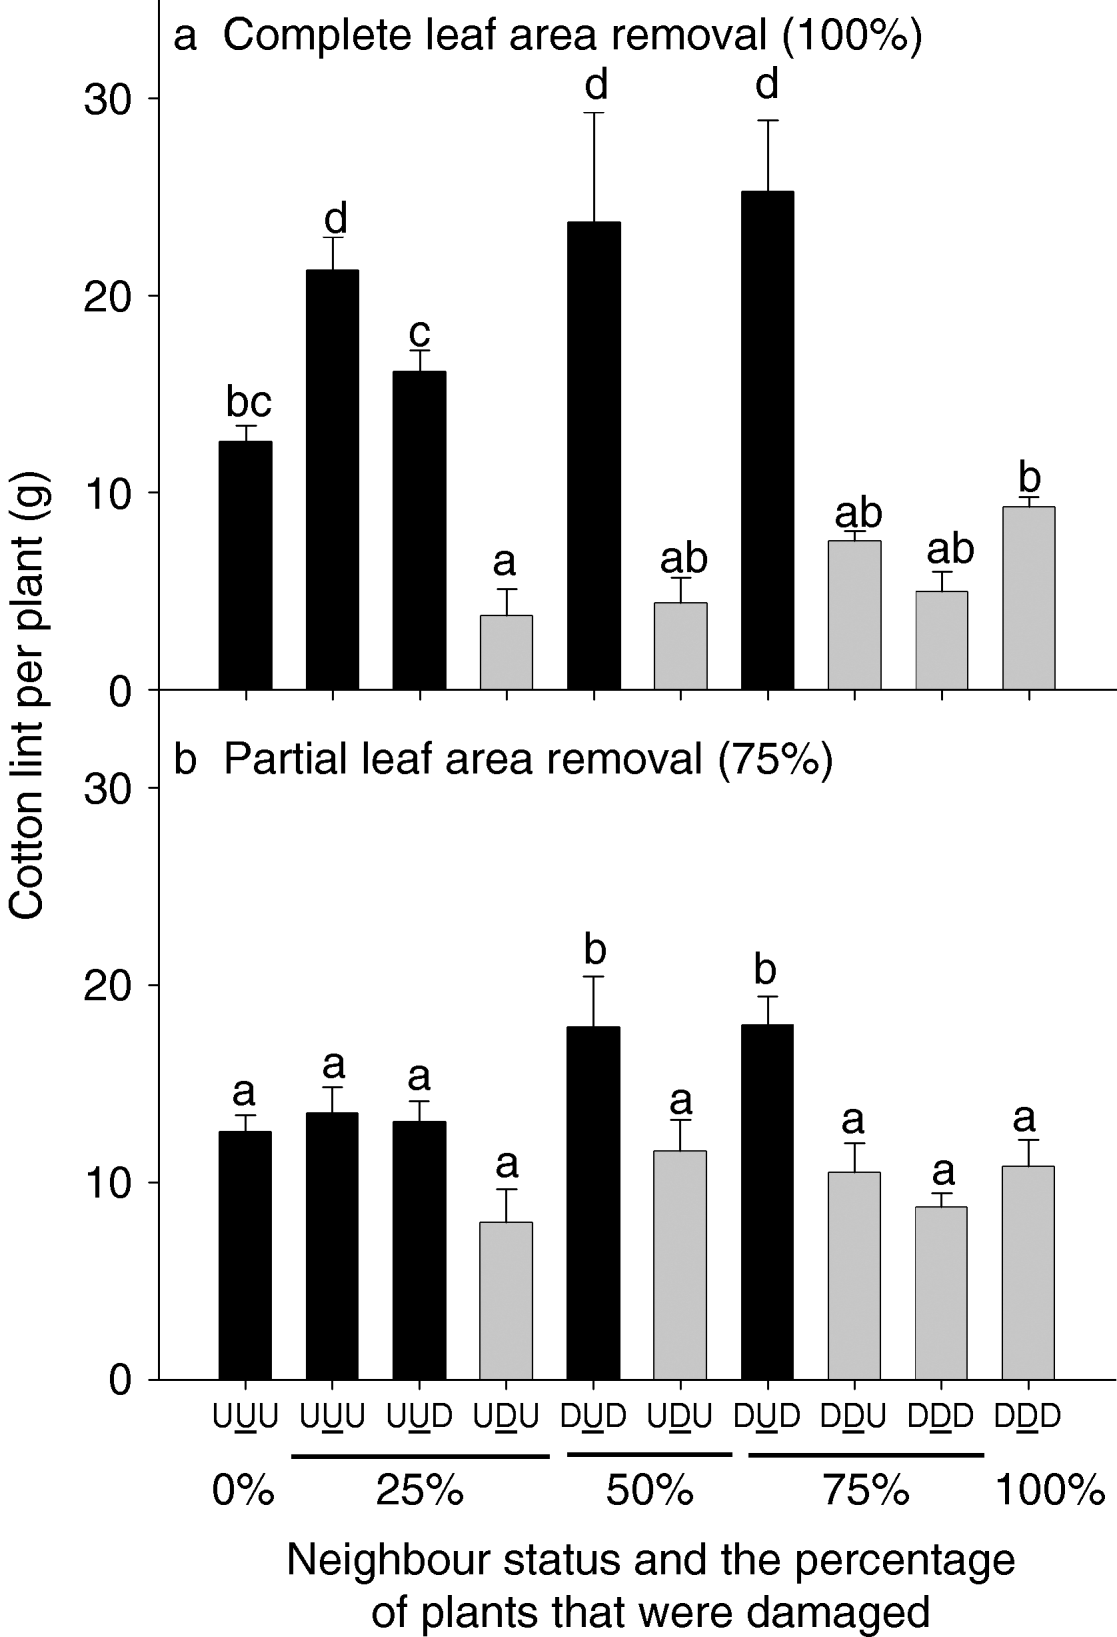
Fig. 7. Cotton lint yield (g) for plants of different neighbour status (uniformly undamaged, UUU; uniformly damaged, DDD; damaged plant between undamaged plants, UDU; and so on) and damage distribution, none damaged (0%), 25, 50, 75 or 100% of plants damaged and different intensities of leaf removal: (a) complete (100%) leaf area removal or (b) partial (75%) leaf area removal, experiment 2, 7 January 1999. Light grey bars are undamaged target plants, while black bars are damaged target plants.
In experiment 3, results were similar to those in experiment 2; the neighbour effects were more pronounced in the complete than the partial leaf area removal treatments (fig. 8). In the randomly damaged treatments, plant yield was similar to the uniformly damaged (DDD) and undamaged (UUU), which did not differ.

Fig. 8. Cotton lint yield (g) for plants of different neighbour status (uniformly undamaged, UUU; uniformly damaged, DDD; damaged plant between undamaged plants, UDU; and so on) and damage distribution, none damaged (0%), 75 or 100% of plants damaged by removing 100% or 75% of the plant's leaf area on three occasions (two, four and six true leaves), experiment 3, 2000. The random treatment (Ran) had 75% of plants with partial (75%) or complete (100%) leaf area removal; however, allocation of plants to be damaged for each damage event was done randomly. White bars are undamaged target plants, pale grey bars are the random damage treatments, while dark grey bars are damaged target plants with partial (75%) leaf area removal, and black bars are damaged target plants with complete (100%) of leaf area removal.
Comparison of actual and expected yield
ANOVA for individual experiments indicated no difference between actual yield and the yield expected assuming no neighbour effects (equation 1) for experiment 1 (F=0.84; df=1, 15; P=0.374) or experiment 2 (F=0.56; df=1, 36; P=0.461). In experiment 3, actual yield was 17% higher than the expected yield for the partial leaf area removal treatments (F=11.21; df=1, 21; P=0.003; LSD=15.12) (table 1). Pooling the data of all experiments, comparison of actual and expected yield returned a model II regression with intercept (10.9) and slope (0.88) which were different from zero and one, respectively, at P=0.08 (fig. 9).

Fig. 9. Comparison of actual lint yield and yield expected under the assumption of no neighbour effect. The dashed line is the null hypothesis, i.e. no difference between actual and expected, and the solid line is the fitted model II regression. Data from experiments 1–3.
Discussion
Effects of damage on yield
The damage treatments reduced yield in accordance with the intensity of damage (complete or partial leaf area removal) and the proportion of plants damaged at the seedling stage; the partial leaf area removal treatment did not significantly reduce yield even when all plants were damaged, whereas the complete leaf area removal treatment generally reduced yield and this effect increased as the proportion of plants damaged increased. Similarly, the partial leaf area removal treatments did not delay crop maturity; but the complete leaf area removal treatments did, with the delay generally increasing as the proportion of plants damaged increased. This finding supports earlier studies showing that cotton has a strong capacity to compensate for loss of leaf area in the pre-squaring period (Brook et al., Reference Brook, Hearn and Kelly1992b; Wilson et al., Reference Wilson, Sadras, Heimoana and Gibb2003). The response of cotton to damage was also generally consistent between experiments, despite differences in yield between years. Damage treatments affected the growth of plants including fruit production, leaf area and dry matter production; and this was evident in samples within two or three weeks after the time of final damage (e.g. 12 January; table 2), while in samples taken later (8 February; table 2) it was evident that compensation had occurred in many treatments.
Effect of damage and neighbour status on growth and plant yield
Damage and neighbour status had a strong influence on plant growth and yield. In general, the growth and yield of damaged plants with undamaged neighbours (UDU) was substantially reduced compared with uniformly undamaged plants or uniformly damaged plants. Conversely, the growth and yield of undamaged plants with damaged neighbours was increased compared with uniformly undamaged plants or uniformly damaged plants.
These outcomes confirm that where damage is non-uniform both plant-level and population-level compensation processes are involved; and, depending upon the intensity and timing of damage, the relative significance of each mechanism varies. This indicates a high degree of interference between plants generated by the setback to plant growth initially caused by loss of leaf area. The loss of leaf area reduces the growth rate of damaged plants, as indicated by reduced height, especially those plants where there was complete removal of leaf area (see figs 2–5 and table 2). Undamaged plants continue to grow normally, and probably increasingly shade smaller neighbouring damaged plants, whose growth is further affected as indicated by reduced leaf area, dry weight and fruit production (see fig. 5, where plants were sampled about one and two months after the final damage event). This results in an increasing difference in size between neighbouring damaged and undamaged plants, both above ground but probably below ground as well, allowing the undamaged plants increased access to sunlight, water and other nutritional resources. This allows the undamaged plants with damaged neighbours ultimately to grow larger than undamaged plants with undamaged neighbours where more balanced growth of all plants ensures they grow at a similar rate and achieve a similar size. The interference hypothesis is supported by the finding that the intensity of plant-to-plant interaction was modulated by the intensity of individual plant damage; complete leaf area removal resulted in a stronger neighbour effect than partial leaf area removal.
There is also evidence of interference effects extending further than the immediate neighbouring plant. For instance, in experiments 1 and 3, the damaged plant with damaged neighbours in the treatments with 75% of plants damaged yielded less than damaged plants with damaged neighbours in the uniformly damaged treatment (figs 6 and 7). This suggests that the strong growth of the undamaged plants with damaged neighbours in this treatment (DUD) led to plants that were big enough to interfere with the growth of not only their neighbour (base of stem about ≈10 cm away), but also plants beyond (base of stem about ≈20 cm away) the immediate neighbour (e.g. in the 75% of plants damaged treatment there is actually a series DDDUDDDUDDDU …) or potentially even further. This trend was also apparent, though not significant, in experiment 2, in the 100% leaf area removal treatment, but was not apparent in the 75% leaf area removal treatment, confirming the lower intensity of interference in the lower damage treatment. Increasing the severity of damage to individual plants in an uneven arrangement can, therefore, accentuate the interference effects between neighbours.
Though it is likely that the major factor affecting the altered growth of neighbours reported here is the effect of damage initially reducing the growth of damaged plants, it is also possible that responses may also be influenced by signals between plants such as plant volatiles (sensuBaldwin et al., Reference Baldwin, Halitschke, Paschold, von Dahl and Preston2006) and/or photomorphogenic responses to the ratio of red to far-red radiation reflected by neighbours (Ballaré & Casal, Reference Ballaré and Casal2000). Both of these mechanisms can provide plants with information about the condition of their neighbours, which may be especially significant if damage occurs before the onset of competition due to shading, as it could allow undamaged plants to ‘anticipate’ the probable reduced growth of neighbours and alter their competitive ability. The significance of ‘signalling’ may also be greater in interactions that extend beyond the immediate neighbouring plant. Assessment of the significance of signalling in the response of plants to the damage status of neighbours would be valuable in understanding how such responses are mediated.
Our results indicate that uneven vegetative damage results in an advantage to undamaged plants growing next to damaged plants. These plants (DUD) are bigger and yield more than similar plants in uniformly undamaged plots (UUU). Damage to terminals, also a form of vegetative damage, shows a similar result. Sadras (Reference Sadras1996b, Reference Sadras1997) showed that, in crops with non-uniform terminal damage, compensation involved strong plant-to-plant interactions. Plants with damaged terminals had reduced growth compared to neighbouring undamaged plants, e.g. (UDU), while plants with undamaged terminals (DUD) grew larger and matured more fruit than uniformly undamaged plants (UUU), similar to the effect of leaf damage reported here.
In contrast, non-uniform damage to reproductive structures tends to disadvantage undamaged plants (Sadras, Reference Sadras1997). Non-uniform fruit damage had no effect on the vegetative growth between neighbours, but significantly influenced reproductive growth. Undamaged plants with damaged neighbours (DUD) had significantly less fruit (34–56%) than undamaged plants with undamaged neighbours (UUU). Damaged plants with undamaged neighbours (UDU) recovered in total fruit numbers to levels similar to uniformly undamaged controls (UUU), but ran out of time to fill these fruit before the onset of cooler weather in autumn.
Does damage distribution need to be considered in experiments using real or simulated damage?
Treatments where the successive damage events were allocated randomly within the plots (experiment 3) showed that this tended to even out the neighbour effects, as a plant that escaped damage in one event had a chance that it would be damaged in a later event. Pests that remove leaf area and whose damage patterns would be essentially similar to the random treatments are those that tend to damage new plants over time, e.g. those pests whose eggs, and resulting larvae, are distributed unevenly and repeatedly across the crop over time, such as Lepidoptera (e.g. Helicoverpa spp., Spodoptera exigua (Hübner), S. litura (F.) and Anomis flava (F.)) and those that do not establish and feed on particular plants, such as the flea beetles (Nisotra submetallica Blackburn and Chaetocnema sp. Blackburn). Our results suggest that for these pests uniform damage experiments are probably adequate, though this conclusion should be regarded preliminary as the random treatments were not replicated across years. However, some confidence comes from the similar response between the two damage intensities investigated (partial or complete leaf area removal). It would be valuable to consider different damage distributions, especially the negative binomial as many pests show clumped distributions in cotton (Wilson & Room, Reference Wilson and Room1983).
In contrast, some pests such as thrips tend to establish and breed on a particular plant; the adults can move between plants but larvae tend to remain on the plant on which they were oviposited as eggs. Thrips damage is usually quite uneven, with some plants heavily damaged and others receiving relatively little damage (Wilson, unpublished data). Distributions of several crop pest thrips species, including Frankliniella fusca (Hinds) and F. occidentalis (Pergande) in field tomatoes, showed an aggregated distribution, supporting this assertion (Salguera-Navas et al., Reference Salguera-Navas, Funderburk, Mack, Beshear and Olson1994). However, in studies with simulated damage, uniform damage distribution is most commonly used (e.g. Brook et al., Reference Brook, Hearn and Kelly1992b), and with real pest damage small areas of crop are often artificially infested relatively uniformly with pests (e.g. Wilson, Reference Wilson, Sadras, Heimoana and Gibb2003). Estimating the effect of thrips damage on yield by uniformly damaging all plants or confining equal numbers of thrips to plants may lead to an underestimate of yield and, hence, of the crop's capacity to compensate for damage. This is because estimating the yields of the non-uniformly damaged treatments based on the yields of the plants in the uniformly damaged treatments underestimated actual yield by about 8%, and by up to 17% (experiment 3). If artificial pest infestation is used, the distributions of pests in infested plots should be compared with those found in natural infestations (see, for instance, Wilson (Reference Wilson1993) page 569) to establish how closely they match. In practice, using simple damage experiments where all plants are damaged similarly is easier and quicker but will result in more conservative plant damage thresholds (e.g. more likely to treat to prevent yield loss) than using experiments where damage distribution and intensity is designed to mimic that of a particular pest.
Our results show that consideration of plant-to-plant interactions is important in understanding the responses of crops to damage caused by herbivore feeding. However, the implications are wider and extend to any situation where the growth of a plant is altered in comparison to its neighbour. This could, for instance, include non-uniform distribution of insect vectored plant diseases, where infected plants may have poor growth compared with uninfected neighbours. It could also extend to abiotic damage, for instance the effect of hail, which may damage some plants and not others depending on hailstone size and the intensity of the storm. Further progress in this area would require investigation of plant responses to a range of damage types and distributions, aiming to closely mimic distributions of real pests, and interactions with years and damage intensity (Oesterheld & McNaughton, Reference Oesterheld and McNaughton1991; Sadras, Reference Sadras1995, Reference Sadras1996a). Nevertheless, our results show that damage experiments that result in uniformly distributed damage may risk underestimating the compensatory capacity of the crop by overlooking the neighbour interactions reported here.
Acknowledgements
We are indebted to Dee Hamilton, Kym Bush, Mark Laird, Mark Strahle and Lesley Burke for technical assistance under trying conditions; Greg Constable, Mary Whitehouse, Steve Yeates and Rose Roche (CSIRO) for valuable comments on earlier drafts of the manuscript; two anonymous reviewers for valuable suggestions; and the Cotton Research and Development Corporation, Narrabri, Australia for largely funding this research.