Introduction
The original distribution of Lycorma delicatula White (Hemiptera: Fulgoridae) was in northern China, in the Shanxi, Shandong, and Hubei provinces (Liu, Reference Liu1939). L. delicatula was first detected as a non-indigenous species in the mid-western region of South Korea in 2004 (Kim & Kim, Reference Kim and Kim2005). L. delicatula has spread from this region and become abundant across South Korea (Han et al., Reference Han, Kim, Lim, Lee, Kwon and Cho2008), where it causes crop damage, particularly in vineyards. The geographical expansion of L. delicatula has continued to the eastern region of South Korea, but it remains unclear where the initial introduction occurred and what is the source location of spread to other regions. Range expansion by L. delicatula is speculated to have been asymmetric from west to east, which may be the result of geographical barriers including the mountain range dividing the western and eastern regions of South Korea.
The first instar nymphs of L. delicatula appear in May; these molt four times, becoming adults in late July. Mating, ovipositing, and the death of adults occur prior to winter, and the eggs overwinter (Park et al., Reference Park, Kim, Lee, Shin, Kim and Park2009). Successful establishment of this species is thought to be associated with its overwintering abilities and a recent increase in Korean winter temperatures (Lee et al., Reference Lee, Kim, Koh, Cho, Jang, Pyo and Choi2011). As the range of L. delicatula increased rapidly within South Korea, it is thought that movement occurs by both short-range expansion into adjacent areas and also by long-distance dispersal among distant sites, reflecting a stratified dispersal pattern. Short-distance dispersal of L. delicatula may be related to different host plant preferences between nymphs and adults. The host plant preferences of L. delicatula change during its growth cycle, with a broad range of host plants being fed upon during the nymph stages, but only a few plant species, including Ailanthus altissima, acting as food sources in the adult stage (Kim et al., Reference Kim, Lee, Seo and Kim2011). Therefore, the short-range dispersal behavior of L. delicatula may be influenced by the spatial distribution of available host plants. However, its long-distance dispersal ability and the pattern of L. delicatula range expansion remain unknown. Knowledge of the rate of range expansion and the mode of dispersal is required to enable mitigation and pest control strategies to be devised.
Molecular genetic markers enable estimation of the genetic diversity, movement of individuals (Kim et al., Reference Kim, Ratcliffe, French and Sappington2008), inbreeding, and historical patterns of dispersal (Miller et al., Reference Miller, Estoup, Toepfer, Bourguet, Lapchin, Derridj, Kim, Reynaud, Furlan and Guillemaud2005). Investigations of population demography using molecular genetic marker data have been facilitated by the development of cost-effective methods of data acquisition, as well as the development of statistical approaches that have improved the capacity to estimate the proportion of a population that has moved various distances (Hastings et al., Reference Hastings, Cuddington, Davies, Dugaw, Elmendorf, Freestone, Harrison, Holland, Lambrinos, Malvadkar, Melbourne, Moore, Taylor and Thomson2005). Multilocus genotyping techniques using microsatellite markers have proven to be useful tools for understanding the biology of invasive species. Using microsatellite markers to estimate gene flow is a powerful alternative population assignment technique that has the potential to complement direct methods for measuring contemporary migration (Kim & Sappington, Reference Kim and Sappington2006). Using analogous methods, we conducted a population genetics study of L. delicatula in South Korea, analyzing microsatellite marker data to estimate gene flow and genetic structuring.
Material and methods
Study insect and sample collection
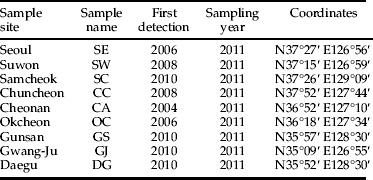
L. delicatula was collected in 2011 from nine locations throughout their current distributional range in Korea, including the initial occurrence locations (table 1, fig. 1). The sedentary behavior of L. delicatula nymphs on host plants enabled collection of one individual L. delicatula specimen from each host plant, Vitis vinifera L. (Vitaceae) or A. altissima Swingle. Sampled plants were at least 5 m apart to avoid collection of full siblings. The collected specimens were placed in 95% ethanol and stored at –20 °C until DNA extraction was performed.

Fig. 1. Sampling locations for L. delicatula in South Korea, 2011. The pie graphs show the results of a Bayesian cluster analysis of multilocus microsatellite genotypes. Each location is partitioned into K=3 components.
Table 1. Sampling information for L. delicatula specimens collected in South Korea during 2011.

Microsatellite genotyping
DNA was extracted from the stored L. delicatula specimens using the Qiagen DNeasy Blood and Tissue Kit (Qiagen, Valencia, CA, USA), and the eluted DNA template was diluted tenfold with deionized water. Seven microsatellite loci previously developed for L. delicatula by Park et al. (Reference Park, Kim and Lee2012) were used for genotyping. Multiplex polymerase chain reaction (PCR) was conducted in two separate reactions: (i) for markers LD-D4, LD-D5, LD-T1, and LD-T3; and (ii) for markers LD-D1, LD-D2, and LD-T2. For these reactions, we used the i-star Taq PCR Kit (Qiagen) in a total volume of 10 μl, which contained 5.55 μl distilled water, 1.0 μl 10×buffer, 0.8 μl dNTPs, 0.2 μl of each primer, 0.05 Taq, and 1 μl template DNA. The PCR profiles followed a ‘touchdown’ protocol (Don et al., Reference Don, Cox, Wainwright, Baker and Mattick1991), whereby an initial denaturation of 15 min at 95 °C was followed by seven cycles of PCR, each consisting of 30 s denaturation at 94 °C, 90 s annealing at 67 °C, 60 s extension at 72 °C, and a 0.5 °C decrease per cycle. A total of 25 cycles were then run with 1 min denaturation at 60 °C.
Statistical analysis
Genetic variation and genetic structure
Micro-Checker (Van Oosterhout et al., Reference Van Oosterhout, Hutchinson, Wills and Shipley2004) was used to evaluate potential scoring errors resulting from stuttering, large allele drop-out, and null alleles in the L. delicatula microsatellite genotypes. The mean number of alleles per locus and the observed (H O) and expected (H E) heterozygosities were calculated using the Microsatellite Toolkit (Park, Reference Park2001). Multiple comparisons were made after applying the sequential Bonferroni correction (Rice, Reference Rice1989). The Genepop program (Raymond & Rousset, Reference Raymond and Rousset1995) was used to test deviations from Hardy–Weinberg equilibrium (HWE) conditions.
The program Structure v. 2.3.1 (Pritchard et al., Reference Pritchard, Stephens and Donnelly2000) was used to estimate the most likely number of clusters for the datasets by determining the change in the marginal likelihood of the data Pr (X/K), where K was fixed at different values. The range of possible clusters (K) tested was set from 1 to 10, with five iterations. The lengths of the Markov Chain Monte Carlo (MCMC) iteration and burn-in were set at 100,000 and 200,000, respectively. We used an ancestry model allowing for admixture and correlated allele frequency among populations. The K-value was estimated using the maximal value of the log-likelihood [ln Pr (X/K)] of the posterior probability of the data for a given K (Pritchard et al., Reference Pritchard, Stephens and Donnelly2000). The second-order rate of change in the log probability of the data between successive values of ΔK (the ‘true’ number of K within the L. delicatula sample dataset) was also calculated using ΔK=m |L″(K)|/s[L(K)] (Evanno et al., Reference Evanno, Regnaut and Goudet2005).
We carried out a principal coordinate analysis (PCoA) using the Genalex program (Peakall & Smouse, Reference Peakall and Smouse2006). A scatter diagram was plotted based on factor scores along the two PCo axes accounting for most variation.
Gene flow measures
Indirect estimates of the historical rates of gene flow between populations (N em) were calculated according to the relationship N em=(1−F ST)/4F ST (Wright, Reference Wright1931), where N em is the effective number of migrants per generation, N e is the effective population size, and m is the migrant rate. Pairwise estimates of the genetic differentiation (F ST) between populations were made using FSTAT v. 2.9.3 (Goudet, Reference Goudet2001). As Micro-Checker revealed the potential occurrence of null alleles on at least one locus for each population (see table 2), the FreeNA program (Chapuis & Estoup, Reference Chapuis and Estoup2007) was used to estimate F ST, which was adjusted for null alleles (excluding null alleles), and the result was compared with that of F ST assuming no null alleles.
Table 2. Genetic variability estimates for each L. delicatula population, inferred from seven microsatellite loci. Number of alleles, expected heterozygosity (H E) at HWE, observed heterozygosity (H O), inbreeding coefficient (F IS), probability (P-value) of being in HWE, and loci showing potential null alleles.

1 Hardy–Weinberg exact test (Raymond & Rousset, Reference Raymond and Rousset1995) with Bonferroni correction (P=0.00079).
Isolation by distance (IBD) was tested by regressing pairwise population estimates of linearized F ST/(1−F ST) (Rousset, Reference Rousset2000) on the natural log of the geographical distance between all pairs of sample locations, using the Mantel test implemented with Genalex software. Hierarchical partitioning of genetic variation was assessed using analysis of molecular variance (AMOVA) for populations and individuals. AMOVA provides an estimate of the proportion of genetic variation within and between populations.
Population assignment/exclusion tests were conducted by direct and simulation methods using the Geneclass2 program (Piry et al., Reference Piry, Alapetite, Cornuet, Paetkau, Baudouin and Esop2004) to detect genetic signatures of dispersal and immigration (Rannala & Mountain, Reference Rannala and Mountain1997). The direct assignment test allocates an individual to one of the reference populations without probability computation. The test calculates the proportion of individuals correctly assigned to the most likely population of origin, even though the true population of origin is not among the reference populations. In contrast, the exclusion method uses a simulation approach in which the likelihood of a genotype occurring in the population is computed by simulating multilocus genotypes based on the allele frequencies of each reference population. In this method, the likelihood of the genotype of an individual is compared with the distribution of likelihoods of simulated genotypes for each reference population. If the genotype likelihood (a) of an individual is below a predetermined threshold (e.g. a=0.01), the population is excluded as a possible origin of the individual (Cornuet et al., Reference Cornuet, Piry, Luikart, Estoup and Solignac1999). Unlike the direct assignment method, the exclusion method does not assume that the true population of origin has been sampled because each population is treated independently (Cornuet et al., Reference Cornuet, Piry, Luikart, Estoup and Solignac1999). Frequency probabilities of multilocus genotypes in each reference population were determined in the exclusion test using Monte Carlo simulations of 10,000 independent individuals for the population (Paetkau et al., Reference Paetkau, Slade, Burden and Estoup2004). We followed a Bayesian statistical approach (Rannala & Mountain, Reference Rannala and Mountain1997) using the Monte Carlo resampling method (Paetkau et al., Reference Paetkau, Slade, Burden and Estoup2004).
To infer contemporary migration of individuals between populations, we employed the detection of first-generation migrants criterion implemented in Geneclass2 (Piry et al., Reference Piry, Alapetite, Cornuet, Paetkau, Baudouin and Esop2004), which assigns each potential individual that traveled from Site A to Site B in year X, or individuals born in year X to a gravid female that moved from Site A to Site B in year X – 1. As we do not know whether all source populations for immigrants were sampled in the current study, two test statistics (L home and the ratio L home/L max) were used to compute the likelihood of migrant detection (L) (Paetkau et al., Reference Paetkau, Slade, Burden and Estoup2004). The analysis was conducted using a simulation of 10,000 independent individuals at thresholds of a=0.05 and a=0.01. As the method of Paetkau et al. (Reference Paetkau, Slade, Burden and Estoup2004) is intended to measure real-time migration between populations, it assumes that all populations are sampled in the same year.
Bottleneck tests
The Bottleneck (Cornuet & Luikart, Reference Cornuet and Luikart1996) program was used to assess the evidence for past bottlenecks. We used both a strict stepwise mutation model (SMM) (Ohta & Kimura, Reference Ohta and Kimura1973) and a two-phase model (TPM) (Di Rienzo et al., Reference Di Rienzo, Peterson, Garza, Valdes, Slatkin and Freimer1994). The bottleneck test analyzed the heterozygosity excess by comparing the observed number of alleles at each locus, assuming mutation–drift equilibrium. Estimated values were determined using a TPM (Piry et al., Reference Piry, Luikart and Cornuet1999) with an 80% single-step mutation proportion, a variance among multiple steps of 12 and 5000 iterations. The probability of significant heterozygosity excess was determined using the Wilcoxon signed-rank test. We also used a model shift in allele frequency distribution as a qualitative indicator of population bottlenecks (Luikart et al., Reference Luikart, Allendorf, Cornuet and Sherwin1998). The M-ratio of Garza & Williamson (Reference Garza and Williamson2001), which is the mean ratio of the number of alleles to the range of allele size, was calculated using the AGARST program (Harley, Reference Harley2001). The M-ratio has a long recovery time following a decline in population size (e.g. >100 generations), and so enables recent population reductions to be distinguished from those occurring a long time ago. Garza & Williamson (Reference Garza and Williamson2001) suggested that the M-value and its variance across loci could be used as an alternative test for detecting reductions in population size over a much longer time frame.
Results
Genetic variability
A total of 86 alleles were detected across seven microsatellite loci for 260 L. delicatula individuals from among the nine locations in South Korea. Scoring errors resulting from large allele dropout were not detected in any L. delicatula population or locus, but Micro-Checker identified possible stuttering for the marker LD-D4 in population DG and marker LD-T2 in population GS. The presence of potential null alleles was indicated by a general excess of homozygotes for most allele size classes for one or two loci within at least one population (table 2). The genetic variability estimates for each L. delicatula population deduced from the seven microsatellite loci included allelic diversity, the observed (H o) and expected (H E) heterozygosity, the inbreeding coefficient (F IS), and the P-values for deviations from the HWE. Allelic richness varied from 4.904 to 6.709, and H E ranged from 0.654 to 0.757. Six of nine populations exhibited a significant deviation from HWE following sequential Bonferroni correction for multiple testing. These six populations had positive F IS values across loci with an excess of observed homozygotes (table 2).
Genetic structure within and among populations
The genetic differentiation between each pair of populations (uncorrected and corrected pairwise F ST) and the effective number of migrants exchanged per generation (N em) are shown in table 3. Uncorrected estimates of pairwise F ST values ranged from −0.0008 for the SW and OC populations (ENA corrected F ST=0.0009; SE and OC populations) to 0.1294 for the SC and CA populations (ENA corrected F ST=0.1365; CA and SC populations). Both estimates of F ST (F ST adjusted for null alleles and F ST assuming no null allele results) were similar. Global estimates of F ST across all loci and all populations were low but significant (uncorrected F ST=0.0474, 95% CI=0.0327–0.0634; ENA corrected F ST=0.0477, 95% CI=0.0338–0.0631). The N em calculated from the uncorrected F ST ranged from 1.68 (CA and SC) to infinity (OC and SW, SE and OC), implying an intermediate to very high level of gene flow.
Table 3. Pairwise estimates of genetic differentiation (F ST) (below the diagonal) between L. delicatula populations, and gene flow (N em=(1−F ST)/4F ST) inferred from each estimate (above diagonal).

1 Probability of being different from zero following correction for multiple comparisons. *P<0.05; NS, not significant. The adjusted nominal level (5%) for multiple comparisons was 0.001389.
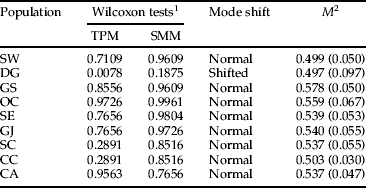
The M-ratio values, which are used to detect long-term bottleneck events, were generally low in all populations, ranging from 0.497 to 0.578 (table 4). The results indicated a significant bottleneck event for all populations of L. delicatula as recently invading species. However, deviation from mutation–drift equilibrium (under the TPM model) and mode shift revealed a signature of recent population reduction only for the DG population (P=0.0078).
Table 4. M-ratio test results using the SMM (Ohta & Kimura, Reference Ohta and Kimura1973) and the TPM (Di Rienzo et al., Reference Di Rienzo, Peterson, Garza, Valdes, Slatkin and Freimer1994) to detect a recent population bottleneck event within each L. delicatula population. Significance tested using the Wilcoxon sum-rank test (α=0.05).
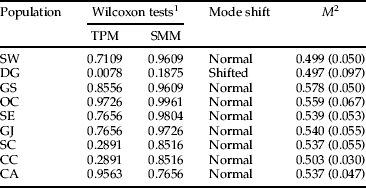
1 One-tail probability for an excess or deficit of observed heterozygosity relative to the expected equilibrium heterozygosity, computed from the observed number of alleles under mutation–drift equilibrium.
2 M=mean ratio of the number of alleles to the range of allele size (Garza & Williamson, Reference Garza and Williamson2001); variance in parentheses.
SMM, stepwise mutation model; TPM, two-phase model of mutation.
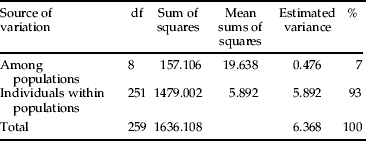
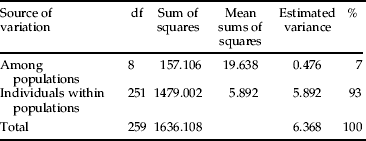
AMOVA analysis among the L. delicatula samples revealed that most of the genetic variation was partitioned to among populations and individuals within populations. More than 93% of the total genetic variation was accounted for by individuals within a population and, correspondingly, 7% of the total genetic variation was among populations (table 5). No significant correlation was found between genetic and geographical distances among the populations, as evidenced by the Mantel tests of IBD over all samples (R 2=0.049, P=0.260), indicating recent range expansion and/or frequent gene flow among populations in South Korea (fig. 2).

Fig. 2. Geographical distance versus genetic distance (F ST/1−F ST) for populations of L. delicatula, using pairwise F ST. Correlations and probabilities were estimated from a Mantel test with 10,000 bootstrap repeats.
Table 5. AMOVA among L. delicatula samples from nine locations in South Korea.
In the PCoA, the mean factor scores for the nine populations were plotted along the first two principal component axes, which together accounted for 72% of the total variance (40.2% for axis 1 and 31.97% for axis 2; fig. 3). This analysis showed conspicuous divergence of the SC and CA populations from the other populations in South Korea.

Fig. 3. Scatter diagram of factor scores from a PCoA of genotype data for seven microsatellite loci in samples of L. delicatula collected from nine locations in South Korea (see fig. 1). The percentage of total variation attributed to each axis is indicated.

Fig. 4. Bar plot of population structure estimates for 260 L. delicatula specimens collected from nine locations in Korea, generated by structure. The maximum value among genotypes was 23.41 at ΔK=3, using ΔK=m|L″(K)|/s[L(K)] (Evanno et al., Reference Evanno, Regnaut and Goudet2005).
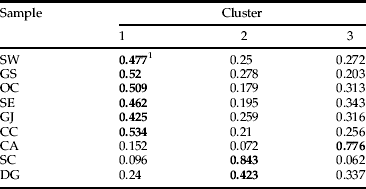
Bayesian clustering revealed three clusters. The value of ΔK calculated from ln P(D) of the structure output revealed a maximum value of 23.41 for K=3 among the genotypes (fig. 4). The average distances among individuals in the same cluster were 0.38 for cluster 1, 0.30 for cluster 2, and 0.32 for cluster 3; the variance in the mean individual membership within each cluster was accounted for by between-sample site differences (fig. 1, table 6). This showed that co-ancestry of genotypes provides evidence for three distinct populations (fig. 4): (i) one encompassing most of Korea (populations SE, SW, GJ, GS, DG, and OC); (ii) population CA; and (iii) population SC. Population CA has a genetic structure that differs from that of the other western population.

Fig. 5. Dispersal pathway of L. delicatula populations in South Korea. The arrows indicate the probable source and recipient populations of first generation migrants detected using the L home/L max statistic.
Table 6. Average coefficient of ancestry obtained from a structure analysis with K=3 for 260 L. delicatula specimens collected from nine sampling locations in South Korea.
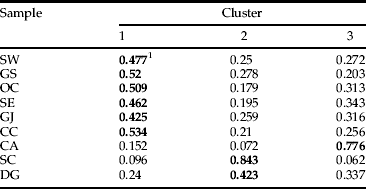
1 The highest value of co-ancestry for each population in a cluster is shown in bold.
Assignment/exclusion test and detection of first-generation migrants
We calculated the percentage of L. delicatula individuals sampled from each population and excluded as potential immigrants at a threshold of a=0.01, and the mean assignment log-likelihood for each possible donor population (table 7). Populations from most locations contained members whose potential origins in other populations could be excluded with ≥99% certainty. Individuals from the SC population could be assigned to their own population with >90% certainty, and individuals from DG and CA populations were assigned to their own population with 74.1% and 65.5% certainty, respectively. In the exclusion test, the SC population could be excluded with 34.5–75.9% certainty (0.01 threshold) as a putative origin of all populations. The assignment and exclusion values were evenly distributed among the other populations. The mean estimated individual assignment likelihood indicated that the highest assignment likelihood of individuals of the OC population (apart from itself) come from the SW population (mean assignment log-likelihood=–7.68). Similarly, the highest assignment likelihood of SW individuals was from the OC population (–8.20) (table 7).
Table 7. Percentage of L. delicatula individuals assigned to and excluded from (i.e. determined to not be a potential immigrant from) each reference population and the mean assignment log-likelihood for individuals from each geographic population to possible source populations.

1 The assignment test was carried out using the direct approach without probability computation and the exclusion test was carried out using the simulation method (Cornuet et al., Reference Cornuet, Piry, Luikart, Estoup and Solignac1999). Both tests used the Bayesian statistical approach described by Rannala & Mountain (Reference Rannala and Mountain1997). The simulation method developed by Paetkau et al. (Reference Paetkau, Slade, Burden and Estoup2004) was used in the exclusion test.
2 The number of individuals assigned to the most likely population is shown in parentheses.
3 The number of individuals excluded from the reference population for a=0.01 is shown in parentheses.
4 Mean assignment−log likelihood (L) value for individuals from a given sample population. Bold value indicates the value most similar to that of the sample population, and therefore represents the population from which it most likely originated, under the assumptions of the test.
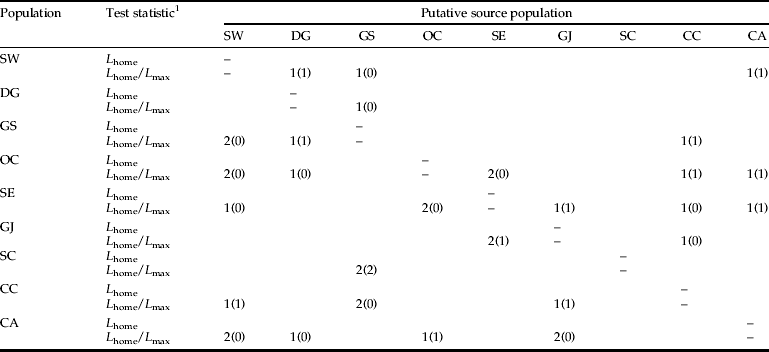
The number of immigrant individuals estimated for the current generation is summarized in table 8. When the L home/L max ratio was considered for the detection of first-generation migrants between sample locations, a total of 36 and 14 individuals were detected as probable first-generation migrants at thresholds of a=0.05 and a=0.01, respectively. This result suggests that the OC population received individuals from each of the SE, CC, and CA populations. The proposed dispersal pathway among populations is shown in fig. 5, based on the result of ‘detection of first-generation migrants’. The results indicate that there was movement of L. delicatula to adjacent locations and, unexpectedly, that long-distance dispersal beyond the geographical barrier also occurred.
Table 8. Number of probable first-generation migrants identified in each population of L. delicatula and its putative source population at thresholds of a=0.05 and a=0.01 (in parentheses).
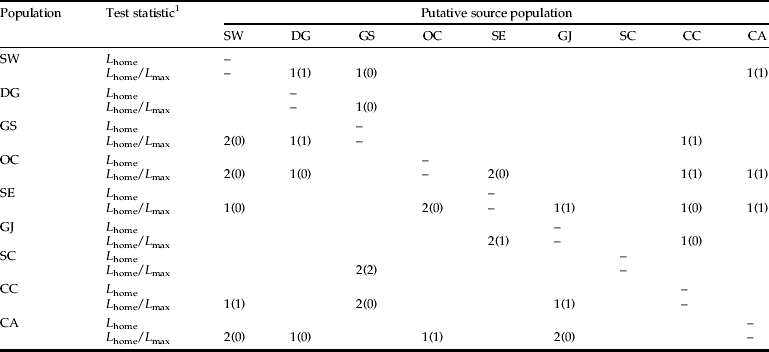
The analysis used the assignment criterion described by Rannala & Mountain (Reference Rannala and Mountain1997) and the Monte Carlo resampling method reported by Paetkau et al. (Reference Paetkau, Slade, Burden and Estoup2004).
1 L=likelihood of migrant detection (Paetkau et al., Reference Paetkau, Slade, Burden and Estoup2004).
Discussion
Evidence from this study suggests that there is no significant difference in genetic diversity, allelic richness, or H E among the L. delicatula populations in South Korea. In contrast, a low but significant level of genetic differentiation, based upon F ST estimates, was observed among the populations. A general trend of low level but significant population differentiation has previously been reported among populations of the Chinese mitten crab that have recently established in Europe (Herborg et al., Reference Herborg, Weetman, Van Oosterhout and Hänfling2007). Inbreeding coefficients (F IS) indicate a significant difference between observed and expected heterozygosity as a consequence of non-random mating, the presence of a null allele, and/or the Wahlund effect (Wahlund, Reference Wahlund1928). Analogously, a non-significant IBD relationship is expected among populations recently introduced to South Korea (such as L. delicatula), which show little evidence of genetic divergence. The absence of IBD is indicative of a recent range expansion/high gene flow, or a lack of gene flow coinciding with extensive genetic differentiation among all populations. The latter can be excluded as a possible explanation in relation to the South Korean L. delicatula populations, as low levels of genetic differentiation were estimated among the sample populations (table 3). These analyses further suggest that the L. delicatula populations in South Korea have not reached equilibrium since colonization.
Although the IBD test has been widely used to investigate the spatial patterns of gene flow and genetic relatedness between populations (Wright, Reference Wright1943), the presence of geographical barriers to dispersal can also limit gene flow. McRae (Reference McRae2006) suggested that the resistance distance of the two-dimensional geographical distances might be a more realistic reflection of the underlying barriers to dispersal, and that geographical distances that integrate heterogeneities in dispersal pathways might be more relevant. For heterogeneous landscapes, use of the resistance distance may help to reveal patterns of IBD that are absent from Euclidean distance estimates. For the spread stage of invading populations, the major outstanding study aspects include linking the traits of species to their movement ability and exploring the impacts of landscape heterogeneity on dispersal success (Puth & Post, Reference Puth and Post2005). Consequently, to gain a greater understanding of gene flow among populations of L. delicatula, our future studies (both laboratory and field) will focus on the dispersal abilities of the species.
The genetic structure analysis, based on PCoA and structure, indicated that three genetically divergent L. delicatula populations are present in South Korea. The results suggest that simultaneous establishment, rather than point or independent introduction, probably occurred in western South Korea, and that the subsequent outbreak can in part be attributed to colonization of the eastern region (populations SC and DG). It is possible that two temporally separated incursions of L. delicatula into the eastern regions occurred. While the CA population (which has an apparently different genetic structure) may have been introduced independently, additional studies are needed to clarify the mode of introduction; such studies should include samples from eastern China.
Assessing bottlenecks is important in determining founder effects underpinning demographical events, especially recent species invasions. Microsatellites are particularly informative in the study of recent population phenomena. A combination of approaches was applied to L. delicatula, based on a range of microsatellite characteristics. The M-values for the studied populations were less than those expected from historically stable populations (0.82), and also below the M-ratio range (0.599–0.693) for populations that have undergone a historical reduction in population size or recently founding population (Garza & Williamson, Reference Garza and Williamson2001). Although the M-ratio for a stable population of L. delicatula needs to be established, the results indicate that in Korea this species was subject to a bottleneck event at some time in the past, as is expected for invasive species. Our mutation–drift equilibrium (under the TPM model) and mode-shift analyses indicated that a bottleneck occurred in the DG population. More reliable demographic evidence will require investigations of longer time scales of biological invasion, because short-term population structures may provide only weak and/or incorrect indications of demographic events associated with invasion processes (Fitzpatrick et al., Reference Fitzpatrick, Fordyce, Neimiller and Reynolds2012).
Although gene flow can serve as a surrogate for dispersal ability (Bohonak, Reference Bohonak1999), it has limitations when movement cannot be verified because of insufficient genetic information. Moreover, high gene flow yields within open landscapes can produce populations that are genetically homogenous over great geographical distances (fig. 2). Our assignment/exclusion tests showed similarity of the –log (L) estimates (excluding the highest values) in the potential source population (table 7), suggesting that the majority of L. delicatula sampled in this study were not representative of the initial outbreak source population in South Korea. In a previous study, the possible source population of the introduced insect species Ostrinia nubilalis in North America was investigated by sampling each geographic population and assessing the qualitative information on gene flow (Kim et al., Reference Kim, Bagley, Coates, Hellmich and Sappington2009). However, there were limitations in the method used, as the source population could not be identified because of the high rates of dispersal among populations in the range expansion phase.
First-generation migrant detection can enable inferences to be made regarding the point origin of individuals, and provides the potential to estimate real-time dispersal through detection of immigrant individuals (Rannala & Mountain, Reference Rannala and Mountain1997; Paetkau et al., Reference Paetkau, Slade, Burden and Estoup2004). The probable source and recipient populations of first-generation L. delicatula migrants were investigated using the L home/L max statistic, which revealed that dispersal probably occurred over long distances as well as among adjacent locations (fig. 5). It is notable that more frequent dispersal may occur in the western region compared with the eastern region, and that long-distance dispersal may be occurring beyond the mountain range.
Since its first appearance in Cheonan (western Korea) in 2004, the distribution of L. delicatula has expanded across South Korea in only 5–7 years. In this study, we applied a combination of population genetics analyses to study the invasion dynamics. The presence of a mountain range appears to have caused only a minor delay in the dispersal of L. delicatula from west to east across the country. The dispersal patterns may have influenced the invasion dynamics with naturogenic deceleration (heterogeneous topography) and anthropogenic acceleration (human activity and ground transportation) of gene flow during the spread phase of L. delicatula in South Korea.
Understanding of the invasion process and dispersal pathways is important in the development of effective quarantine measures and for improving biosecurity in relation to invasive insect pests. Genetics should play a greater role in the development of policy to manage and control invasive species because it is important in understanding the invasion process and developing defense mechanisms against invading pests (Allendorf & Lundquist, Reference Allendorf and Lundquist2003). Our study indicates that the Korean Peninsula is susceptible to invasive by insects from adjacent countries. Following species invasions, subsequent establishment and spread within South Korea can occur if conducive climatic and ecological conditions are present. For example, the rice water weevil Lissorhoptrus oryzophilus Kuschel spread throughout the paddy fields of Korea in a relatively short time period. Rapid dispersal was possible because the host plant is widely distributed, and long-distance dispersal was facilitated by ground transport and human activity in Korea (Lee & Uhm, Reference Lee, Uhm and Hirai1993). This example underscores the importance of a specific framework for preventing the range expansion of invasive pests, based on knowledge of the invasion dynamics in the heterogeneous landscape of Korea.
Invasion is often cryptic in terrestrial habitats during the initial phase of introduction, and detection of pests typically occurs during the dispersal stages, when the species begins to damage native biota. Generalizations about the dynamics of establishment and spread of invasive species are difficult, and consequently assessment of population structure and movement are fundamental to understanding the potential effects of pest introductions within specific regions. Temporal analysis of the structure of L. delicatula populations is needed to clarify the expansion dynamics of this invasive species.
Acknowledgements
We thank Dr Brad Cotes for his useful comments on the manuscript. This research was funded by grants from the Rural Development Administration (project no. PJ007157) and by the Brain Korea 21 project.


