


Introduction
One of the most often utilised local, state and national economic development policies is the allocation of incentives to attract new investment, retain firms or help facilitate the expansion of existing companies. These incentives come in many different forms, including tax holidays, worker retraining grants, subsidised loans and infrastructure improvements. However, these different incentive types share two common features. First, they are targeted to specific firms, either through policy discretion or detailed eligibility criteria, and, second, they are controversial in terms of both their effects and costs.
Although many countries limit the use of incentives through national legislation,Footnote 1 the United States (US) is an outlier because the majority of incentives in the US come from cities and states competing with each other (rather than other countries) for investment, with few restrictions from the federal government. This competition across cities and states has led to scathing exposés such as the “Kansas City economic border war” series in the New York Times (Bishop Reference Bishop2012). In fact, the Kansas City metropolitan region, which straddles the Missouri–Kansas border, has become a symbol of the problems with incentive competition within the US. On the other side of the debate are various economic development agencies stressing the importance of incentives in increasing the competiveness of locations for domestic and international firms.
Given the thousands of incentives allocated to firms each year, it is easy to find positive or negative examples of incentives. For instance, some incentives can be credited with capturing investment or facilitating an expansion that generates direct local jobs and tax revenues, which have broader positive spillover effects for the community. More common, however, are criticisms of incentive programmes that point to the inefficiency and ineffectiveness of incentives as a job-creation strategy. What is the overall impact of incentives on job creation? I review this literature in the next section.
In this article, I explore a representative state incentive programme, the Promoting Employment Across Kansas (PEAK) programme. Examining this programme has a number of advantages. First, Kansas, on many dimensions, is a typical US state. Specifically, Forbes places Kansas in the middle (25th) in terms of ranking its business environment (Forbes 2015), and the Tax Foundation places Kansas as 22nd in terms of the state’s business tax climate (Tax Foundation Reference Walker and Greenstreet2015). Second, the PEAK programme shares many features with other state incentive programmes. As documented by Mattera et al. (Reference Mattera, Cafcas, McIlvaine, Seifter and Tarczynska2012a), 16 states now offer over 2,900 similar incentive programmes that subsidise investment through the use of payroll tax rebates.Footnote 2 Furthermore, similar to other US state incentive programmes, the state of Kansas monitors firm compliance with the incentives’ conditions and has the ability to “claw back” incentives from non-performing firms.Footnote 3
Although the PEAK programme is comparable with other incentive programmes, another major advantage of this study is its high level of internal validity. Using data on all company establishments in Kansas across a range of industries, it is possible to examine what is essentially the complete universe of companies in Kansas and compare this universe of cases with the firms that received the incentives. Using matching techniques, I generate a control group for each firm receiving a PEAK incentive. I then compare employment generation between the two groups. On the basis of this analysis, the main finding is that there is no statistically significant difference in the employment creation of firms in the PEAK programme relative to the firms that did not receive the PEAK incentives.
This finding points to the ineffectiveness of the PEAK programme in generating employment. However, it is important to note that the empirical research design requires us to assume that we can generate a control group based on observable factors and use this control group to create a counterfactual on how many jobs would have been created in the absence of this programme. Unfortunately, there are limits to what an observational study can uncover in terms of how an incentive programme shaped managerial investment and expansion decisions.Footnote 4
One way to more directly address this counterfactual is to directly ask managers about the impact of this programme on their decisions. Thus, one unique aspect of this study is that to complement the matching results I utilised Freedom of Information Act (FOIA) requests to identify the individuals in each of the PEAK-recipient companies that formally applied for PEAK incentives. I then fielded an internet survey in October 2014 that asked the individual PEAK applicants about their involvement in the PEAK programme as well as their alternative options.Footnote 5 The survey included a counterfactual question on what the respondent’s firm would have done if it had not received a PEAK incentive. In short, this survey asked firms to report, among other things, their expected job creation in the absence of the PEAK programme.
The results from this survey, outlined in the fifth section, are consistent with the findings from the matching analysis. Most respondents indicated that the programme was efficient, more generous than the programmes of competing locations and worth recommending to other firms. Despite these clear benefits of the programme to individual firms, the majority of respondents indicated that these incentives had no effect on their behaviour.
Interpreting these findings requires a measure of modesty. I rely on matching techniques and managerial self-reports on how effective incentives were in generating employment. As documented in the research design section of this article, this method generates a bias towards finding a positive impact of incentives on job creation. Thus, the weak relationship between incentives and employment, despite this bias, has important implications for our evaluation of these programmes.
Another limitation is that this study focusses on a single programme. This case study is representative of other state economic development programmes, but it is impossible to make a direct comparison across states. Even though the statutory programme may be similar, the implementation and oversight of the programmes could vary across countries. Thus, this is a representative case study of economic development incentive, but further study is required before we make blanket claims about the ineffectiveness of economic development programmes.
However, the findings from this single case study identify a potential tension in the use of these incentive programmes by governments. More specifically, although incentives can be used to increase employment and further expand businesses, the evidence suggests that recipients perform no better than non-recipients, at least in terms of job creation. My survey evidence also points to participation in this programme as a strategy for obtaining government subsidies for expansions or relocations that were planned to happen already with or without this government support.
In the next section, I briefly discuss the existing rationale for market interventions to facilitate job creation. Although the literature on this topic is enormous, a few themes emerge that are worth noting. Then, in the third and fourth sections, I introduce the Kansas PEAK programme as well as the use of matching methods to explore how incentives shape firm employment decisions. The fifth section details the results from the PEAK programme firm-level survey, and the sixth section provides some concluding remarks.
Incentives as an economic development strategy
From a public policy perspective, few topics are as important, and politically salient, as the creation of high-quality jobs, and therefore local, state and national governments use public policy to encourage job creation. Perhaps the most common of these strategies is the use of incentives to attract and retain companies – for instance, a survey of US municipalities found that 95% of respondents indicated that they utilised some form of incentive to attract firms. Although every US state has a menu of incentives to offer firms (Jensen et al. Reference Jensen, Malesky and Walsh2015), many of these states have shifted towards offering fewer but much larger “megadeal” incentives (Mattera et al. 2013). In general, firms considering relocation or expansion have a menu of options available that vary by location.
With this in mind, can government policies be used to stimulate job creation?Footnote 6 A vast literature on industrial policy has debated this question by differentiating between “horizontal industrial policy”, which aims to create a business-friendly environment in general, and “vertical industrial policy”, which aims to target individual sectors or firms (Gual Reference Gual1995; Lazzarini 2015). Financial incentives are perhaps the most extreme case of vertical industrial policy, where government agencies allocate resources to firms either through a formula that makes certain firms more qualified than others or through policy discretion.
Politicians have numerous public policy levers that can affect investment decisions, but few are as immediate and as targeted to individual firms as investment incentives. As mentioned above, incentives can come in a variety of forms – for example, governments often provide tax abatements against future profits, which essentially incentivise companies to capture a larger share of future profits while presenting no immediate costs to the government. At the other extreme, governments can offer low-interest loans or grants to firms, essentially subsidising a relocation or expansion through the use of public money. Although the variety of these incentives changes every year, what is central about them is that politicians target the policies towards an individual firm.
The existing literature has provided a rationale about how targeted incentives can facilitate economic growth (Klein and Moretti Reference Klemm and Van Parys2013). Specifically, proponents of incentives often argue that the attraction of even a single major firm can serve as a catalyst for local economic development, having positive impacts on wages, property values and ultimately tax revenue in the area (Greenstone and Moretti Reference Greenstone and Moretti2003). If a small incentive can swing the decision of a large firm, the benefits of these incentives will far outweigh their costs.
The targeting of individual firms allows policymakers to both price discriminate between firms that are on the fence about whether to invest and target firms that will have the biggest impact on the community. For example, imagine two firms. One firm will create 10 jobs but have few other spillover effects in the Kansas City area. A second firm will create 10 direct jobs, and by sourcing from suppliers and using local distributors that firm also will create an additional 10 jobs indirectly. Although both firms have the same payroll and sales, the second firm is much more valuable to the region.
Unfortunately, despite the clear theoretical motivations, global research on incentive programmes has found little empirical support for the effectiveness of these programmes,Footnote 7 including evidence from individual countries as diverse as Brazil (Rodríguez-Pose and Arbix 2001), Indonesia (Wells et al. Reference Zee, Stotsly and Ley2001) and Italy (Bronzini and de Blasio Reference Bronzini and Guido de Blasio2006). In a review of the literature, Zee et al. (Reference Zee, Stotsly and Ley2002) warn that, although the evidence for these policies is inconclusive, they seem to create opportunities for rent seeking and corruption. Easson (Reference Easson2004, 63) provides the following clear and critical summary – “Tax incentives are bad in theory and bad in practice”. Research by James (Reference James2009) finds that over 70% of investors in a number of countries would have made their investments even without incentives.Footnote 8 This is consistent with other critical overviews of the use of incentives (Morisset and Pirnia 1999; Blomstrom and Kokko Reference Blomstrom and Kokko2003; Klemm and Van Parys Reference Lazzarini2012).
The academic literature focussing solely on US incentive programmes finds more mixed results. Buss (Reference Buss2001) provides an overview of over 300 studies on the topic, noting the literature’s many conflicting results. Peters and Fisher (Reference Podsakoff and Organ2004) conclude that the majority of studies point to the inefficiency of incentives, and Patrick (Reference Peters and Fisher2014) finds that non-tax incentives have a moderate negative impact on medium-term employment but no impact on long-term employment. In addition, Reese (Reference Rodríguez-Pose and Arbix2014) explores a broader range of incentive policies and how their interactions could affect local economic development.
Numerous studies on incentives and tax policies in general find that incentives are rarely the main factor in shaping investment location or expansion decisions, as shown in Bobonis and Shatz’s (Reference Bobonis and Shatz2007) study of German manufacturing operations in the US. Instead, incentives are often what firms look for to sweeten the deal once they have made a decision. Thus, they are not especially effective in luring new firms to a region. In a review of the literature, Bartik (Reference Bartik2005) argues that this leads to incentives that are excessively costly.Footnote 9
Although summaries of the literature point to concerns about the use of incentives, focussed studies on a single state or metropolitan region find more heterogeneous results. Studies of incentives in Ohio (Gabe and Karybill Reference Gabe and Kraybill2002) and Michigan (Hicks and LaFaive Reference Hicks and LaFaive2011) find that incentives had no positive impact on employment. In contrast, job tax incentives (and property tax abatements) had a significant positive impact on employment in the Atlanta metro region (Bollinger and Ihlanfeldt Reference Bollinger and Ihlanfeldt2003). In an analysis of 540 manufacturing firms in the Appalachian region, incentives affected the initial location choice but not expansion decisions (Walker and Greenstreet Reference Wassmer and Anderson1991). At least one study provides evidence that there are positive and negative effects of incentives and suggests that incentives should only be used to generate employment in the highest unemployment areas (Wassmer and Anderson Reference Wells, Allen, Morisset and Pirnia2001).
In addition, much of the debate centres around the impact of enterprise zones on job creation. In a careful study of California’s enterprise zones, Neumark and Kolko (Reference Neumark, Wall and Zhang2010) find that these zones are ineffective in creating local employment. In contrast, Busso et al. (Reference Busso, Gregory and Kline2010) find that enterprise zones in six metro regions had a major impact on job creation and local wages. Finally, Bondonio and Greenbaum (Reference Bondonio and Greenbaum2007) find nuanced results, showing that the commonly found null impact of incentives fails to account for the complex dynamics of new establishments and firm deaths. They show that enterprise zone programmes can, in fact, have positive impacts on receiving firms, but many of these net benefits are offset by non-incentive firms failing. One of the most recent works on the subject by Greenbaum and Landers (Reference Greenbaum and Landers2009) uses the provocative title “Why Are State Policy Makers Still Proponents of Enterprise Zones? What Explains Their Actions in the Face of a Preponderance of Research?”. They argue that there is little evidence that these programmes are successful and that policymaker support for these programmes likely is driven by special interests that benefit from these programmes.
Thus, despite widespread criticism of these programmes, the empirical debate remains unsettled. In particular, some of this debate centres on defining proper criteria for success as some incentive programmes have been associated with job creation, whereas most programmes have been criticised as either ineffective or inefficient. In the next section, I outline an empirically testable theory on the impact of incentives on job creation, followed by an empirical research design. This research design includes both a comparison of firms that received incentives with a control group of firms that did not as well as a direct survey of firms that received incentives, reviewing how the incentives shaped their location and employment decisions.
The “PEAK” incentive programme
US states and municipalities are active in providing incentives to companies, and thus there are numerous potential programmes that one could evaluate. For example, from 2006 to 2011, Kansas allocated just short of $1 billion as incentives across a number of state economic development programmes (Legislative Division of Post Audit 2014). These incentive programmes have a number of goals, but as many of the names suggest, employment creation is central to many of them.Footnote 10
In this article, I examine Kansas’ flagship programme, PEAK, as a representative incentive programme. There are numerous advantages of evaluating the PEAK programme, which was established in 2009, including the detailed data available on it through FOIA requests, ranging from the timing of proposed job creation to the names and email addresses of the managers that applied for the PEAK incentive. In addition, this programme, administered by the Kansas Department of Commerce and the Kansas Department of Revenue, was one of two programmes evaluated as part of the Kansas Post Audit Committee (Legislative Division of Post Audit Reference Klein and Moretti2013).
Although the background information on PEAK applicants is exceptional, PEAK has many similarities to other state programmes. For instance, PEAK provides an incentive to encourage employment creation by firms in Kansas. More specifically, the Kansas Legislative Division of Post Audit (Reference Klein and Moretti2013) noted that “The PEAK program was created in 2009 to encourage businesses to create jobs by locating, relocating, or expanding operations in Kansas. In return, companies can retain or be refunded a portion of state withholding taxes”.Footnote 11 The PEAK programme provides an incentive of up to 95% of state withholding tax to firms (domestic or foreign) for 10 years that meet specific criteria based on the location.Footnote 12 Companies receiving PEAK incentives must not be in bankruptcy and/or delinquent with their taxes. Employers must propose the creation or retention of at least 10 PEAK jobs, and these PEAK jobs must pay at least the prevailing county wage and include health insurance.Footnote 13 Firms proposing more than 100 jobs can apply for a longer incentive period.
Firms that are granted PEAK incentives can begin collecting the incentives immediately, but they are required to create their proposed PEAK jobs within two years and maintain these jobs for the entire period of their PEAK incentive.Footnote 14 Employers who do not create the proposed PEAK jobs within two years are subject to “clawbacks”, which can include the cancelling of an award and the repayment of some or all of the PEAK incentive granted to the firm.
Although there are clear eligibility conditions and clawbacks designed to police the use of incentives, this programme has been heavily criticised. Part 1 of the Kansas Legislative Audit identifies problems with the administration of the programme as well as company self-reporting that never was verified. In short, the existing data on the Kansas incentive programme hamper both the functioning and evaluation of this programme. In addition, the Legislative Division of Post Audit (Reference Klein and Moretti2013, 11–12) highlights the lack of actual, as opposed to estimated, results and notes that this is a major constraint in evaluating these programmes.
Summarising the total cost of this programme is difficult because the incentives provide tax credits for the future. However, the Kansas Legislative Division of Post Audit (Reference Klein and Moretti2013) found that through December 2012, the programme had created 5,200 jobs at a cost of $21 million (or a total cost of over $4,000/job), where this cost reflected the total incentives paid through December 2012 and did not include the projected future costs of the incentives. In addition, using a FOIA request, I obtained estimates of the programme applicants’ expected total number of jobs and benefits. These estimates indicated that a total of 17,708 jobs were proposed for just over $330 million in projected incentives (for a cost of $18,000/job).
Given the programme’s stated goal of job creation (and retention), I focus on the narrow question of whether this incentive programme helped generate local employment opportunities, ignoring the actual cost of this job creation to the state (Head et al. Reference Head, Ries and Swenson1999; Buettner and Ruf Reference Buettner and Ruf2007). Legislative audits of incentive programmes including the audit of the PEAK programme focus on the impact of incentives on job creation as well as capital investment. In an effort to explore the costs and benefits of incentive programmes, these audits generally estimate the impact of the programme on the tax base, estimating the costs per job and the overall impact of the programme on the government’s fiscal balance. Thus, this analysis focusses on one specific aspect of the PEAK programme.
However, even focussing simply on employment creation suffers from serious concerns of bias. For instance, if it is only firms that already were considering expanding that are applying for expansion subsidies, it is difficult to identify causally if a subsidy is triggering an expansion or if the application is a signal of the firm’s previous interest in expansion. This bias has been documented in a global study by James (Reference James2009), which found that most firms receiving an incentive would have created jobs even without an incentive.
This highlights the difficulty in evaluating these incentive programmes. The types of firms that are expanding and relocating, and thus receiving PEAK incentives, may be very different from those that do not receive PEAK incentives. Thus, I use matching methods in the next section to help account for observable factors among these groups, such as firm size and sector, and answer the core question in this article: holding other observable factors constant, do we observe greater job growth in companies that participated in the PEAK programme?
Although focussing on observable differences between PEAK and non-PEAK firms is a start, this theory and research design also must account for unobservable factors that may shape the decision to apply for PEAK incentives. For example, it might be the case that only firms that are already considering expansion are going to apply for PEAK incentives for expansion. Even if these firms did not receive the PEAK incentives, they would probably have expanded in the future (and created jobs). Therefore, unobservable factors such as the underlying propensity to expand can complicate a causal interpretation of this analysis. However, differentiating between these two situations is central to understanding firm strategies in utilising these incentive programmes. Are these programmes a sort of prize for activities the firm was going to engage in anyway, or are they shaping expansion and relocation strategies?
Thus, to address the causal relationship between incentives and job creation, we must generate the counterfactual of what these firms would have done without the PEAK incentives. Although many firms may use incentives for new job creation, firms simply can classify jobs that would have been created in the absence of these incentives as “new”. In some cases, this can go as far as manipulating job numbers – for instance, simple statistics such as pledges of jobs created have been manipulated to maximise incentives (Gabe and Kraybill Reference Gabe and Kraybill2002). This suggests that many of these incentives are redundant. For example, Faulk (Reference Faulk2002) finds that 72.4–76.5% of jobs created in a Georgia incentive programme would have happened even without incentives.Footnote 15
As a starting point at addressing the impact of incentives, we can look at some basic descriptive statistics on the firms that relocated to Kansas through the PEAK programme and those that came without PEAK support. According to data presented in the Kansas Legislative Division of Post Audit (Reference Klein and Moretti2013), 54 incentives were provided to firms expanding their existing establishments and 34 were provided to companies relocating to Kansas. Although these statistics are informative, it is difficult to evaluate how many of these PEAK-supported relocations generated new jobs in Kansas as these relocations may have happened without a PEAK incentive. In addition, some of these establishments were moved just a few miles across the state line from Missouri. Therefore, can we associate PEAK incentives with job creation?
This is a difficult question and would require detailed data of individual employees to answer. What the data do tell us, however, is that the vast majority of PEAK incentives that went to relocations were for firms previously located in Missouri (27 out of 34 relocations). This bias towards attracting Missouri firms contrasts with the National Establishment Times-Series (NETS) data on Kansas that I present in the next section. According to this relatively comprehensive database of over 45,000 relocations, almost 35,000 relocated from another location in Kansas and only 10,000 relocated from another state. In addition, although 79.4% of the PEAK incentives provided to out-of-state relocations were targeted at Missouri firms, Missouri firms only represent 30.4% of the out-of-state relocating firms in the NETS data. Thus, although many firms relocated to Kansas from large states such as Texas (831 establishments) and California (696 establishments) based on the NETS data, firms from these states very rarely received a PEAK incentive. These simple descriptive data suggest that a large number of PEAK incentive firms may simply be shifting jobs across the Missouri–Kansas border.
In addition, these descriptive statistics offer insights into the strategic use of relocation incentives by managers. For example, the majority of firms taking advantage of these incentives are shifting their operations across the Missouri–Kansas border, and some of them just a few miles. Thus, firms currently operating in Kansas City, MO most likely have the ability to shift their location to Kansas City, KS to obtain PEAK incentives. This provides some evidence concerning the firms targeted by the PEAK programme, but it still does not answer this article’s main question. Thus, considering the mixed evidence on the impact of incentives on employment creation, this project aims to examine whether these incentive programmes achieve their stated goal of employment creation. In other words, would PEAK-recipient firms have created the same number of jobs, or even left the state, without these incentives?
Research design and analysis
Evaluations of incentive programmes are notoriously difficult. The first problem is data limitations. Many governments provide very few details about their incentive programmes, and even fewer details on the companies that received the incentives. Although this lack of transparency has been well documented in other studies (Buss Reference Buss2001), it points to another challenge in evaluating incentive programmes: the generation of a counterfactual is necessary for a proper evaluation. In other words, what decisions would a manager have made without the incentive? Would jobs, sales and profitability be lower if the company did not receive the incentive? Would the executives have moved the company to another location, or would the company possibly have gone out of business?
These are difficult questions to answer, and most of the information required is in the hands of companies seeking incentives. Thus, this information asymmetry (i.e. only the company knows if the incentive is necessary) can lead governments to provide excessively generous incentives to firms that would have undertaken the same activity without government support (LeRoy Reference Li2005). This means that to evaluate an incentive programme properly, we cannot just look at a firm that received an incentive tied to a new investment or expansion. In this scenario, we will most likely see a correlation between new capital investment and more jobs with the incentive programme, but what inferences can we draw about how much of this outcome we should attribute to the incentive programme?
Even a study of a company over time can lead to the erroneous conclusion that the incentives had a positive outcome. For example, imagine a company that is in business for 20 years and engaged in three expansions of employment. In Year 1, the company started with 10 jobs, in Year 5 had an expansion of an additional five jobs (15 jobs in total) and in Year 10 had another expansion of five jobs (20 jobs in total). If the company received an incentive in either or both expansion years, most statistical models would find a positive relationship between incentives and job creation.
However, the main problem here is that if companies only apply for and receive incentives in the years that they already were considering expanding, it is highly likely that we are concluding erroneously that incentives help generate jobs. This is akin to claiming that hospitals kill people because many people die in hospitals. Companies that receive incentives for job creation create some jobs, but this does not mean that the incentives were effective in creating these jobs.
Although there are few clear fixes to this problem of causal inference, in this article, I outline a relatively comprehensive database of firm establishments that gives us some leverage on this problem. As we know that, as mentioned above, companies that are already considering expanding or relocating are more likely to apply for and receive incentives, we can use this rich data set to perform “matching methods” to attempt to compare firms that received incentives with other very similar firms based on observable characteristics. Thus, we can explore whether the firms that received incentives performed better than their peer groups. In the next section, I provide an overview of the PEAK programme and the establishment-level data set that I used for matching PEAK firms with similar firms in Kansas.
Matching PEAK firms with Kansas establishments
Although there is no silver bullet to overcoming the lack of information collected on companies receiving incentives, existing data on the employment and sales of PEAK companies relative to other establishments in Kansas are available. To assess the impact of PEAK incentives on individual firms requires fine-grained establishment-level data. Fortunately, Walls & Associates created one of the most comprehensive databases of establishment-level data using Dun & Bradstreet data. These NETS data, in contrast to many other sources of firm data, disaggregate each establishment of a firm. This is critical because most incentive programmes provide funding for a single establishment – for example, the single location of a company that has multiple Kansas locations.
These data have been used by other researchers and compared with existing databases. The most comprehensive analysis can be found in the study by Neumark et al. (Reference Patrick2011). In their study, they examined the correlations in employment numbers between the NETS data and the US Current Population Survey and Current Employment Statistics, which yielded an overall correlation of 0.99 and 0.95, respectively, although the NETS data generally had higher estimates of employment and lower levels of employment change.Footnote 16
The most comprehensive data were collected in 1992, when Dun & Bradstreet were allowed to purchase Yellow Pages data to call individual firms directly. This massive data collection effort has resulted in a database of millions of firms across the US and includes detailed information on 500,000 firms located in Kansas. Using public records requests, documentation from the Kansas Legislative Audit and news media sources, I linked PEAK incentive recipients to the NETS data. As outlined in the Kansas Legislative Audit, between 2009 and 2013, 117 companies had signed PEAK agreements, although only 94 companies were provided incentives and were active during the review. Thus, this article captures the vast majority of the PEAK incentive recipients.
Comparing PEAK firms with all 500,000 establishments in the NETS data would be an unfair comparison. This is the case because PEAK firms tend to be much larger in terms of both employment and sales and may be concentrated in different sectors. In Figure 1, I visualise the kernel density of employment of all firms in the NETS database before receiving any PEAK incentives (i.e. in 2006, three years before the start of the PEAK programme). I classify PEAK firms as those that received a PEAK incentive in the future. What is unsurprising is that PEAK firms were much larger than the non-PEAK firms even before receiving incentives. Thus, central to evaluating this programme is finding the correct comparison set of firms.

Figure 1 Kernel density of pre-PEAK employment
Luckily, there is a large literature on the use of “matching methods” to compare treatment (i.e. firms receiving PEAK incentives) and control (i.e. firms that are similar to PEAK firms but did not receive incentives) groups. My main results utilise coarsened exact matching (CEM) (Iacus et al. Reference Iacus, King and Porro2012), which matches PEAK firms with control firms that share similar characteristics, and I also present robustness tests using two other types of matching. For all the matching tests, I use a set of observational variables, including the firm’s previous employment (i.e. employment in 2006, before the start of the incentive programme), whether the firm is a subsidiary of a parent company and the company’s sector [i.e. the three-digit Standard Industrial Classification (SIC) code].
Matching firms based on their 2006 employment allows us to examine the employment created from 2006 to 2012 for firms that received PEAK incentives and those that did not, which in turn provides us with the opportunity to examine how employment changed from 2006 to 2012 for the PEAK and non-PEAK firms. In addition, matching allows us to harness the power of our data set of 500,000 firms in order to select a control set of firms that share nearly identical attributes with the firms that received PEAK incentives.
Simple descriptive statistics demonstrate how the population of PEAK firms and non-PEAK firms is substantially different on a number of dimensions (see Table A1 in the appendix). Table 1 presents the results of CEM using 2006 employment and whether the firm was a subsidiary. CEM has a number of properties that makes it appealing for this project, but there is no assurance of balance between treatment and control groups.
Table 1 Comparing firms receiving Promoting Employment Across Kansas (PEAK) incentives with other firms in Kansas: coarsened exact matching (CEM)
Note: Ordinary least squares with the dependent variable in the first stage is the natural log of total establishment employment in 2012. Models 1, 2, 4 and 5 all present CEM using a dummy variable for status as a subsidiary and the natural log of pre-PEAK employment. Models 2 and 5 include three-digit Standard Industrial Classification codes. Model 3 presents entropy balancing (EBAL).
***p<0.01, **p<0.05, *p<0.1.
In Figure 2, I present the kernel densities of the two sets of firms’ employment in 2006 to illustrate the level of previous employment of the control and treatment firms. The level of employment, before the start of the incentive programme, is very similar across the control and treatment groups.
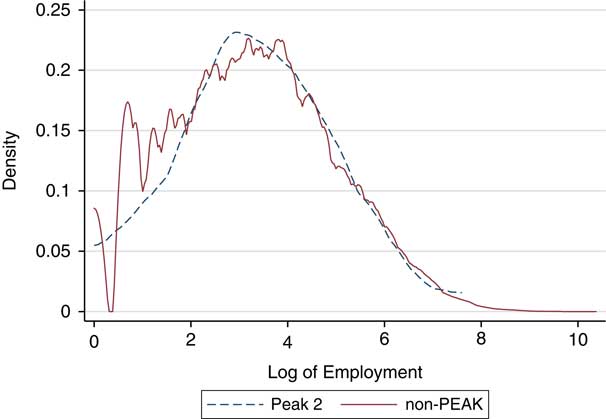
Figure 2 Kernel density after coarsened exact matching
In addition, Model 1 suggests that PEAK incentives, with a coefficient of 0.06 – or just over one job – has essentially no impact on job creation. For comparison, my public records request on the PEAK programme revealed that the same set of firms used in Model 1 proposed creating an average of 124 jobs, or a natural log of 4.83, and received an estimated benefit of just under $2.53 million. The jobs associated with the PEAK programme are not only incredibly small, they are well below the expectations set by the firms in their applications.
In the second model, I include the three-digit SIC sector dummy variables, matching PEAK firms with firms from the same sector. There are numerous sectors with firms that did not receive any PEAK incentives, and thus these sectors are dropped. This is a conservative test, where we only compare firms within a three-digit SIC sector, leading to many dropped observations. Yet, the empirical results are unchanged. There is no significant impact of PEAK incentives on firm employment in 2012.
In Model 3, I use a variant of matching called entropy balancing (Hainmueller Reference Hainmueller2012; Hainmueller and Xu Reference Hainmueller and Xu2013). Although CEM has a number of advantages, its main disadvantage is that treatment observations that cannot be matched to a control observation are dropped.Footnote 17 However, entropy balancing allows us to harness the information contained to generate an area of common support between the treatment and experimental groups using weighting to achieve balance without dropping observations.
In the appendix (Table A1), I present the balance between the treatment and experimental groups both before and after balancing. Firms receiving PEAK incentives were three times larger than non-PEAK firms before the incentive programme was even started, and these firms were 10 times more likely to be subsidiaries. After entropy balancing, the means of both variables are almost identical (presented in the second panel of Table A1), although the variance of employment is twice as large in the non-PEAK firms compared with the PEAK firms. I depict the kernel density of employment in 2006 (before the incentives) for both PEAK and non-PEAK firms after balancing in Figure 3.
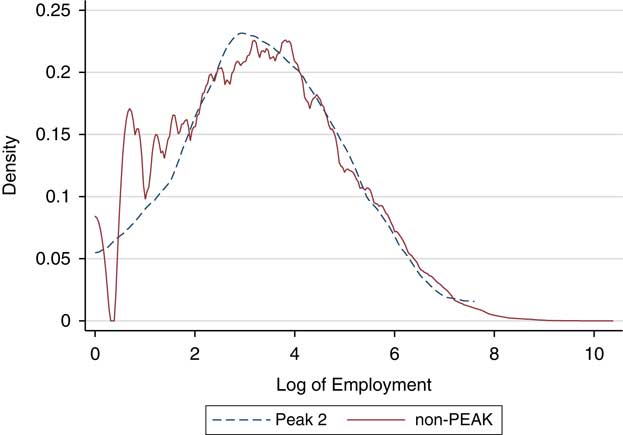
Figure 3 Kernel density after entropy balancing
Using the weights generated by entropy balancing, I estimate an ordinary least squares (OLS) model of job creation. I present the results in Table 1, Model 3. Even after the additional efficiency of entropy balancing, we find similar substantive results. There is no statistically significant impact of PEAK incentives on employment in 2012.
One limitation of all forms of matching is that there is the potential for imbalance between control and treatment groups. One strategy for addressing this issue is to include control variables to address covariate imbalance. In the appendix, I include a model with additional control variables.Footnote 18 The substantive results are similar.
One recommendation to address these potential concerns of imbalance is to perform one-to-one CEM (Iacus et al. Reference Iacus, King and Porro2012). Thus, for every firm that received a PEAK incentive, I match each of these PEAK firms with a single non-PEAK firm. This form of exact matching does not require additional covariates to achieve balance, as only PEAK firms that can be matched to non-PEAK firms are included in this analysis. Models 4 and 5 match PEAK firms with a control non-PEAK firm. This obviously leads to a dramatic decrease in the sample size, as we only match PEAK firms that have non-PEAK control firms of the same size and subsidiary status (Model 4) and in the same three-digit SIC code (Model 5). The results of this matching are equally clear: there is no evidence that the PEAK programme created employment in PEAK firms.
Robustness test: propensity score matching
As a robustness test, I utilise the most well known of these methodologies: propensity score matching, using the five “nearest neighbours”. These are not necessarily geographic neighbours. Rather, they are firms that look very similar to the firms receiving PEAK incentives. To match these firms, I use a set of observational variables including the firm’s previous employment, whether the firm is a subsidiary of a parent company and the three-digit SIC code. In Table 2, I present a comparison of these firms using the natural log of 2012 employment.
Table 2 Comparing firms receiving Promoting Employment Across Kansas (PEAK) incentives with other firms in Kansas: propensity score matching
Note: The dependent variable in the first stage is the natural log of total establishment employment in 2012. The first row for each model presents differences between firms receiving PEAK incentives and those that do not. The second row presents the average treatment effect from propensity score matching of 51 PEAK incentive recipients using the five nearest neighbours.
***p<0.01, **p<0.05, *p<0.1.
In the first row, I present the natural log of total employment, comparing PEAK and non-PEAK firms. PEAK-recipient firms are almost three times as large in 2012 as non-PEAK firms (3.55 versus 1.20). This difference is substantially meaningful and statistically significant, but this finding is largely driven by the fact that PEAK firms were already larger before receiving a grant and were already different on a number of dimensions. In the second row, we compare each PEAK firm with the five “nearest neighbour” firms, or with firms in the data set that, in 2006, looked similar to the PEAK firms in terms of employment and whether or not they were a subsidiary of a parent firm. When we make this comparison, the difference between the two sets of firms shrinks by a factor of 10 to only a 0.19 difference between firms, and this difference is not statistically different from 0.Footnote 19
In the first row of Model 2, I again present the same comparison between PEAK and non-PEAK firms. However, in the matching, I now include the three-digit SIC code to help identify the five nearest neighbours. To be clear, now we are comparing firms that received PEAK incentives with firms that are of a similar size (in 2006), of the same subsidiary or non-subsidiary status and in the same industry. These estimates are even more striking with the difference between firms shrinking to 0.06.
These results suggest that the PEAK programme has had a limited impact on job creation and that firms used these incentives to subsidise already planned expansions. Unfortunately, these observational data do not allow us to observe a manager’s strategy directly or the counterfactual of what decisions the manager would have made without a PEAK incentive. To explore these strategic choices directly, I surveyed PEAK recipients, and I present this evidence in the next section.
A survey of PEAK incentive recipients
The central question of this research project is how the PEAK programme was used by firms, and whether this programme led to an increase in the number of employees. In other words, are firms leveraging public resources for expansion, or are they harnessing public resources to subsidise activities they were going to engage in with or without government support? To examine this question directly, I conducted a survey of PEAK incentive applicants.
Using a FOIA request on the PEAK programme, I identified 105 PEAK incentive applicants. I intentionally use the term applicants because it includes companies that could have withdrawn their application as well as companies that did not receive their incentives because they did not fulfil the PEAK requirements in terms of the number of jobs created or the minimal wages offered. These applications identify the individual responsible for the application and the direct email address for this applicant. This email address was the first point of contact for our survey. In the event that the email was returned, a research assistant searched for a point of contact in the company and sent a direct email. In total, 84 correct email addresses from the PEAK applications were used to field the survey and an additional 21 alternative email addresses were found through web searches.
For all 105 firms, managers received a recruitment email and a link to an online Qualtrics survey.Footnote 20 I include a copy of this email in appendix B. Survey participation was voluntary, and there was no compensation for participation. All responses are completely anonymous. I received a total of 25 responses, with a response rate of 23%, although some respondents did skip some questions. This response rate is similar to Cycyota and Harrison’s (Reference Cycyota and Harrison2006) average response rate of 32% from 231 studies from 1992 to 2003 and Baruch and Holtom’s (Reference Baruch and Holtom2008) average response rate of 35%.Footnote 21
One concern with any survey that relies on managers answering questions about their own firm is possible bias in this self-reporting. Podsakoff and Organ (Reference Reese1986) note two of these biases that could affect this study. First is what they term the “consistency motif”, which is the tendency of respondents to provide consistent answers to questions. For instance, respondents might try to or unintentionally formulate a consistent narrative of the PEAK programme. This could make it difficult to separate a firm’s individual experience with the programme from the respondent’s evaluation of how important the programme was for the firm. As I note in the results below, there is little correlation between a respondent’s answer on their evaluation of the efficiency of the PEAK incentive programme and how the incentive programme affected the firm’s expansion or relocation.
Second is social desirability bias, a long-discussed issue in behavioural research, which is the tendency of respondents to provide answers that are consistent with social norms. For instance, as firms were provided public incentives for a job-creation programme, respondents may feel pressure to link their receipt of a PEAK incentive to job creation. This bias is a concern, potentially increasing the likelihood of responses consistent with the hypothesis that the PEAK programme was central to encouraging employment. Therefore, I discuss this point in the results section.
I include the full list of questions in appendix C, which are broken down into four sets of questions. The first set of questions concerned background information about the companies, including the size of the company, details on the location of the company’s headquarters and a verification that the company had applied for a PEAK incentive (100% of respondents indicated that this was correct).
I provide a summary of some of the most relevant questions in Table 3. I do not include questions with no response from the manger in the totals below. However, one important descriptive point is that the majority of firms (14 out of 24) indicated that they were applying for PEAK incentives for expansion, whereas 10 and six firms out of 24 indicated that they were applying for relocation and retention, respectively.Footnote 22 Of these applicants, 88% indicated that they received PEAK awards, whereas the remaining respondents indicated that they received the incentive but the programme was terminated. For many firms, respondents indicated that they received competing offers from other locations,Footnote 23 and 10 out of 22 respondents indicated that the PEAK incentives were more generous than the competitor offers.
Table 3 Results from a survey of Promoting Employment Across Kansas (PEAK) recipients
Note: Appendix C provides the exact wording of the questions. Yes and No columns count the number of responses fitting into each category. Note that the questions on expansion, relocation and retention are not mutually exclusive. Appendix A and D provide descriptive data for all of the survey questions. “DK” is the total “Don’t Know” response for questions that offered this option.
The vast majority of respondents had a positive experience with the PEAK programme and indicated that the programme was either “very efficient” or “somewhat efficient”. In addition, 22 out of 24 respondents would “definitely recommend” or “probably recommend” this programme to other firms. Numerous respondents also provided individual write-in responses commending the programme. Thus, this survey finds general satisfaction with the programme among firms, noting the competitiveness of the programme relative to other states and the efficiency of the programme’s application process.
However, the key set of questions is the counterfactuals on what the firms would have done without the PEAK incentive. I asked two direct questions to applicants. First, I asked whether the firm would have left the state of Kansas without a PEAK incentive, providing three possible answers.
Without the PEAK incentive, would your company have left the state of Kansas?
No
Yes
Unsure
Next, I asked about the firm’s expected employment without a PEAK incentive:
Without the PEAK incentive, would your company have hired fewer employees or the same number of employees?
Fewer
Same
Other [Blank]
Both of these questions reveal that a large percentage of the incentives appears to be redundant, as presented in Table 3. Only five managers (out of 24) indicated that they would have left Kansas without the PEAK incentive programme. However, this question on relocation is a difficult one, as some of the firms were applying for PEAK incentives for expansion. The second question is a more comparable measure of the impact of PEAK incentives. Again, only five out of 24 firms claimed that they would have hired fewer workers without support from the PEAK programme.Footnote 24 These responses are strikingly similar to the work cited in the second section, which finds high levels of redundancy in terms of incentive programmes.
How do these findings compare with the observational data? As highlighted above, very few firms (five out of 24) indicated that the PEAK incentive programme would have had an impact on job creation for their company. Thus, the null results in the previous section most likely are driven by the large number of firms that made no changes to their employment plans because of the PEAK programme. In addition, this survey provides further advantages over the observational data analysis in understanding how firms utilised these incentive programmes. One simple conjecture concerning the PEAK recipients’ poor job-creation performance could be the high costs of applying for and complying with the PEAK incentive programme. Yet, respondents did not indicate serious concerns with this process and overwhelmingly recommended the PEAK programme to other firms. Furthermore, the majority of firms received incentive offers from other jurisdictions, but the PEAK programme was more generous than these other options.
Finally, the survey included a final question asking about a specific policy. The Missouri State Legislature introduced a bill that proposed limiting incentive competition in the Kansas City area. We asked the respondents whether they had heard of the bill (50% had) and whether they supported this legislation. The largest percentage of respondents “neither supported nor opposed” the legislation (42%) with a smattering of responses in the supported or opposed categories, followed by 21% of respondents indicating “don’t know”.Footnote 25 Thus, there is only limited support, and limited opposition, for ending a very specific type of incentive competition in the region.
It is important to note that caution is merited in the use of firm surveys. First, the small sample size can lead to a small number of outliers driving the results. Although the response rate of this survey is comparable with previous firm-level surveys, the small number of firms that participated in the PEAK programme makes this a valid concern. Yet, when compared with previous surveys of incentives, the finding concerning the redundancy of incentives is remarkably similar to existing scholarship on the topic. Second, querying firms on their use of incentives can be prone to a number of biases. However, as noted earlier, most of these biases would lead to over-reporting the impact of incentives.
Third, and perhaps most importantly, the evaluation of these survey results is subjective. What percentage of the firms must sway their investment and employment decisions for us to call this programme successful? The finding that one-third of firms was impacted by this programme could be evidence for a programme that indeed had a positive impact on employment in Kansas. This final point is important, and these criteria are best left to policymakers and citizens. However, the goal of this project was to document, as clearly as possible, the impact of the PEAK programme on employment in Kansas. The matching results indicate that there is no clear evidence that these incentives created jobs, and the survey evidence suggests that roughly two-thirds of firms answered that incentives had no impact on their investment or employment behaviour.
Conclusion
A few government policies are more important than creating jobs for the citizenry. In this article, I explored the impact of financial incentives targeted at individual firms as a state job-creation strategy. As this evaluation requires finding a comparison group of firms to use as a “control group”, I used matching techniques to help create this set of control firms. In addition, I used an original survey of incentive recipients to explore firms’ use of incentives, which suggested that the PEAK programme is both popular and ineffective. Specifically, managers commended Kansas for running an efficient incentive programme and noted that it is more generous than the incentive programmes of competing locations. However, few firms answered that, without the PEAK programme, they would have created fewer jobs.
These results add to the growing debate on the effectiveness of local economic development policies. Although this study focusses on a single incentive programme and the “economic border war” between Kansas and Missouri may seem unique, broader lessons can be learnt. For instance, the results suggest that even firms that were considering expansion, not relocation, indicated that their employment plans were unchanged upon receipt of a PEAK incentive. Overall, I find that there is no concrete evidence that the PEAK incentive programme is effective at generating jobs in Kansas.
This is an important result for the evaluation of incentives, but some modesty is required in making broader comparisons with other country, state and local incentive programmes. Variations in the structure of programmes, their application and enforcement require additional studies of incentive programmes. Thus, the PEAK programme is a single case of a ubiquitous economic development policy. However, further study of additional incentive programmes is required before claiming there is systematic evidence for the ineffectiveness of incentives.
With this in mind, what are the implications of this work for policymakers? One obvious conclusion is the concern that one of the most common economic development policies harnessed by cities and states is broadly ineffective in increasing employment. Although some firms indicated that incentives helped facilitate job creation, the vast majority of jobs seems to be redundant, simply channelling government resources to firms that would have expanded or relocated anyway. This study compliments existing work, finding evidence consistent with a high “redundancy” rate of incentives. Most incentives are probably going to firms that were already going to relocate or expand.
Equally important is the fiscal impact of this programme on the state. Applicants to the PEAK programme proposed over 17,000 jobs at a projected cost of approximately $330 million. According to the matching methods, very few of these were “new” jobs that would not have occurred without the PEAK incentive. The survey results are slightly more optimistic, where 21% of firms indicated that they would have hired fewer employees without the PEAK incentive. If these firms are representative of the total population of PEAK firms, then the PEAK programme only generated 3,848 jobs at a cost per job of over $86,000. These are obviously back of the envelope calculations, but the point is that with a very large percentage of “redundant” jobs the costs of these programmes are very high.
How does Kansas pay for these incentive programmes and what are the opportunity costs? Unlike some incentive programmes that are funded by a special sales tax, the Kansas incentive programmes are supported by the general budget. However, an anecdote from 2013 provides some evidence of the opportunity costs of these economic development programmes; Kansas raises revenues in the form of bonds for some of these incentive programmes, and these bonds are subject to the normal ratings. In 2013, these bonds were downgraded due to concerns of a major cut in Kansas’ personal income taxes (Moody’s Reference Neumark and Kolko2013). What this example suggests is that economic development bonds are not paid from additional business activity. They are funded by personal income taxes. Without revenues from personal income taxes, and with no indication that rating agencies believed that the economic development policies would lead to additional tax revenues in the future, the state had to make hard decisions on how to allocate its scarce public resources to economic development, with the risk of one of the main revenue generators being downgraded. This article helps clarify these decisions by finding that one of the most common and representative incentive programmes is most likely ineffective and inefficient.
Acknowledgements
The author thanks the Ewing Marion Kauffman Foundation for providing financial support for this project and Yasuyuki Motoyama for excellent advice on the research design. The author thanks the participants at the “Incentives to Innovate” conference at the Kauffman Foundation for their comments and suggestions. Angela Smart at the Hall Family Foundation generously shared data for this project. The author thanks Margaret Bavisik, Ben Crisman, Lillian Frost and Nikhil Venkatasubramanian for excellent research assistance. All remaining errors are my own.
Supplementary Material
To view supplementary material for this article, please visit http://dx.doi.org/10.1017/S0143814X16000039


