


Introduction
Ferric iron sulfates are important minerals typically formed through the weathering of pyrite (e.g. Jambor et al., Reference Jambor, Nordstrom, Alpers, Alpers, Jambor and Nordstrom2000). According to the International Mineralogical Association (IMA) List of Minerals (accessed in May 2019; Pasero, Reference Pasero2019), the system Fe2O3–SO3–H2O consists of 16 mineral species (Table 1). Among them, five phases share the same formula Fe2(SO4)3⋅nH2O, where n = 5 (lausenite), 7 (kornelite), 9 (coquimbite and paracoquimbite) and 11 (quenstedtite). However, the inclusion of coquimbite into the Fe2O3–SO3–H2O ternary system is doubtful, owing to the uncertainty in its definition. Indeed, as pointed out by previous structural studies (i.e. Fang and Robinson, Reference Fang and Robinson1970; Giacovazzo et al., Reference Giacovazzo, Menchetti and Scordari1970; Majzlan et al., Reference Majzlan, Navrotsky, McCleskey and Alpers2006 and Reference Majzlan, Dordević, Kolitsch and Schefer2010; Demartin et al., Reference Demartin, Castellano, Gramaccioli and Campostrini2010a; Yang and Giester, Reference Yang and Giester2018), aluminium seems to be an essential component in the crystal structure of coquimbite. Notwithstanding the unequivocal results of some of these studies, coquimbite was still reported as an Al-free ferric iron sulfate.
Table 1. Mineral species in the system Fe2O3–SO3–H2O.
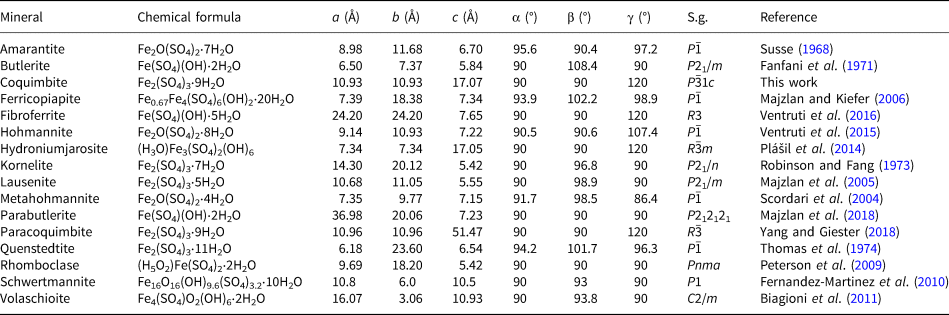
S.g. – space group; chemical formulae after the official IMA List of Minerals (Pasero, Reference Pasero2019).
In order to define the actual chemical formula of coquimbite, a critical examination of the available literature was performed. None of the available crystal-chemical works gave a full set of data (high quality single-crystal X-ray diffraction or electron microprobe data collected in wavelength dispersive mode). Consequently, the aim of this paper is two-fold: discussing the previous mineralogical studies on coquimbite and related minerals, and providing a new set of data collected on specimens from a new finding of coquimbite. These data fully agree with the previous results and supported the proposal for the redefinition of coquimbite as an aluminium-ferric iron sulfate. In addition, the coquimbite group is proposed, in accord with the guidelines on group nomenclature (Mills et al., Reference Mills, Hatert, Nickel and Ferraris2009). The proposal has been accepted by the IMA-CNMNC (proposal 19-F, Miyawaki et al., 2019).
Coquimbite and related minerals: a review
From the type description of coquimbite to the first X-ray diffraction studies
Coquimbite was described as a new mineral species from Coquimbo, Chile by Rose (Reference Rose1833), who called it “neutrales schwefelsaures Eisenoxyd mit Krystallisationswasser”. According to the type description, this mineral was found “in der Provinz Coquimbo […] und zwar im district Copiapo” (Rose, Reference Rose1833). Chemical data reported in the type description indicate only minor Al2O3 (0.92 wt.%). The name ‘coquimbite’, after the type locality, was first introduced by Breithaupt (Reference Breithaupt1841).
Arzruni (Reference Arzruni1879) gave additional information about the occurrence of coquimbite and discussed its morphology and chemistry. In that paper, the results of the chemical analyses performed by Bamberger were presented, indicating that the formula of coquimbite should be written as ‘(¼ Al2 + ¾ Fe2)(SO4)3 + 9 H2O’. By recalculating this formula on the basis of six (SO4) groups per formula unit, it becomes AlFe3(SO4)6⋅18H2O.
New chemical data were given by Linck (Reference Linck1889). No Al2O3 was reported, in contrast to the previous data given by Arzruni (Reference Arzruni1879). Subsequent data given by Collins (Reference Collins1923), who described this mineral from the Concepcion mine, Spain, found 2.25 wt.% Al2O3, also confirmed by Lausen (Reference Lausen1928), who pointed out the high Al content (6.93 wt.% Al2O3) occurring in coquimbite from the United Verde mine, Arizona, USA. On the contrary, Scharizer (Reference Scharizer1927) and Bandy (Reference Bandy1938) gave Al-free chemical data for coquimbite, in agreement with Linck (Reference Linck1889).
It is worth noting that Bandy (Reference Bandy1938) gave similar data for both coquimbite and paracoquimbite.
The latter phase was described by Ungemach (Reference Ungemach1933, Reference Ungemach1935) during the re-examination of the specimens studied by Linck (Reference Linck1889), stored in the mineralogical collection of the University of Strasbourg, France, as a dimorph of coquimbite. The distinction between these two minerals was based upon some morphological and physical features as well as upon X-ray data collected through the Laue method. X-ray diffraction proved that coquimbite is trigonal with a primitive lattice, whereas paracoquimbite has a rhombohedral lattice. According to the data given by Ungemach (Reference Ungemach1935), the chemistry of these two minerals is very similar and both display only trace amounts of Al2O3.
Owing to the uncertain Al content, the ideal formula Fe2(SO4)3⋅9H2O was used throughout for both coquimbite and paracoquimbite (e.g. Palache et al., Reference Palache, Berman and Frondel1951). This is the same chemical formula that was reported in the official IMA List of Minerals (Pasero, Reference Pasero2019), ignoring the results of the crystallographic studies carried out in the 1970s.
Structural studies and the role of Al in coquimbite
Cesbron (Reference Cesbron1964) determined the space group of coquimbite as P  $\bar{3}$1c, using a sample from Tierra Amarilla, Chile (Musèum National d'Histoire Naturelle, Paris sample MHNN 13373).
The crystal structure of coquimbite was first solved through single-crystal X-ray diffraction data by Fang and Robinson (Reference Fang and Robinson1970) and Giacovazzo et al. (Reference Giacovazzo, Menchetti and Scordari1970). The former, using a sample from Tierra Amarilla stored in the National Museum of Natural History (Smithsonian Institution) in Washington DC, USA (catalogue number 12548), found the presence of an Al-centred octahedron with the cation at (0, 0, 0) (site 2b), with site occupancy (Al0.90Fe0.10). The structural data were confirmed by wet chemical analysis. Giacovazzo et al. (Reference Giacovazzo, Menchetti and Scordari1970) achieved similar results studying a sample from the Dexter mine, Utah, USA, obtaining an occupancy for the octahedral 2b site of (Al0.63Fe0.37). Aluminium and iron were determined chemically through colorimetric methods.
The crystal structure of the related mineral paracoquimbite was solved by Robinson and Fang (Reference Robinson and Fang1971) using a sample from Chuquicamata, Chile stored in the National Museum of Natural History (Smithsonian Institution, USA; catalogue number 115161). As pointed out by the authors, no Al2O3 was detected, contrasting with the extensive Al-to-Fe substitution observed in coquimbite. The relationship between paracoquimbite and coquimbite was later discussed by Fang and Robinson (Reference Fang and Robinson1974).
Majzlan et al. (Reference Majzlan, Navrotsky, McCleskey and Alpers2006) refined the crystal structure of coquimbite from the Richmond mine, Iron Mountain, California, USA, using synchrotron powder X-ray diffraction data, further confirming the occurrence of an Al-dominant octahedron in the crystal structure of coquimbite, with site occupancy (Al0.91Fe0.09). Minor Al was found at the Fe(3) site at (⅔, ⅓, z), with site occupancy (Fe0.93Al0.07). Inductively-coupled plasma optical emission spectroscopy confirmed the occurrence of Al in coquimbite.
Demartin et al. (Reference Demartin, Castellano, Gramaccioli and Campostrini2010a) studied three samples of coquimbite from Vulcano, Italy; Alcaparrosa, Chile; and from the Dexter No. 7 mine, Utah, USA. In all cases, the 2b site was occupied by Al, with only a partial replacement by Fe3+ (i.e. Al0.76Fe0.24) in the Chilean specimen. Structural data were supported through energy-dispersive spectroscopy (EDS) chemical analyses. A fourth sample, from Vulcano, was particularly enriched in Al and it was described as the new mineral species aluminocoquimbite (Demartin et al., Reference Demartin, Castellano, Gramaccioli and Campostrini2010a,Reference Demartin, Castellano, Gramaccioli and Campostrinib). Demartin et al. (Reference Demartin, Castellano, Gramaccioli and Campostrini2010a) were the first to locate the hydrogen atoms in the crystal structure of coquimbite. Their data were confirmed through neutron diffraction by Majzlan et al. (Reference Majzlan, Dordević, Kolitsch and Schefer2010) using a sample from the Dexter No. 7 mine, Utah, USA. This study confirmed, through neutron and X-ray diffraction, that the 2b site is occupied dominantly by Al. Meanwhile, a new refinement performed by Ackermann et al. (Reference Ackermann, Armbruster, Lazic, Doyle, Grevel and Majzlan2009) on the synthetic analogue of paracoquimbite confirmed the previous results of Robinson and Fang (Reference Robinson and Fang1971), indicating that all octahedral sites in this phase are occupied by Fe3+ only.
Frost et al. (Reference Frost, Žigovečki Gobac, López, Xi, Scholz, Lana and Fernandes Lima2014) discussed the infrared and Raman spectra of coquimbite, using a specimen from the Javier Ortega mine, Peru. Chemical analysis, performed using EDS, gave the formula (Fe1.37Al0.63)(SO4)3⋅9H2O, corresponding to Al1.26Fe2.74(SO4)6⋅18H2O (Z = 2).
Finally, Yang and Giester (Reference Yang and Giester2018) re-examined the crystal structures of both coquimbite and paracoquimbite, giving the location of hydrogen atoms in the latter species. For the first time, they proposed the correct formula AlFe3(SO4)6⋅18H2O (Z = 2) for coquimbite, suggesting that a revision of its chemical formula is necessary. Unfortunately, their structural data, indicating the site occupancy (Al0.66Fe0.34) for the 2b site, were not supported by chemical data, which indicate the occurrence of only negligible Al. Paracoquimbite, on the contrary, was confirmed to be a pure Fe3+-sulfate.
Coquimbite from the Monte Arsiccio mine, Apuan Alps, Italy
The specimen of coquimbite studied was collected in the Monte Arsiccio mine, Apuan Alps, Tuscany, Italy (43°58'0″N, 10°16'59″E), where a complex sulfate assemblage has been recently discovered (e.g. Biagioni et al., Reference Biagioni, Bindi, Mauro and Hålenius2019). Coquimbite occurs as purple pseudo-hexagonal crystals (Fig. 1), up to 3 cm across, associated with halotrichite, römerite, melanterite, alunogen, krausite and rarely khademite. The identification of this specimen was confirmed through the collection of a powder X-ray diffraction pattern using a 114.6 mm Gandolfi camera and Ni-filtered CuKα radiation.

Fig. 1. Pseudo-hexagonal crystals of coquimbite, up to 1.5 cm in size. Monte Arsiccio mine, Apuan Alps, Italy (specimen in private collection).
Chemistry
Quantitative chemical data were collected using a Superprobe JEOL JXA 8200 electron microprobe (wavelength-dispersive spectrosopy mode, 15 kV, 10 nA and 10 μm beam diameter) at the Eugen F. Stumpfl laboratory, Leoben University, Austria. Standards (element, emission line) were: hematite (FeKα); kaersutite (AlKα); and baryte (SKα). The average of 20 spot analyses gave (in wt.%): SO3 42.88(45), Al2O3 4.38(7), Fe2O3 22.28(38), H2O(calc) 29.10, total 98.64. The H2O content was calculated on the basis of structural data, which confirmed the occurrence of 18 H2O groups. The empirical formula, based on 42 oxygen atoms, is Al0.96Fe3.11S5.97O24⋅18H2O. X-ray maps, collected using the same analytical conditions reported for electron microprobe data, show the homogeneous distribution of Al and Fe within the grain studied (Fig. 2), which was associated closely with euhedral krausite, ideally KFe(SO4)2⋅H2O.

Fig. 2. Back-scattered electron image (a) and X-ray maps for Al (b) and Fe (c) of coquimbite (Coq) associated with krausite (Kra) from Monte Arsiccio.
Micro-Raman and infrared spectroscopies
Micro-Raman spectrum of coquimbite (Fig. 3) was collected on an unpolished sample using a Horiba Jobin-Yvon XploRA Plus apparatus, with a 10× objective lens and the 532 nm line of a solid-state laser attenuated to 10% (i.e. 2.5 mW) in order to minimise sample damage. The spectrum was collected through multiple acquisitions with single counting times of 60 s. Back-scattered radiation was analysed with a 1200 grooves per cm grating monochromator. The spectral features fully agree with the results of Frost et al. (Reference Frost, Žigovečki Gobac, López, Xi, Scholz, Lana and Fernandes Lima2014). The strongest band occurs at 1024 cm–1 and is due to the ν 1 mode of the SO4 groups. Three low intensity bands at 1199, 1163, and 1096 cm–1 can be assigned to the antisymmetrical stretching mode ν 3 of SO4 groups. The bending mode of SO4 groups are represented by bands at 507, 456 (ν 2 mode) and 597 cm–1 (ν 4 mode). Lattice, Fe-O and Al-O vibration modes are observed at 311, 283, 255, 209, 181 and 150 cm–1. Broad and intense Raman bands are observed in the region between 3600–2900 cm–1. These Raman bands at 3577, 3423, 3179 and 2997 cm–1, can be attributed to the stretching vibration mode of O–H bonds.

Fig. 3. Raman spectrum of coquimbite from Monte Arsiccio and band interpretation.
Unpolarised Fourier transfer infrared absorption spectra of coquimbite (Fig. 4) were measured on powdered sample material mixed with KCl and pressed to a pellet. A Bruker Vertex spectrometer equipped with a Globar source, a KBr beam-splitter, an MCT detector, and a Hyperion 2000 microscope was used to acquire spectra in the wavenumber range 4000–600 cm–1 with a resolution of 4 cm–1. The spectrum shows strong similarities with that of Frost et al. (Reference Frost, Žigovečki Gobac, López, Xi, Scholz, Lana and Fernandes Lima2014), with a strong absorption band with some shoulder features in the 3700–2900 cm–1 range caused by O–H stretching motions, a distinctive band at 1655 cm–1 due to the H2O bending mode, and a number of more narrow bands in the range 1200–1000 cm–1 that can be attributed to antisymmetric and symmetric stretching modes of SO4 groups.

Fig. 4. Fourier-transfer infrared (FTIR) spectrum of coquimbite from Monte Arsiccio.
Single-crystal X-ray diffraction and crystal-structure refinement
X-ray diffraction intensity data were collected using a Bruker Smart Breeze diffractometer (50 kV and 30 mA) equipped with a Photon II CCD detector. Graphite monochromatised MoKα radiation was used. The detector-to-crystal working distance was 50 mm. A total of 654 frames were collected using φ and ω scan modes with an exposure time of 10 s per frame. The data were integrated and corrected for Lorentz-polarisation, background effects and absorption, using the Apex3 software package (Bruker AXS Inc., 2016), resulting in a set of 16,979 reflections. The refined unit-cell parameters are a = 10.9318(12), c = 17.069(2) Å and V = 1766.6(4) Å3. The statistical tests on |E| values and systematic absences indicated the space-group symmetry P  $\bar{3}$1c. The crystal structure of coquimbite was refined using Shelxl-2018 (Sheldrick, Reference Sheldrick2015) starting from the atomic coordinates given by Demartin et al. (Reference Demartin, Castellano, Gramaccioli and Campostrini2010a). Taking into account the results of the electron microprobe analysis, the site scattering at the three metal sites was modelled using the following scattering curves, taken from the International Tables for Crystallography (Wilson, Reference Wilson1992): Al vs. Fe at the Al site; Fe at the Fe(1) and Fe(2) sites; and S at the S site. The scattering curve of O and H were used at all the O and H positions, respectively. Although the hydrogen coordinates have been given in previous studies (e.g. Demartin et al., Reference Demartin, Castellano, Gramaccioli and Campostrini2010a), their positions were sought in the difference-Fourier maps. Soft restraints were used in order to avoid O–H distances that were too short. An anisotropic model for all the atom positions (except for H atoms) converged to 0.0219 for 1307 reflections with F o>4σ(F o) and 110 refined parameters. Details of data collection and refinement are given in Table 2. Atomic coordinates and isotropic or equivalent isotropic displacement parameters for coquimbite are given in Table 3, and selected bond distances are given in Table 4. In agreement with the previous studies, the crystal structure of coquimbite is characterised by the occurrence of clusters of composition [FeFe2(SO4)6(H2O)6]3- and by isolated [Al(H2O)6]3+ octahedra. Six symmetry-related H2O groups, held in the structure through H-bonding only, are arranged in a cyclohexane-like chair conformation (e.g. Demartin et al., Reference Demartin, Castellano, Gramaccioli and Campostrini2010a). Table 5 reports the geometrical features of the H-bonds, whereas Table 6 gives the bond-valence balance. The crystallographic information files have been deposited with the Principal Editor of Mineralogical Magazine and are available as Supplementary material (see below).
Table 2. Summary of crystal data and parameters describing data collection and refinement for coquimbite.
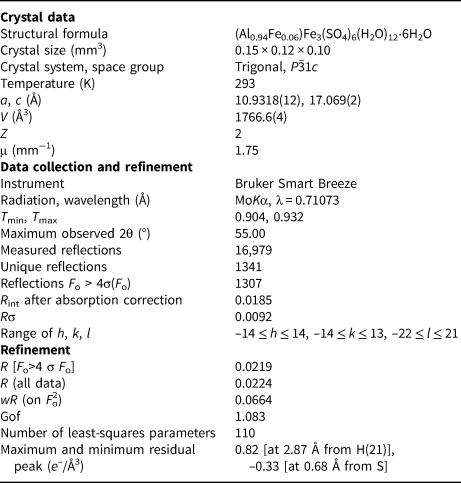
Weighting scheme is defined as w = 1/[σ2(F o2)+ (aP)2 + bP], where P = [2F c2 + Max(F o2,0)]/3. The a and b values are 0.0293 and 2.3592, respectively.
Table 3. Sites, Wyckoff positions, site occupancy factors (s.o.f.), fractional atom coordinates and isotropic (*) or equivalent isotropic displacement parameters in coquimbite.

Table 4. Selected bond distances (Å) in coquimbite.

Table 5. Hydrogen-bond lengths (d in Å) and angles (in °) for coquimbite.

D – donor; A – acceptor.
Table 6. Bond-valence sums (in valence units) for coquimbite.*
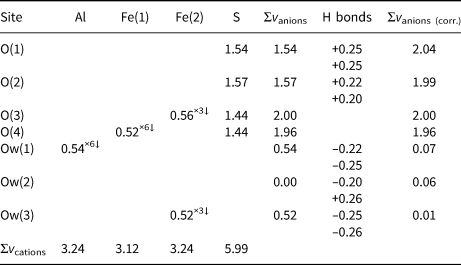
* The number of equivalent bonds involving anions are indicated by ×↓. Bond parameters after Brese and O'Keeffe (Reference Brese and O'Keeffe1991). The bond-valence sums at the anion sites were corrected taking into account O⋅⋅⋅O distances (see Table 5) and the relationship of Ferraris and Ivaldi (Reference Ferraris and Ivaldi1988).
Discussion and conclusion
On the basis of the examination of previous mineralogical investigations as well as of new crystal-chemical data, coquimbite has been redefined as AlFe3(SO4)6(H2O)12⋅6H2O (Z = 2). Neotype material can be considered the sample studied by Fang and Robinson (Reference Fang and Robinson1970) from the Tierra Amarilla (the original type locality described by Rose, Reference Rose1833) and stored in the National Museum of Natural History (Smithsonian Institution, USA; catalogue number 12548). The sample from Monte Arsiccio studied in this work, embedded in epoxy and polished, is kept in the mineralogical collection of the Museo di Storia Naturale of the University of Pisa, Italy, under catalogue number 19914.
In order to be compared with coquimbite, the chemical formulae of paracoquimbite and aluminocoquimbite are given as Fe4(SO4)6(H2O)12⋅6H2O (Z = 6) and Al2Fe2(SO4)6(H2O)12⋅6H2O (Z = 2), respectively (Table 7).
Table 7. Coquimbite and related minerals.

Coquimbite and paracoquimbite are characterised by homeotypic structures, being formed by the same [FeFe2(SO4)6(H2O)6]3– clusters and isolated Me 3+(H2O)6 (Me = Al, Fe) octahedra (Fig. 5a,b). Consequently, they fit with the definition of mineral group given by Mills et al. (Reference Mills, Hatert, Nickel and Ferraris2009): “A mineral group consists of two or more minerals with the same or essentially the same structure, and composed of chemically similar elements”. They form the ‘coquimbite group’. Aluminocoquimbite is characterised by a different topology, with infinite heteropolyhedral columns running along [001] (Fig. 5c,d), similar to those observed in ferrinatrite, Na3(H2O)3[Fe(SO4)3] (Ventruti et al., Reference Ventruti, Della Ventura, Lacalamita, Sbroscia, Sodo, Plaisier, Cinque and Schingaro2019; Yang and Giester, Reference Yang and Giester2019). Consequently, aluminocoquimbite does not belong to the coquimbite group.

Fig. 5. The crystal structure of coquimbite, as seen down c (a). It is formed by finite clusters composed by Fe-centred octahedra and SO4 groups (b). Aluminocoquimbite shows a different topology (c) and its crystal structure is characterised by infinite columns, running along c, formed by Fe-centred octahedra and SO4 groups (d). Iron-, Al-, and S-centred polyhedra are shown in brown, blue, and yellow, respectively. Hydrogen atoms are shown as pink spheres, whereas O atoms are shown as red or, if belonging to H2O groups, as light blue spheres.
As coquimbite is an Al-bearing compound, whereas paracoquimbite is Al-free, it is likely that the presence of Al stabilises the coquimbite structure, whereas its absence favours the crystallisation of paracoquimbite, in agreement with Majzlan et al. (Reference Majzlan, Dordević, Kolitsch and Schefer2010). Higher Al content promotes the crystallisation of aluminocoquimbite. However, Giester and Miletich (Reference Giester and Miletich1995) were able to synthesise Fe4(SeO4)3(H2O)12⋅6H2O with the coquimbite structure. Therefore, should the natural sulfate analogue of synthetic Fe4(SeO4)3(H2O)12⋅6H2O be discovered, the name ‘ferricoquimbite’ is suggested.
Acknowledgements
Mario Bianchini and Massimo D'Orazio are thanked for providing us with the specimens of coquimbite from the Monte Arsiccio mine. CB acknowledges financial support from the University of Pisa through the project P.R.A. 2018–2019 “Georisorse e Ambiente” (Grant No. PRA_2018_41). Peter Leverett, two anonymous reviewers, and the Associate Editor František Laufek are acknowledged for their comments and corrections.
Supplementary material
To view supplementary material for this article, please visit https://doi.org/10.1180/mgm.2020.15


