1. Introduction
Gross Domestic Product (GDP) has been regularly criticised for being a poor indicator of social welfare. As is well known, and as famously illustrated by Robert Kennedy in 1968 with his remark that GNPFootnote 1“measures everything in short, except that which makes life worthwhile”, GDP statistics measure current economic activity, but ignore inequalities in income and wealth, destruction of the natural environment, longevity, or the quality of social relations. It is not a comprehensive measure of well-being or even economic welfare, although Bobby Kennedy was probably going too far by suggesting that it does not include anything that people value. Many features of what makes life worth living such as travel, culture and education are included. Nevertheless, in 2014 the UK Office for National Statistics (ONS) started counting prostitution and illegal drugs in the National Accounts, in line with international standards; a paradox to some given that childcare or other work in the home is not included.
GDP is a measure of economic output. Even though GDP was never intended to be a measure of welfare, it is nevertheless regularly used as one, perhaps reflecting the obvious need for a measure of welfare. The practical importance of measure(s) of social welfare cannot be overstated. Policy choices by government, and ultimately society, cost-benefit analyses, measures of growth and inequality, cross-country comparisons all refer to evaluations of individual and collective well-being.
It is sometimes argued that changes in GDP are highly correlated with changes in economic well-being, but this misses the point that if what you measure is important, then by not actually measuring something it will not receive so much attention. The Stiglitz-Sen-Fitoussi Commission established by the French government in 2008 argued that the emphasis of our measurement system should shift “from measuring economic production to measuring people's well-being.”Footnote 2 As well as making recommendations related to dimensions of economic welfare such as income, consumption, and wealth, the report also made recommendations related to the measurement of broader ‘Quality of Life’ aspects of well-being such as health and social connectedness. They also recommended a dashboard approach, arguing that well-being has many dimensions and does not lend itself to one headline number.
This paper is not intended as a comprehensive survey of the current methods for measuring welfare, although I provide an overview of some of the key developments in the measurement of GDP and welfare in the next section. It instead focuses primarily on some recent papers presented at the second annual conference on economic measurement held in London by the Economic Statistics Centre of Excellence (ESCoE) in May 2019.Footnote 3 Three main areas are discussed. First, the importance of considering the distribution of income (or consumption or wealth). Second, measuring time use has long been recognised as a way of accounting for unpaid household production. The digital revolution is changing the boundary between production and consumption, resulting in renewed efforts to use time use as a measure of welfare. Third, and related to the previous issue, are efforts to measure free and new goods produced in the digital economy. As both Mismeasuring our Lives (Reference Stiglitz, Sen and FitoussiStiglitz et al., 2009) and the follow up reports, Beyond GDP and For Good Measure (Reference Stiglitz, Fitoussi and DurandStiglitz et al., 2018a and Reference Stiglitz, Fitoussi and Durandb) relate, there are many other areas of work aimed at improving the measurement of social progress that are beyond the scope of the present paper. One of the most important is environmental sustainability, which is touched upon in a discussion of ‘dashboard’ well-being measures. One hopes that the next ESCoE annual Economic Measurement conference will feature papers about measurement in this critically important area.
2. Measuring GDP and welfare
Gross Domestic Product (GDP) measures the production in an economy and is the most widely used measure of economic activity.Footnote 4 Although GDP levels are correlated with many indicators of living standards, the correlation is not universal and improvements in GDP might not reflect gains experienced by a representative part of society. For example, real household income – an income measure which is more closely related to living standards – has evolved quite differently from GDP per capita growth in a number of OECD countries. Figure 1 shows the evolution of GDP per capita and median household income in the United States, which have diverged substantially since the 1980s. Too much emphasis on GDP can lead to misleading indications about how well-off people are and run the risk of leading to the wrong policy decisions.

Figure 1. Real GDP per capita and real median household income (United States)
GDP is a measure of mainly market production, and an advantage of market transactions is that they provide ‘objective’ prices that serve to value quantities of goods and services, making it possible to ‘add up’ different commodities. Reference WeitzmanWeitzman (1976) shows that in a world where all transactions take place in competitive markets and where economic well-being depends only on the consumption of marketed goods, changes in net domestic product (NDP, i.e. GDP adjusted for depreciation) are a good gauge of changes in economic well-being: this holds because an individual's or a country's ‘wealth’ can be viewed as the present discounted value of consumption. Under these conditions, NDP turns out to be like an interest payment (a ‘return’) on this wealth. This establishes – albeit under restrictive conditions – a direct link between NDP and economic well-being. It also constitutes the basic framework for considerations about sustainability.
In reality, prices for some goods and services might not exist, or if they do, might not reflect society's underlying valuation. For example, in the presence of externalities such as the environmental damage caused by production and consumption activities, GDP and other market-based measures will not track well-being. Defining prices and quantities in practice is also not always easy. Statisticians observe two variables: the value of transactions (i.e. the product of prices and quantities); and the prices for different types of products, which are used to construct price indices. These prices are usually used to ‘deflate’ values and to obtain a measure of ‘volume’ or ‘quantity’. Because the quality of many products changes over time – they disappear, or new features are added, or entirely new products emerge – constructing such indices is not straightforward. Capturing quality change correctly is a challenge for statisticians and yet it is vital to measure real income and real consumption, some of the key determinants of people's well-being. Under-estimating quality improvements is equivalent to over-estimating the rate of inflation and under-estimating real income.
Diane Coyle, in her book GDP A Brief but Affectionate History, traces the history of the creation of GDP. In the UK, Colin Clark calculated national income and expenditure statistics throughout the 1920s and 1930s, providing detailed splits into different categories, as well as detailed accounts of the government's finances. Applying these methods to the US was taken up by Simon Kuznets; the governments of both countries were eager to have data with which they could better understand the economy and means to escape from the Depression. Kuznets' first report, submitted to Congress in 1934, showed that America's national income had been halved between 1929 and 1932. Reference CoyleCoyle (2014) notes that Kuznets was interested in working out how to measure economic welfare rather than just output, suggesting that expenditure on weapons, advertising, and speculative financial activities, for example, should be subtracted from measures of national income. In the end Kuznets lost the argument to the imperative of wartime economists and the first Gross National Product (GNP) statistics for the US were published in 1942. The UK reached the same conclusion as US officials and Clark's approach was overtaken and extended by John Maynard Keynes in his 1940 pamphlet How to Pay for the War. Planning for the war required much better statistics about what resources were available, what would be required for mobilisation, and what would be left over for people to consume. In response to Keynes' pamphlet, the British Treasury commissioned two economists, Richard Stone and James Meade, to produce what became the first modern set of national accounts published in 1941 (HM Treasury, 1941). These focused on net national income, with GDP not appearing in the National Accounts until 1944. According to Reference StoneStone (1984), in 1941 Gruenbaum (Gaathon) published his National Income and Outlay in Palestine, 1936, which was also set in an accounting framework, and Van Cleeff in Holland published two papers on a system of national bookkeeping.
Economists (and others) have repeatedly cautioned that GDP is not and was not intended to be a measure of welfare. The noted business cycle and economic growth expert Moses Abramowitz said in 1959, “We must be highly sceptical of the view that long-term changes in the rate of growth of welfare can be gauged even roughly from changes in the rate of growth of output”. Despite such warnings it is often used by the public, policy makers, and economists as a proxy for welfare.
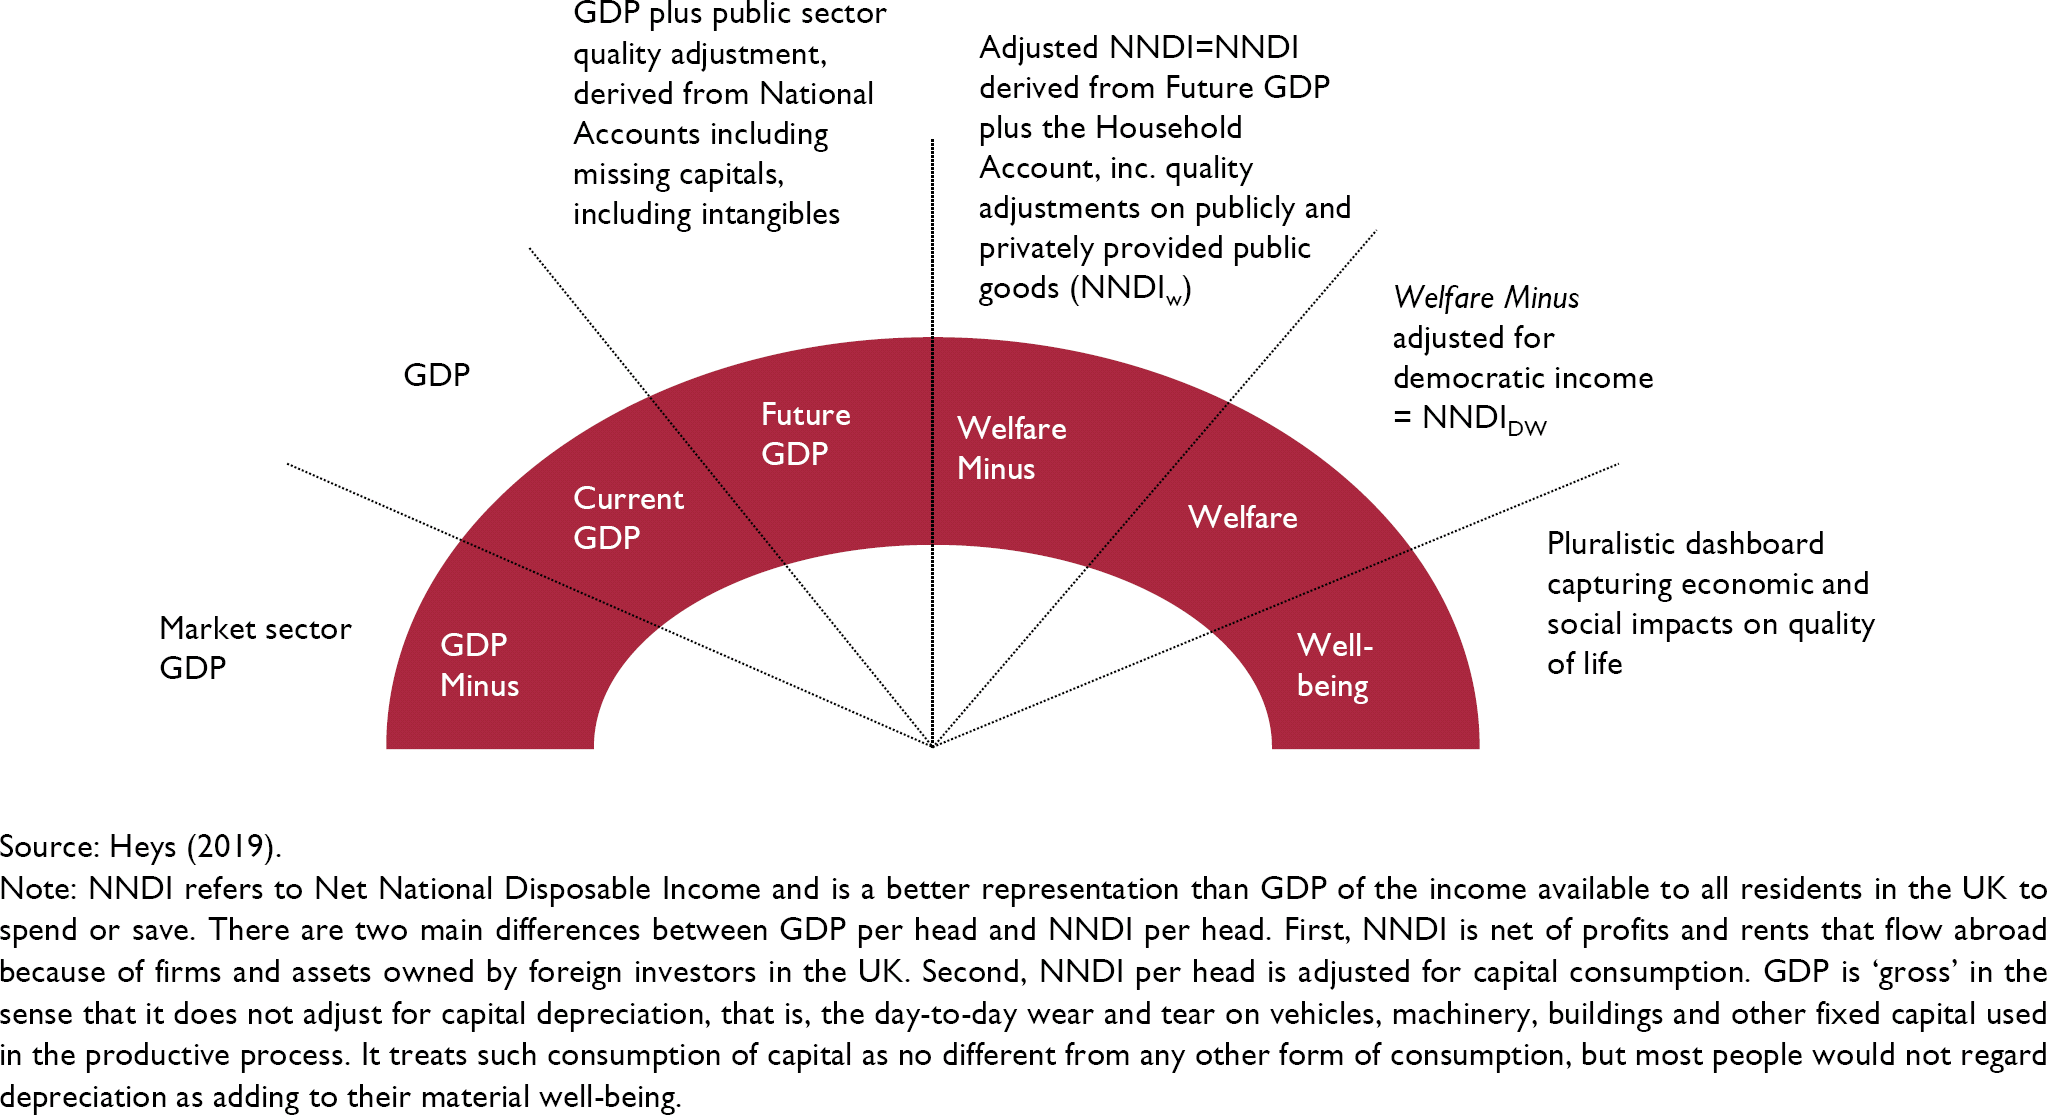
In considering alternatives to GDP, Reference HeysHeys (2019) presented a spectrum of theoretical options at the ESCoE conference on Economic Measurement 2019 (Reference Coyle and NakamuraEM 2019), as shown in figure 2, ranging from what he calls ‘GDP minus' to ‘Well-being’. On the left-hand side ‘GDP minus' refers to GDP consisting of purely market sector GDP, and ‘GDP’ refers to GDP as it is currently measured. ‘Future GDP’ consists of GDP plus an adjustment for public sector quality, as well as missing capitals, including intangibles. On the right-hand side of the spectrum, Heys presents ‘welfare minus', ‘welfare’, and ‘well-being’. ‘Welfare minus’ represents a further adjustment to ‘future GDP’, being net national disposable income (NNDI) plus the household account (unpaid household service).Footnote 5 ‘Welfare’ on Heys' spectrum is a further adjustment made to take into account the distribution of income, and finally ‘well-being’ suggests a dashboard that captures a range of social and economic aspects of the quality of life.

Figure 2. GDP and welfare: a spectrum of theoretical options
The spectrum presented by Reference HeysHeys (2019) suggests that GDP could be corrected, which is not without precedent. For example, Reference Nordhaus and TobinNordhaus and Tobin (1972) set out to compute a comprehensive measure of the annual real consumption of households, making several adjustments to GNP. Their Measure of Economic Welfare (MEW) classified all spending as consumption, investment, or intermediate. They also took account of the value of leisure and of household work, and the benefits of investment by consumers in capital goods, as well as correcting for what they called “the disamenities of urbanisation”. They showed the MEW had grown less rapidly than GNP in the United States but concluded that “although GNP and other national income aggregates are imperfect measures of welfare, the broad picture of secular progress which they convey remains after correction of their most obvious deficiencies” (Reference Nordhaus and TobinNordhaus and Tobin, 1972).
‘Well-being’ on Heys' spectrum hints at quality of life concepts that are broader than economic production and living standards that are the focus of this paper. One approach, developed in close relationship with psychological research, is based on the notion of subjective well-being (Reference Stiglitz, Sen and FitoussiStiglitz et al. 2009). This approach is closely linked to the utilitarian tradition but has a broader appeal due to the strong presumption in many streams of ancient and modern culture that enabling people to be ‘happy’ and ‘satisfied’ with their life is a universal goal of human existence. Another approach, the capability approach, due to Amartya Sen, has strong roots in notions of social justice. It also provides a theoretical foundation for several of the studies discussed here (see for example Reference SenSen, 1985).
Sen's capability approach represents a rejection of welfarism; he argues that a theory of welfare must be based on more than individual utilities. Rather than assessing the standard of living based on commodities, characteristics, or utility, it should be based on the freedom that a person has in terms of a choice of functionings, where these refer to what a person can achieve (such as being able to take part in the life of the community). He recognises that capabilities (for example the capability to be well-nourished, which may vary from person to person depending on their health) may generate utility but argues that it is the capability to function that comes closest to the notion of standard of living (Reference SenSen, 1985).
Mismeasuring our Lives recommended, for example, that statistical offices should collect data on subjective well-being, and measures should encompass different aspects such as cognitive evaluations of one's life, positive emotions such as joy and pride, and negative emotions such as pain and worry. They also conclude that information relevant to valuing quality of life goes beyond people's self-reports and perceptions to include measures of their functionings and freedoms. While the list of these inevitably rests on value judgements, there is a consensus that quality of life depends on people's health and education, their participation in the political process, the social and natural environment in which they live, and factors shaping their personal and economic security. Given the multi-dimensional nature of well-being, Mismeasuring our Lives recommended a ‘dashboard’ approach to measuring well-being.
Institutions such as the OECD and National Statistics Agencies have created various dashboards to advance this agenda considerably in recent years, for example the OECD produces a ‘better life’ index;Footnote 6 the ONS in the UK, and Statistics Netherlands are also producing dashboards. The OECD better life index is based on indicators reflecting eleven topics to be deemed as essential in ensuring material living standards. The ONS publishes a National Well-being dashboard covering a broader range of topics such as life satisfaction, happiness, healthy life expectancy, arts and culture participation, crime rates, and greenhouse gas emissions.Footnote 7
Reference Horlings and SmitsHorlings and Smits (2019) from Statistics Netherlands presented a more sophisticated dashboard approach at EM 2019 that not only takes account of the well-being of the present population, but also the well-being of future generations, and the well-being of people living in other countries. Their work also draws on Sen's capability approach for inspiration. In their approach well-being “here and now” draws on the attributes of individuals, the quality of the environment in which they live, their material welfare and subjective well-being. Well-being “later” considers the resources future generations will need to achieve at least the same level of well-being; and well-being “elsewhere”, the effects of decisions taken by people in a country on consumption and income and on the stock of capital goods in other countries. They explicitly decided against creating a composite measure and, interestingly, they disaggregate their indicators by sex, age, educational attainment and migration background. They also put significant resources into the visualisation of their dashboard (at present available in Dutch). They point out that there is currently no common language for the measurement and international comparison of well-being and sustainability.
The New Zealand government announced the world's first well-being budget in May 2019, which was the result of a different budget process and focused funding on six priority areas, including taking mental health seriously, improving child well-being, and supporting Mãori and Pasifika incomes, skills and opportunities. Underpinning this is work that has been done by the New Zealand Treasury since 2011 to develop a Living Standards Framework (LSF) (NZ Treasury, 2019). The LSF builds on the OECD approach to well-being and, similarly to the approach suggested by Reference Coyle and Benjamin Mitra-KahnCoyle and Mitra-Kahn (2017), it takes a dashboard approach framed around four capitals (natural capital, social capital, human capital, and financial/physical capital) as a way of organising indicators of long-term intergenerational well-being.Footnote 8 Asset based approaches such as these allow for the assessment of sustainability which is complementary to the measurement of current well-being or economic performance.
An alternative to a dashboard is to create a composite measure combining different dimensions of well-being together. An example of a long-running composite measure is the UN Human Development Index (HDI), inspired by the capability approach of Sen. Composite measures such as the HDI have been criticised for being essentially arbitrary; “mashup indices” in the parlance of Reference RavallionRavallion (2012). In contrast the approach of Reference Jones and KlenowJones and Klenow (2016) is grounded explicitly in the theory of social choice.
Reference Jones and KlenowJones and Klenow (2016), building on work by Reference Nordhaus and TobinNordhaus and Tobin (1972) propose a simple summary statistic combining data on consumption, leisure, inequality and mortality. Their measure of individual welfare is the lifetime utility from consumption and leisure, where lifetime utility is the product of life expectancy and the expected flow of utility from consumption and leisure. In their approach social welfare is the average of individual welfare functions for different age groups. The innovations in their approach are the inclusion of measures of inequality of goods and leisure and the incorporation of lifetime income. Jones and Klenow conclude that GDP per capita and their measure of welfare are highly correlated across a broad range of countries, with a correlation coefficient of 0.98. However, they also find that for any country the differences between the two measures can be high; across thirteen countries the median deviation is about 35 per cent.
3. Measuring welfare beyond GDP
The rest of this paper reviews some of the papers that were presented at EM 2019, and to some extent other related literature, focusing on three key aspects of the beyond GDP research agenda: distribution, time use, and free goods. Concern about distribution was highlighted in Reference PikettyPiketty's (2014) book on the income and wealth of the top 1 per cent, Capital in the Twenty-First Century. Work on creating distributional national accounts has since flourished. Reference Aitken and WealeAitken and Weale (2018) have developed a measure of household income growth that takes the distribution of income into account to create a democratic measure of income growth; while Reference Aitken and WealeAitken and Weale (2019), presented at EM 2019, allocate all income from the National accounts to households. Reference Aitken and OultonAitken and Oulton (2019) take a slightly different approach and develop cost of living indices for different types of households. Reference Fixler, Gindelsky and JohnsonFixler et al. (2019) produces new distributional measures for household income in the US. Reference WaltlWaltl (2019) creates distributional accounts for wealth for a selection of European countries; within the stream of work on distributional national accounts, wealth inequality has so far received relatively little attention.
Reference Payne and VassilevPayne and Vassilev (2019) presented work at EM 2019 on measuring time use, complementing work by Reference Coyle and NakamuraCoyle and Nakamura (2019). The importance, and potential value in measuring time use as a measure of welfare is partly driven by the effects of digitisation and the significant changes that internet use is bringing about in production and household activity.
Measuring the value of typically ‘free’ goods such as Facebook or Whatsapp, and new goods such as smartphones, is a rapidly growing area of research. Other services that are generally free at the point of use and difficult to measure are government services. New measurement efforts in this area were presented by Erik Brynjolfsson at EM 2018, and by Kevin Fox at EM 2018 and 2019. Significant progress has been made since the publication of a review into the measurement of government services by Tony Atkinson in 2005, and the paper by Reference Foxton, Grice, Heys and LewisFoxton, Grice, Heys and Lewis (2019) reviews the progress that has been made since then.
3.1 Average is over: well-being and the distribution of income
The theme of the 2013 book Average is Over by the economist Tyler Cowen, is that the United States continues to produce more millionaires and billionaires than ever before, yet since the Great Recession three quarters of the jobs created in the US pay only marginally more than the minimum wage. If it's the case that growth in income is only occurring at the top of the distribution, then it's easy to see why measures of growth in average income, or average GDP per capita could fail to represent adequately the experience of most people.
While there are aspects of well-being that encompass measurement that lie outside the boundaries of the System of National Accounts, there are aspects that can be incorporated into the SNA framework. The idea of creating Distributional National Accounts (DINA), is not new, in fact it was pioneered by Reference KuznetsKuznets (1955) who stressed the importance of understanding the distribution and combined tabulated income data with national income series. There was also some information about the distribution of private incomes in the 1940–41 UK National Income and Expenditure Accounts (HM Treasury, 1941). Reference PikettyPiketty (2003) revived the work of Kuznets for France, and this was extended to the US (Reference Piketty and SaezPiketty and Saez, 2003) and the UK (Reference AtkinsonAtkinson, 2005b). The focus of this work was to measure top income shares over time and led to the creation of The World Top Incomes Database (WTID), which was more recently transformed into the WID.world (Reference Alvaredo, Atkinson, Piketty, Saez and ZucmanAlvaredo et al., 2017) database with an extended focus on income and wealth. While this early work focused on top income shares, more recently attention has turned to examining the entire income distribution, which is important, given that income accruing to the very top of the distribution says virtually nothing about what is happening to the bulk of the distribution. Reference Garbinti, Groupille-Lebret and PikettyGarbinti et al. (2018) compile DINA for national income in France spanning the period 1900 to 2014; Reference Fixler, Johnson, Jorgenson, Landefeld and SchreyerFixler and Johnson (2014) and Reference Fixler, Johnson, Furlong and CraigFixler et al. (2017) compile such break-downs for the US.Footnote 9
There are also recent attempts to compile the joint distribution of income, consumption and wealth – sometimes referred to as ‘3D’ (see for example Reference Jäntti, Sierminska and Van KermJäntti et al., 2015; Reference Johnson, Fisher, Smeeding and ThompsonJohnson et al., 2018) where this provides a more holistic view of households' well-being and where analysis of the joint distribution might help better understand the mechanisms that lead to a particular distribution of income, consumption and wealth. This was also one of the recommendations of Mismeasuring Lives.
Although measures of social welfare are excluded from the national accounts, welfare measurement is well established in both economic theory and economic measurement. Reference Jorgenson and SchreyerJorgenson and Schreyer (2017) summarise many of the issues that arise in measuring individual and social welfare.Footnote 10 One question relates to the choice of the unit of measurement; individual or household. Most survey data on consumption, income and wealth is collected at household level, and methods exist to combine the preferences of individual household members into a household welfare function. Household equivalence scales are commonly used to adjust household metrics for the size and composition of households to enable comparison of different households. Much micro-economic work has focused on household consumption as a guide both to welfare and to inequality. It is argued that consumption may be a better guide to lifetime income than is actual income at any point in time. Nevertheless, as Reference Sefton and WealeSefton and Weale (2006) show, income measures lifetime welfare accruing and, for policy purposes that may also be of interest.
A theoretical obstacle to measuring welfare is a long-standing argument that it is impossible. It also requires value judgements about equity that economists have frequently shied away from. The most challenging aspect of measuring social welfare is making inter-personal or inter-household comparisons due to the idea that preferences are not comparable. This argument was formalised by Reference ArrowArrow (1963) in his famous “impossibility” theorem for social choice. Reference SenSen (1970) significantly broadened the scope of welfare measurements by mapping out the alternatives to the traditional assumptions of ordinal measures of individual welfare that are not comparable among individuals. This led to an explosion of research on ‘possibility theorems’ during the following decade. More recently, Reference Fleurbaey and ManiquetFleurbaey and Maniquet (2011) reconcile the measurement of social welfare with Arrow's impossibility theorem.
Reference Fixler, Gindelsky and JohnsonFixler et al. (2019), building on earlier work by Reference Fixler, Johnson, Jorgenson, Landefeld and SchreyerFixler and Johnson (2014) and Reference Fixler, Johnson, Furlong and CraigFixler et al. (2017) have tried to develop a distribution of personal income using survey data in the US. The more recent paper, presented at the ESCoE 2019, develops their approach further by using survey data, tax records, and administrative data for 2007 and 2012. In contrast to Reference Piketty, Saez and ZucmanPiketty, Saez and Zucman (2018) and Reference Aitken and WealeAitken and Weale (2019), their goal is to create a distribution for personal, rather than national income. Personal income is the income received from government and business transfers, and from holding interest-bearing securities and corporate stocks. They start with data from the Current Population Survey (CPS). They then use federal income tax data to fit a Pareto distribution for tax units with money incomes of at least $500,000. Finally, they distribute all of the income in the national accounts to households.
Reference Aitken and WealeAitken and Weale (2019), similarly to Reference Piketty, Saez and ZucmanPiketty, Saez and Zucman (2018) (PSZ), allocate the whole of national income to a sample of individual households, but unlike PSZ they take a stochastic approach to the imputation of missing data in the household surveys and construct a democratic measure of income growth that gives equal weight to every household. A further difference from PSZ (2018) is that they structure their distributional national accounts around individual rather than household income. Reference Aitken and WealeAitken and Weale (2018) present the theory behind a democratic measure of income and produce estimates for household income in the UK. Reference Aitken and WealeAitken and Weale (2019) start with a household survey, the Living Costs and Food Survey (LCFS); however there are two main reasons why survey data on its own is inadequate. First, not all national income accrues to households; for example there is income accruing to non-profit institutions serving households (NPISH), occupational pension income, and government spending. Second, there are often large discrepancies between aggregate national accounts totals and totals in household surveys, as Reference TonkinTonkin (2015) and Reference Brewer, Etheridge and O'DeaBrewer, Etheridge, and O'Dea (2017) have shown in the UK, and Fesseau and Matteonetti (2013) demonstrate internationally.
Reconciling national accounts data with household survey data is often done by scaling micro data to control totals from the National Accounts, however any misreported zeros in the micro data will remain as zeros. As Reference Aitken and WealeAitken and Weale (2019) show, this is a very material issue for interest and dividend income in the LCFS; the proportion of zeros is much higher for taxpayers in the LCFS compared to that reported in the Survey of Personal Incomes.Footnote 11 In this situation scaling would exacerbate the degree of inequality. We have a situation where some of the observations in the household survey are faulty, but we do not know which ones. Reference Piketty, Saez and ZucmanPiketty, Saez, and Zucman (2018) suggest drawing on other sources, providing the data they contain is better than the core data. However, if imputation is carried out based on covariates which are observed in both the core data and the alternative source, then there must be a need for a stochastic term to represent the random variation between the relevant covariates and the data of interest. If only arithmetic averages were of interest then neglecting the stochastic term would not be an issue, however we are specifically interested in distributional issues.
Reference Aitken and OultonAitken and Oulton (2019) take a different approach to Reference Aitken and WealeAitken and Weale (2019) by calculating Konüs price indices for different household types based on household expenditure data. A Konüs price index, also known as a true cost-of-living index, measures the additional income needed to keep the utility of a household constant following a change in prices. This contrasts with a traditional price index like the Laspeyres which measures the additional income required to purchase the original basket of goods in the two situations being compared.
Reference Aitken and OultonAitken and Oulton (2019) assume non-homotheticity; i.e. holding prices constant, the share of expenditure on food, for example falls as income rises. In the presence of homotheticity there is no unique answer to the question, by how much must income increase to keep utility constant, since the answer depends on the initial utility level of the household under consideration. Consider for example an income poor household spending a large proportion of its income on food and a rich household spending a much smaller proportion. If there is a large increase in the price of food, and if both households face the same prices, the proportional increase in income needed by the poor household to enable it to buy the same basket of goods as before will be much larger than the proportional increase faced by the poor household. For both households a Konüs price index measures the change in expenditure needed to keep utility constant while allowing for the possibility of substitution away from more expensive food towards now relatively cheaper goods which cushions the effect of the food price rise.
This work draws on Reference OultonOulton (2008, Reference Oulton2012) and shows that rather than having to estimate a complete system of demand with potentially thousands of parameters requiring estimation, it is possible to use household level data on 87 expenditure categories and calculate only the income elasticity of demand for each product. Their preliminary results suggest that single adults with or without children, and couples without children saw real income fall, for couples with children real incomes stagnated, and only retired people saw real income rising.
While research on creating DINA for income is now well established, there is relatively less work on the distribution of wealth. Reference WaltlWaltl (2019) starts to fill this gap and presented work at EM 2019 on creating distributional national accounts for wealth for one year for Austria, Finland, France, Germany and Spain. She proposes a hybrid DINA consisting of an integrated account containing data from the national accounts that can be linked to micro data providing information on the distributional structure; and a supplement account that includes further variables necessary to obtain a comprehensive measure of total wealth but that are not currently linkable to micro data. She uses the Household Finance and Consumption Survey (HFCS) as the main source of micro data, adding data from country rich lists, and data on tax wealth shares obtained from the WID.world database, to adjust the top tail of the survey data.
3.2 If women counted: measuring time use
In her 1988 book Counting for Nothing: what men value and what women are worth, the New Zealand academic and politician Marilyn Waring drew attention to the deficiency of using GDP as a measure for progress, as it made women invisible within national accounting systems by failing to account for unpaid work in the home. As agreed internationally within the System of National Accounts, the value of unpaid household work is excluded from GDP as it falls outside the ‘Core Production Boundary’. There is however a ‘Household Satellite Account’ which is used to value unpaid work. Recent work from the ONS by Reference Payne and VassilevPayne and Vassilev (2019) argues that a full measure of economic welfare can be largely accounted for through time-use measurement. As shown in figure 3, the household satellite account valued unpaid work at £1 trillion in 2016, of which more than half was childcare, housework, and adult care. In the same year GDP was approximately £1.8 trillion. The ONS started producing estimates of unpaid household work from mid-2015 using a variety of alternative approaches that do not rely on time use data. For example, clothing and laundry services are estimated based on a survey suggesting that each household carries out 260 wash loads per year on average (ONS, 2016).

Figure 3. Unpaid work not included in GDP for the year 2016 in the UK
The digital economy has given rise to new forms of unpaid household production where households are using the internet to provide themselves with services that were previously provided by people in paid employment, for example travel agents. The changing boundaries between leisure, paid work and unpaid household activity make a focus on time use more pertinent. Because of smartphones and improved broadband internet capabilities, people are spending increasing amounts of time online, carrying out banking transactions, accessing entertainment, booking travel, ordering food, for example. The internet has reduced the marginal monetary price of many goods to zero, such that time costs, rather than transaction costs, as measured in GDP, increasingly determine people's choices.
An alternative to measuring time use in different activities itself, is to measure well-being in the dimension of time, which is the focus of Reference Coyle and NakamuraCoyle and Nakmura (2019). They discuss two approaches that could be combined to give a monetary or cardinal measure of welfare. One is derived from a labour-leisure model of the type developed by Gary Becker and others. In its simplest form, the average utility of leisure time is estimated by the average productivity of work, so total utility is equal to the wage times work plus non-work hours. Reference BeckerBecker (1965) added household production and consumption, and since then various authors have suggested other ways to extend the model, for example adding intra-household bargaining (Reference Cherchye, De Rock and VermeulenCherchye et al, 2012), the Internet (Reference Goolsbee and KlenowGoolsbee and Klenow, 2006), and age (Reference DeatonDeaton, 2018).
Another approach relies on subjective measures of well-being such as happiness, or the measure of ‘objective’ utility that Reference Kahneman, Kahneman, Diener and SchwartzKahneman (1999) describes as being based on real-time estimates of pleasure and pain, as distinct from subjective measures that ask about the enjoyability of past events. Reference Coyle and NakamuraCoyle and Nakamura (2019) suggest linking these two approaches as digitalisation of the economy transforms the time people are spending in different activities to which they attach different degrees of well-being.
How we feel while working, doing leisure activities, or production activities at home encompasses all our possibilities for well-being. Reference Coyle and NakamuraCoyle and Nakamura (2019) suggest that asking people how they feel as they spend time is potentially more equitable given that everyone faces the same budget constraint of 24 hours in the day; in contrast observations of consumption, or willingness to pay are skewed by how much income they have (Reference Coyle and NakamuraCoyle and Nakamura, 2019). Having said this, income and wealth will also affect the time that people have because they may work longer hours in more physically demanding jobs, for example that reduces their non-work hours or reduces their capability to use non-work hours for enjoyable things. Higher income people also have the capability to ‘buy’ more time by employing cleaners for example.
Reference Coyle and NakamuraCoyle and Nakamura (2019) argue that despite several complexities in measuring well-being by utility over time, to a first approximation it is possible to think of time reductions (holding output constant) in paid labour and home production as an improvement in welfare. Conversely, increases in time working (holding output constant) are welfare decreasing. This assumes that for either paid or unpaid work, the object being produced is the major purpose of that time. For leisure, the assumption is the opposite; to a first approximation, the more time allocated to a leisure activity, the better. Holding income constant implies that a monetary measure is required, but how far it is possible to proceed down this route of creating a monetary welfare measure is an empirical question. Reference Krueger, Kahneman, Schkade, Schwartz, Stone and KruegerKrueger et al. (2009) argue that it is feasible, although they do not do this.Footnote 12 Coyle and Nakamura want to be able to assign shadow prices to people's feelings and happiness and therefore to different uses of time. One possible way to do this is to ask survey participants directly about their shadow value of time, as Reference Brynjolfsson, Eggers and GannamaneniBrynjolfsson et al. (2018) ask about the monetary value of different digital consumption/leisure activities, thereby introducing monetary scales of utility in the evaluation of goods, asking both how much subjects would be willing to pay for a given amenity or how much they would be willing to accept to go without the amenity. This contingent valuation approach contrasts with the more usual approach to self-reporting utility in the well-being literature based on arbitrary scales. Happiness studies, for instance, ask subjects to report how they rate their lives on a scale of 0 to 10 (Cantril scale) with respect to the best possible life they could be leading. Coyle and Nakamura suggest that surveys could ask people what they would be willing to pay for an extra day's holiday, provided their workload was reduced, or what would they have to be paid to work an extra day, assuming their workload is not reduced, for example. Responses to these types of questions could then be related to wage rates and the measured, experienced utility of labour.
Both Payne and Vassilev and Coyle and Nakamura make plain the limitations of existing time use data, and the need for updated and more frequent time use surveys. The ONS has conducted two time use surveys in the UK, once in 2000 and again in 2014. Payne and Vassilev point out the limitations of classical time use surveys, the high cost, the sparse population coverage and the ability of activity coding to cope with full measurement of economic welfare in a modern digital economy. They suggest several methods for improvement, such as making use of natural language processing algorithms that can be used to categorise automatically own-word time use diaries. Devices such as a location tracker or even a smartphone can supplement a time-use survey's activity data and automate the location and co-presence information therefore reducing respondent burden.
More conceptually, there remain questions over whether a single dimensional measure such as happiness is the best way to measure episodic utility, and whether multidimensional feelings can be placed in a single monetary metric. A further issue is whether self-reports associated with particular activities are relatable to self-reports of overall happiness such as Cantril scales. If Cantril scales can be related to log measures of income, then there is the possibility that meaningful monetary values can be applied to specific activities.
3.3. Old goods, new goods and free goods
There is a significant current debate about measuring the impact on welfare of free digital goods. Alongside this, is a larger group of transactions which are also free, or nearly free at the point of use – public services. One of the possible adjustments to GDP suggested by Reference HeysHeys (2019) is to incorporate welfare adjustments for private and publicly provided free goods.
The Atkinson Review (Reference AtkinsonAtkinson, 2005a) was commissioned by the ONS to conduct an independent review of the measurement of government output in the National Accounts. In a paper presented at EM 2019, Reference Foxton, Grice, Heys and LewisFoxton et al. (2019) review the key issues and lessons learnt from a decade of attempting to apply the Atkinson principles. Measuring public sector output is not straightforward, as most outputs, such as health and education, are non-market services.
In contrast, most transactions included in GDP are measured at their market or exchange value. Omitting public service output (and productivity) would be to ignore a large part of the value (and welfare) generated in the economy. While Kuznets proposed excluding public service outputs from the national accounts entirely, a consensus emerged for including these using the so-called ‘output equals inputs’ convention. Non-market outputs were deemed to be equal to the observable value of the inputs used to produce them; the implication being that public service total factor productivity is always constant, with a growth rate of zero by definition.
Reference AtkinsonAtkinson (2005a) agreed with the 1993 SNA that it was right to move away from the ‘output equals inputs’ approach and diagnosed that problems that had emerged since the 1990s arose from the lack of a principled framework. He proposed nine key principles for reform, including the idea that government non-market output should be measured based on value added, which the ONS has moved towards implementing.
There is currently a discordance in international standards, the 2008 SNA encourages quality adjustment of measures of non-market goods, but by contrast the ESA2010 (European System of Accounts) explicitly prevents the inclusion of quality adjustments of public services in the National Accounts. This means that National Accounts in the UK are not quality adjusted (but public service productivity statistics are quality adjusted). Figure 4, from Reference Foxton, Grice, Heys and LewisFoxton et al. (2019), shows the output-type share by service area for 2015 for the UK. The ‘output equals inputs’ approach still accounts for about 38 per cent of public service output (largely Defence, Police, other government services such as economic affairs, recreation and housing), ‘quantity output’ represents a further 18 per cent of public service output, and about 45 per cent is quality adjusted output. The ‘quantity output’ approach represents a second-best approach and includes small proportions of education and healthcare, adult social care, and SSA.Footnote 13 Quality adjusted output is adjusted to take account of changes in quality, in line with the recommendations of the Atkinson Review; this currently covers most of education and healthcare.
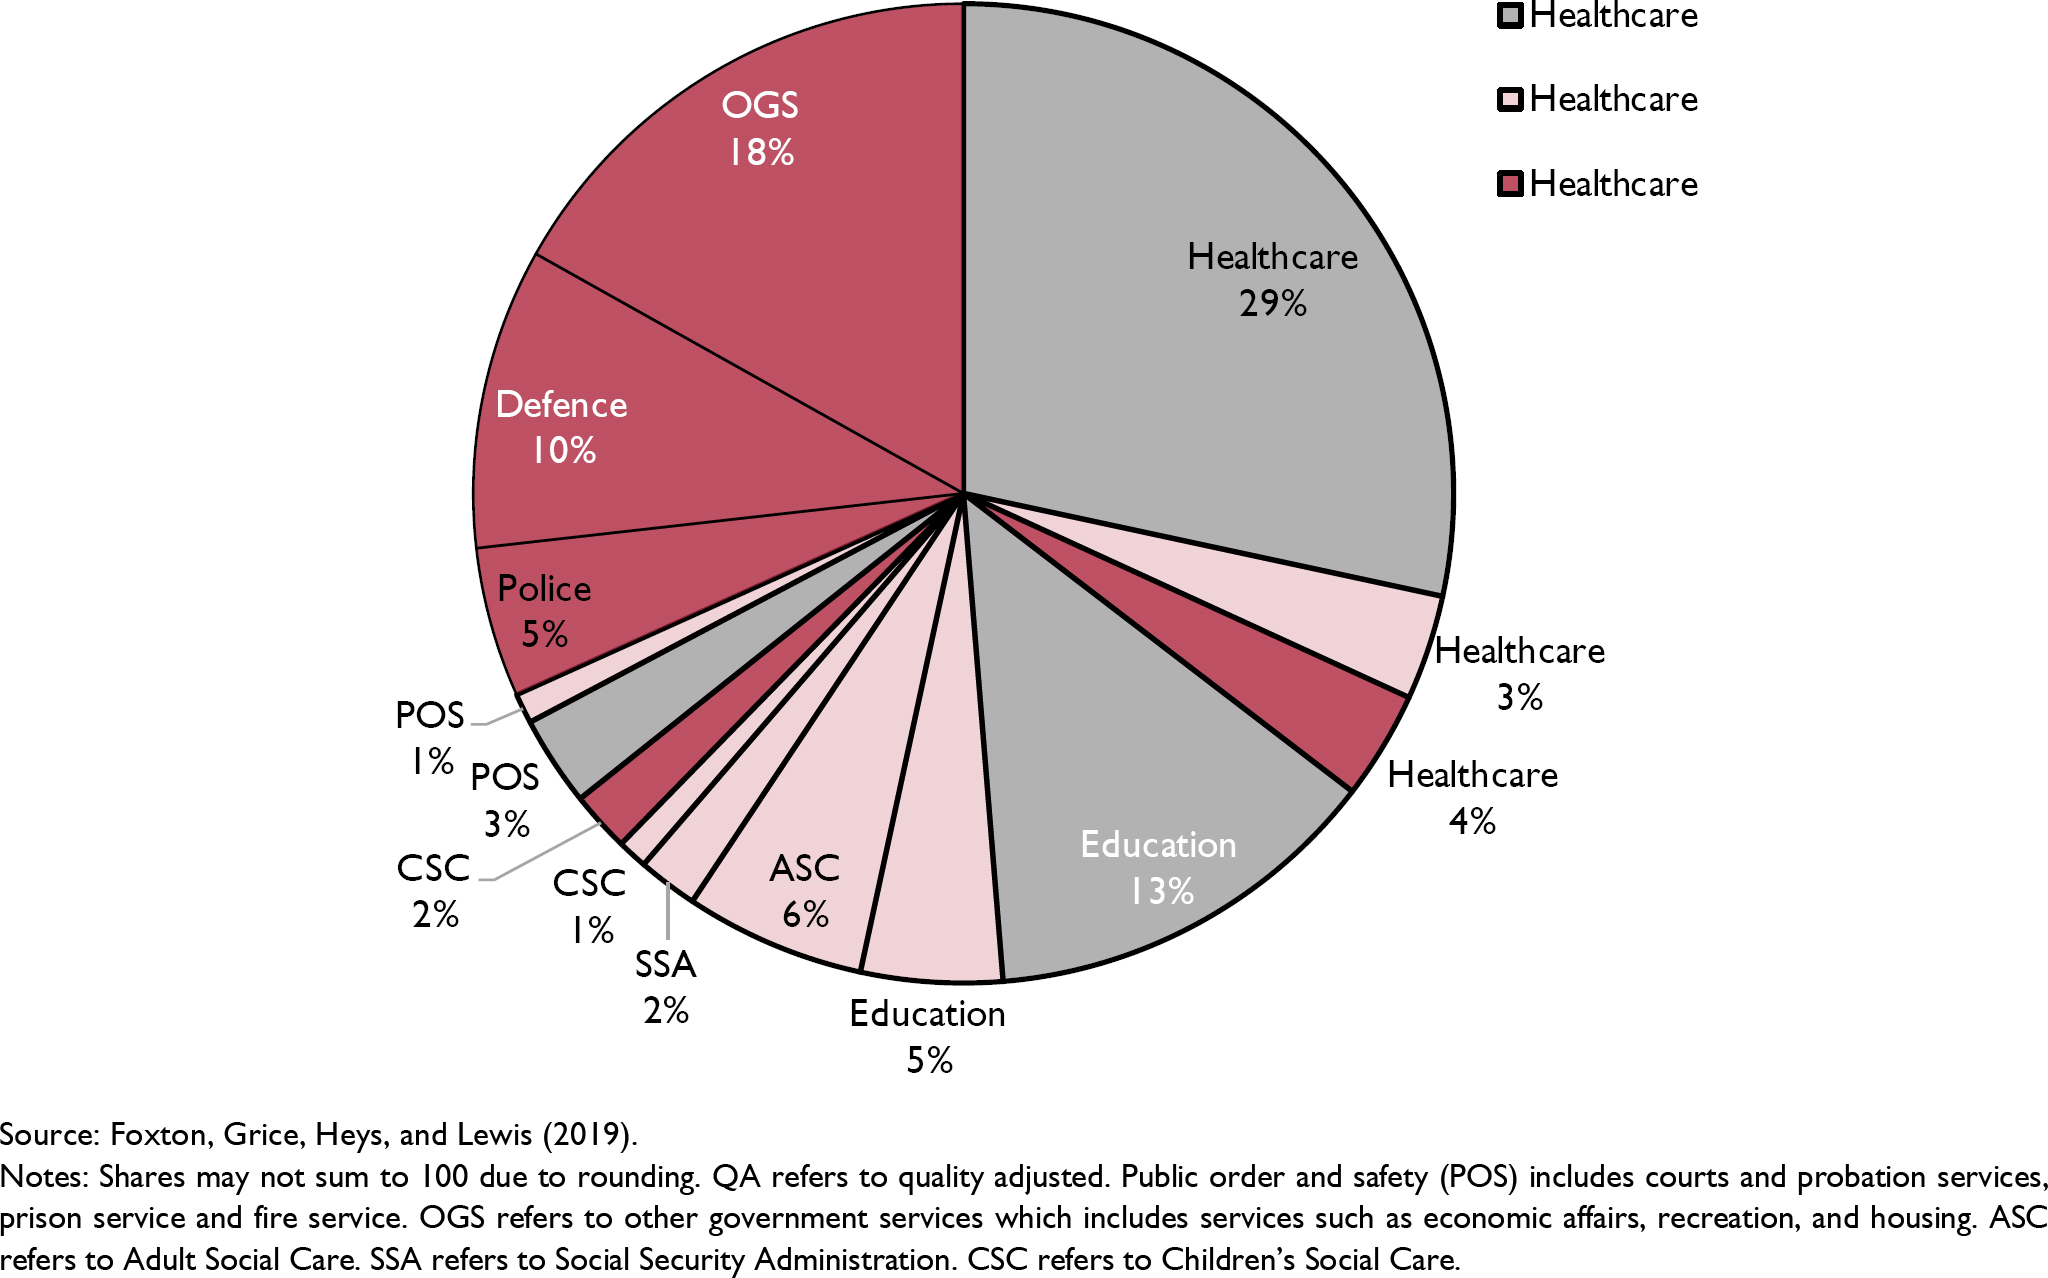
Figure 4. Public services and how they are measured
There is also a wider question regarding the welfare gain to society from living longer and more healthy lives, however this is generated, which is a different agenda to measuring the outputs of public services (Reference Foxton, Grice, Heys and LewisFoxton et al., 2019). As Reference Foxton, Grice, Heys and LewisFoxton et al. (2019) argue, the Atkinson quality adjustments only capture that aspect of the welfare gain which is directly attributable to the service. For example, longer healthy life expectancy is partly the result of publicly provided health services, but also the result of better diet, trends in smoking and exercise, for example. From the point of view of measuring welfare, such welfare gains (or losses) may be a driver of the perceived difference in the behaviour of GDP and welfare. Reference Foxton, Grice, Heys and LewisFoxton et al. (2019) therefore question whether we should move away from the Atkinson model of bottom-up estimates of directly attributable components, in favour of a top-down apportionment of a more universally estimated outcome. A major advantage of doing this would be to allay fears about differences between countries in making quality adjustments to public service output, which were a major reason for rejecting these from ESA10. A second advantage is that, as shown by Reference Foxton, Grice, Heys and LewisFoxton et al. (2019) and highlighted in the discussion above, identifying methods to derive only attributable quality adjustments is not methodologically simple, and not necessarily simpler than a top-down method.
A major problem facing statistical agencies is how to adjust household price and quantity indices for increases in the choice of goods and services. The increased proliferation of such goods is a key characteristic of the digital economy. Moreover, these commodities are often available at zero price, reflecting the very low marginal costs of digital replication and distribution. Therefore, the consumption of these goods has a measured value of zero in the national accounts.
Reference Brynjolfsson, Collis, Diewert, Eggers and FoxBrynjolfsson et al. (2019) have used experimental economics to measure the welfare benefits of free (digital) commodities and to define an extended measure of output, GDP-B. In a paper presented at EM 2019, Reference Diewert, Fox and SchreyerDiewert, Fox and Schreyer (2019) adapt the approach of Reference Brynjolfsson, Collis, Diewert, Eggers and FoxBrynjolfsson et al. (2019) to new commodities that may or not be free. The main framework for dealing with new goods comes from Reference HicksHicks (1940) where it is assumed that households have (latent) preferences defined over products before they actually appear in the marketplace. If reservation prices for these unavailable goods can be estimated for the period prior to their introduction to the market place, then normal index number theory, based on the economic approach to index numbers can be applied. The practical difficulty is to estimate these reservation prices.
Reference Brynjolfsson, Collis, Diewert, Eggers and FoxBrynjolfsson et al. (2019) provide a framework by which to understand the welfare contributions from these goods and the potential mismeasurement that arises from not fully accounting for them. They derive an explicit term that is the marginal value of a new good on welfare. Their new metric, which they call GDP-B, as it captures the benefits associated with new and free goods, is an extension to GDP to incorporate consumer benefits arising from digital goods, as measured through experimental evidence. They draw on the work of Reference Brynjolfsson, Eggers and GannamaneniBrynjolfsson, Eggers and Gannamaneni (2018) who developed an approach to estimate consumer welfare directly by running massive online choice experiments. They propose two empirical implementations of GDP-B, one requires the estimation of reservation prices, while the other, based on the concept of ‘total income’, avoids this necessity. The first method uses experimental evidence on consumer valuations to derive an extension of GDP which is consistent with standard Hicksian concepts of welfare change. The second method extends GDP by including the extra income needed to achieve the same level of utility without the digital goods as with the digital goods.
In the US Reference Brynjolfsson, Collis, Diewert, Eggers and FoxBrynjolfsson et al. (2019) apply their approach to Facebook, using online choice experiments to elicit user valuations. In the experiment, each participant was asked to make a single discrete choice between either keeping access to Facebook or giving up Facebook for one month and getting paid a specific amount. Participants were randomly allocated to one of 12 price points between 1–1000. The participants were told that that their choices were consequential and that their online Facebook status would be remotely monitored. After fitting a binary logit model to the participants' decisions using the (log) monetary values as predictors, they derived a median willingness-to-accept (WTA) price for giving up Facebook for one month of $42.17 in 2017. They then estimate a reservation price for Facebook in 2003, the year before it was founded, and compare the change in welfare between 2003 and 2017. Their estimated contribution to welfare due to Facebook in the US over the period 2003–17 is $231 billion, and the per user welfare gain over the period is $1,143. They estimate that Facebook would increase real GDP-B growth by 1.54 percentage points from 2003 to 2017. Considering that Facebook is just one product, including the benefits from Facebook results in a very large impact.
Using slightly different assumptions from Reference Brynjolfsson, Collis, Diewert, Eggers and FoxBrynjolfsson et al. (2019) and Reference Brynjolfsson, Eggers and GannamaneniBrynjolfsson, Eggers and Gannamaneni (2018), Reference Diewert, Fox and SchreyerDiewert, Fox and Schreyer (2019) generalise the total income approach of Reference Brynjolfsson, Collis, Diewert, Eggers and FoxBrynjolfsson et al. (2019) and suggest a third method for determining reservation prices. They present a method for obtaining a Hicksian reservation price for a new commodity in the period prior to a new product existing using experimental evidence on how much compensation must be paid to households in the first period of a new goods' existence for not consuming the new commodity. Once an appropriate reservation price for the new commodity is obtained for the pre-period, normal index number theory can be used to measure welfare change and changes in the Reference KonüsKonüs (1939) true cost of living index.
4. Conclusion
Just before the EU referendum in 2016 the academic Anand Menon was at an event in Newcastle to debate the impact of Britain leaving the EU. Menon invited the audience to imagine the likely plunge in the UK's GDP, whereupon a woman in the audience yelled back: “That's your bloody GDP. Not ours.”Footnote 14 While I do not know what lay behind this response, it isn't unreasonable to think that people do not see the reality of their lives reflected in the official picture painted by statistics such as GDP. If inequality increases enough relative to the increase in average GDP per capita, most people can be worse off even though average income is increasing. GDP is one of the most widely used concepts in modern societies; it makes a regular appearance in media headlines, public discussions and debates by politicians. While it does a good job at measuring the output of the economy (and how fast or slowly it is growing),Footnote 15 even one of its pioneers understood that it was not a measure of welfare. There are also aspects of quality of life not captured by income, consumption and wealth.
This paper has reviewed some recent developments in approaches to measuring welfare that were presented at the ESCoE conference on Economic Measurement in May 2019. Measurement matters: what we measure affects what we do. If our measurements of economic welfare and social progress are flawed, this may lead to policy choices by governments and societies that are misguided. A full consideration of taxes, social welfare programmes, health and education policies, labour market regulations, and environmental policy, for example, must ultimately address the question of how these policies affect the well-being of people.
The literature reviewed in this paper reflects a tension between simple measures that capture one aspect of welfare such as the distribution of income, measures that seek to combine a range of different factors into a composite measure such as the approach of Reference Jones and KlenowJones and Klenow (2016), and ‘dashboard’ approaches that seek to display visually the multidimensional character of well-being. Further work should be done on the theoretical underpinnings of composite measures to avoid the critique of Reference RavallionRavallion (2012). There is scope to include other dimensions of well-being in such measures such as the state of the natural environment, or crime. More work could be done in disaggregating well-being measures spatially and disaggregating metrics by sex, age, and different types of household for example. This comes at the cost of the clarity of a single number, but has the advantage of enabling people to relate their circumstances to official statistics.
Most of the measures discussed in this paper are short-term, and frequently measure flows, rather than stocks, an exception is the asset-based approach being developed by the New Zealand government, and proposed by Reference Coyle and Benjamin Mitra-KahnCoyle and Mitra-Kahn (2017). Such an approach measures access to a range of assets that people need to lead a meaningful life as they conceive it, and it also allows for the measurement of sustainability. While GDP does a reasonable job of measuring the marketable output of the economy (which remains important for some policies), it does not measure well-being, and therefore it should be downgraded, with more attention given to measures that reflect a wider range of objective and subjective measures of well-being, as well as measures that better reflect the heterogeneity of peoples' experiences.