


INTRODUCTION
The use of small fields has significantly increased in radiation therapy with the introduction of modern techniques like stereotactic radiosurgery/therapy (SRS/SRT), Stereotactic body radiotherapy (SBRT) and volumetric modulated arc therapy. Small field dosimetry has inherent challenges such as charge particle disequilibrium, detector sensitivity, source occlusion. In addition, the dosimetric uncertainties in a heterogeneous medium attracts a lot of research.Reference Alfonso, Andreo and Capote 1 – Reference Rassiah-Szegedi, Salter, Fuller, Blough, Papanikolaou and Fuss 5 The majority of the stereotactic treatment planning systems (TPSs) ignore the presence of heterogeneities such as the cranial bone and the air cavities at the skull base and do not include heterogeneity corrections, as the typical beam arrangement that are used compensate the perturbation. Also, there are computation time limitations since the irradiation technique includes multiple arcs and multiple isocenters. 6 Perhaps, the recent trend of the increase use of SBRT treatment using small fields and high dose per fraction for lung, head and neck, spinal cord and liver is challenging the accuracy of dose delivery. The presence of inhomogeneities such as air cavities and bone in the immediate vicinity of a target volume leads to dose non uniformity as a consequence of loss of electronic equilibrium. 7 Several authors reported the uncertainties in dose calculation caused by the presence of the inhomogeneities near the high dose region. It has been established that the algorithm like pencil beam, collapse cone, anisotropic analytical algorithm could not calculate the dose very accurately in heterogeneous medium.Reference Jones and Das 8 – Reference Van Kleffens and Mijnheer 12 Rustgi et al. reported the dose discrepancies at the surface for a 12·5 mm diameter field as 11, 17, 23 and 33% for air gap width of 3, 4·6, 6 and 9·2 mm, respectively.Reference Rustgi, Samuels and Rustgi 13 The same researchers have studied the dose perturbation in the presence of high-density inhomogeneity and shown that neglecting the presence of the cranial bone may result in an overestimation of the absolute dose by ~2–5% depending on its density and thickness.Reference Rustgi, Rustgi, Jiang and Ayyangar 14 There are several publications that evaluate the user specific dosimetric accuracy of the TPS in a heterogeneous environment. 15 – 17 It is widely accepted that Monte Carlo (MC) algorithms model electron transport in different media and therefore perform better dose calculation in a heterogeneous medium than that of the less complex algorithms. MC algorithm also affords more elegant ways to deal with the complex scatter patterns of treatment machines and beam modifying equipment.Reference Lopez-Tarjuelo, Garcia-Molla and Juan-Senabre 18 CMS Monaco (Elekta CMS, Sunnyvale, CA, USA) is a commercially available planning system which uses an X-ray voxel Monte Carlo (XVMC) algorithm. 19 Not many studies on the validation of Monaco XVMC algorithm in an heterogeneous medium have been published concerning small fields. Nevertheless, the dose calculation from any TPS in a complex scenario ought to be verified with appropriate measurements. This present study was designed to evaluate the performance of the XVMC algorithm in Monaco TPS by phantom measurement in a heterogeneous medium for a set of small fields. Tests were performed in simple geometrical phantoms with inserts and layers of different density materials mimicking different tissues of the human body for a range of small field photon beams.
MATERIALS AND METHODS
An in-house phantom was made with inserts such as Foam (0·250 gm/cm3), Delrin (1·523 gm/cm3) and polymethyl methacrylate (PMMA) (1·015 gm/cm3) sheets of various thickness to simulate the heterogeneity of lung, bone and soft tissue, respectively. The fields were delivered using an Elekta linear accelerator (Elekta, Crawley, UK) equipped with beam modulator consisting of 40 pairs of leaves projecting 4 mm at isocenter. Furthermore, the beam data collection was performed as per vendor’s specification. The smallest field size required for the beam commissioning was 16×16 mm. The TPS commissioning measurements were performed with IBA CC01 micro ionisation chamber (IBA Dosimetry, Schwarzenbruck, Germany) having volume of 0·01 cc for 16×16 mm to 40×40 mm fields, and with IBA CC13 ionisation chamber for 32×32 mm to 160×210 mm fields using a RFA Blue Phantom 1 (IBA Dosimetry).
Heterogeneity phantom
The phantom consisting of a set of slabs of Delrin, Foam and PMMA having different densities materials to represent lung, bone and soft tissue, respectively, was used in this study. In terms of dose verification in difference densities with different interface conditions, a setup of lung–bone (LB), lung–soft tissue (LS), soft tissue–bone (SB), bone–lung (BL), bone–soft tissue (BS) and soft tissue–lung (SL) were made. For the LB scenario, the detector was positioned in the bone equivalent medium (measurement medium) at the depth of 0, 1, 2 and 3 cm with sufficient backscatter material. The lung equivalent medium with a thickness of 3 cm as first medium was placed above the bone equivalent medium to simulate the lung and bone tissue interface condition. Similarly, LS, SB, BL, BS and SL scenarios were considered for the measurement of corresponding setups. In all the scenarios, 2 cm of solid water material was used as an initial dose buildup. The detector was placed in the corresponding positions with a suitable adapting slot with density of measurement medium.
Point dose verification
The point dose measurements were carried out with two different detecting systems, CC01 micro chamber with active volume of 0·01 cc and the SRS diode detector (Type 60018) (PTW Freiburg GmbH, Freiburg, Germany) with active volume of 0·3 mm3. The effective point of measurements for CC01 and the SRS diode were 1 and 1·3 mm, respectively, from the tip of the detector. The outer electrode of the ion chamber CC01 was made up of Shonka C552 with density of 1·7 g/cm3 and the stereotactic radiosurgery SRS diode was made up of epoxy with density of 1·52 g/cm3. Both the detectors were positioned parallel to the central axis of the beam for all the measurements.
For each combination of phantom scenarios, computed tomography (CT) images with slice thickness of 1 mm was acquired and imported to CMS Monaco TPS for dose calculation using the XVMC algorithm. The CT imaging was done with the detector in position to avoid any uncertainties during dose calculation. The experimental setup of 100 cm source to axis distance (SAD), with 2 cm buildup of solid water material followed by 3 cm thickness of first medium and sufficient thickness of second material to ensure full backscatter conditions as shown in Figure 1. In the TPS, the active volume of the ion chamber and diode detector was contoured and the mean calculated dose to this volume was recorded. In the dose calculation, the XVMC standard deviation was kept as 0·5% per plan with dose calculated using the dose calculation grid of 2 mm. The field sizes of 8×8, 16×16, 24×24, 32×32 and 40×40 mm using 6 and 15 MV photon beams were used in this study. The CT number to electron density calibration curve used for the dose calculation was generated using a tissue characterisation phantom (RMI, Gammex, Middleton, WI, USA) with physical density ranges from 0·3 to 1·84 (g/cm3) and the corresponding electron density relative to water varies from 0·292 to 1·707.
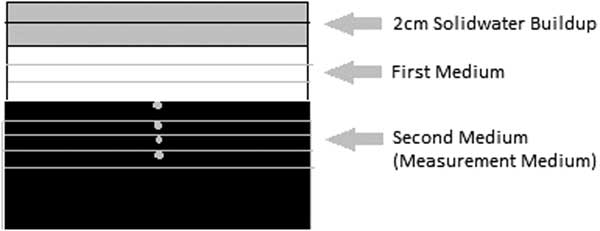
Figure 1 The schematic diagram of the experimental setup.
Planar dose verification
The 2D measurement was done using gafchromic EBT3 film (ISP; Ashland, Kentucky, USA) and compared with the TPS calculated dose plane for the interface of LB (and similarly for BL) as it is an extreme condition of human heterogeneity interface. In both the scenarios the dose plane from the 0 cm depth (interface plan) and at 2 cm depth in measurement medium were analysed for the field size of 24×24, 16×16 and 8×8 mm. The gafchromic film inserted in the coronal plane in the phantom at isocentre for analysing transverse profiles of both film and TPS. In the process of film calibration, the films were irradiated in 104×104 mm fields using 6 MV photon flattened beam with doses between 0 and 7 Gy. The films were digitised with an Epson 7600 flatbed scanner using a resolution of 72 dpi. The films were analysed using triple channel dosimetry in PTW software.
RESULTS
The accuracy of dose calculation using the XVMC algorithms in the heterogeneous medium for a wide range of small photon fields was analysed in this study. The results of point dose measurement using micro ion chamber (IC) and SRS diode (D) detector with different scenarios of densities were analysed. In order to avoid uncertainties in the results analysis from TPS modeling and the measurements, all the outputs were normalised to 104×104 mm at each corresponding setups. The correlation of measured versus TPS was verified with the relative output factor (ROF) for the fields of 40×40, 32×32, 24×24, 16×16 and 8×8 mm measured in the homogeneous medium that is solid water for both 6 and 15 MV using micro chamber and SRS diode. In homogeneous medium, the TPS calculated ROF values were showing good agreement with measured values with the maximum deviation of 0·7, 0·4, 0·5, 1·0 and 1·6% for 6 MV and 0·6, 0·8, 0·5, 1·1 and 1·8% for 15 MV with field sizes of 40×40, 32×32, 24×24, 16×16 and 8×8 mm, respectively.
Point dose verification
For the point dose measurements, both micro ion chamber and SRS diode detector were used in all the scenarios and the readings from both detectors were corrected with the small field output correction factor suggested by Francescon et al.Reference Francescon, Kilby and Satariano 20 , Reference Francescon, Kilby, Satariano and Cora 21 The difference in results from the detectors were compared against each other and found insignificant in the majority of cases. The results of diode measurements were considered for analysis and the ion chamber measurements were done for the trend correlation.
The ROF for the field sizes 40×40, 32×32, 24×24, 16×16 and 8×8 mm were measured in the material combination of SB, BS, LB, LS, SL and BL using micro ion chamber and SRS diode for 6 and 15 MV tabulated in Tables 1 and 2 respectively. The comparison of measured ROF and TPS calculated values for 6 and 15 MV were shown in the Figures 2 and 3, respectively. The measurements carried out for both 6 and 15 MV with the setup of SB and BS have shown a good agreement with TPS calculated for all field sizes greater than 16×16 mm. The maximum deviation of −1·9% at 3 cm depth in SB setup and −1·4% at 1 cm depth in BS setup in 16×16 mm were observed. For 15 MV, the maximum deviation of −1·8% at 3 cm depth in SB setup and the maximum deviation of −1·9% at 0 cm depth in the setup of BS were observed.
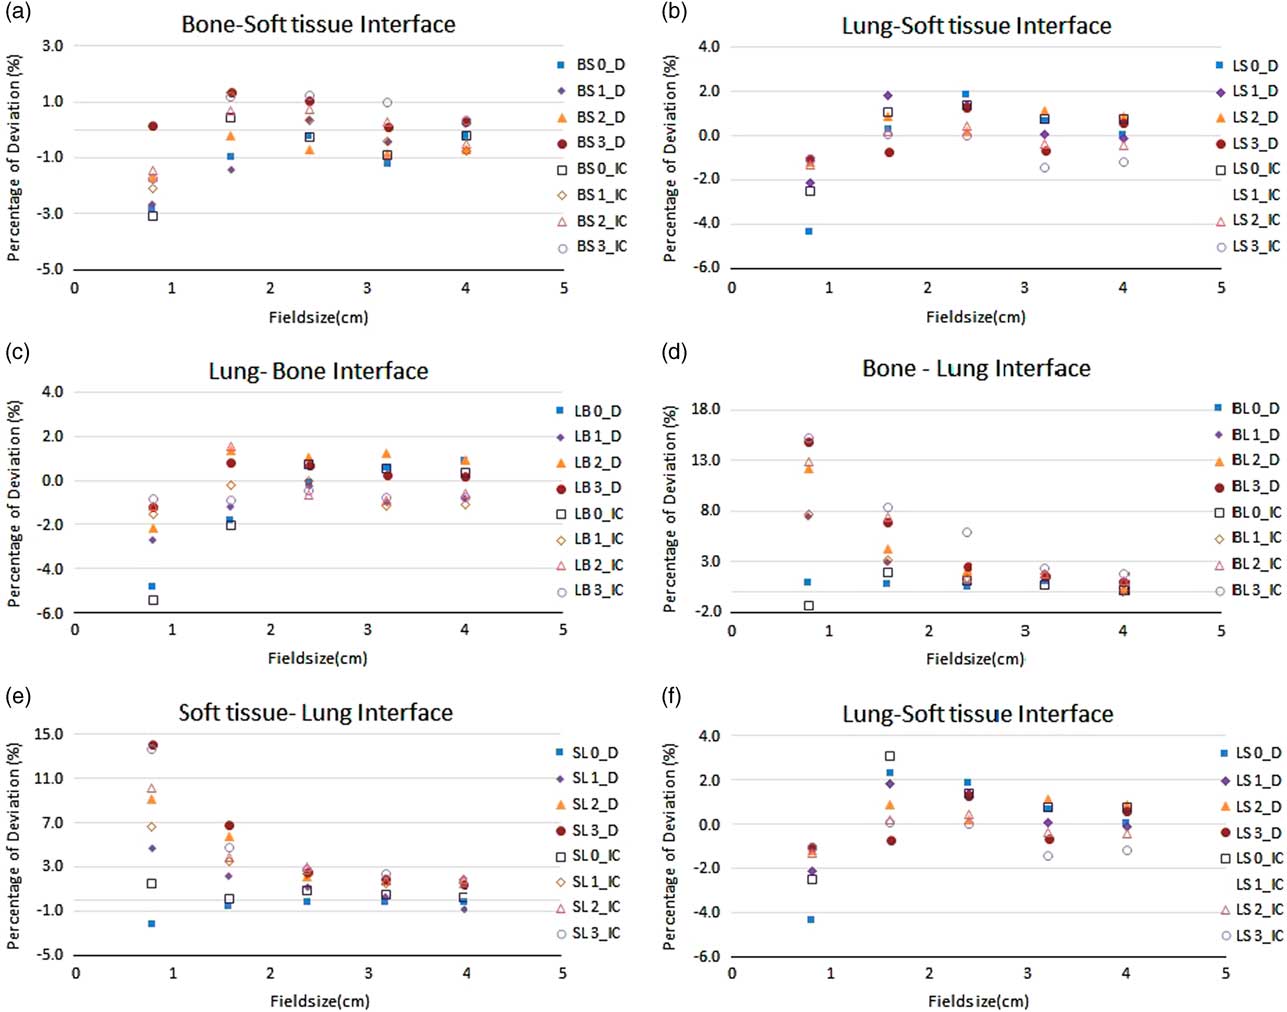
Figure 2 The percentage deviation of treatment planning system calculated and measured relative output factor using micro ion chamber and stereotactic radiosurgery diode (D) for the range of field sizes in different inhomogeneity scenarios in 6 MV photon beam. All output factors were normalised to 104×104 mm.
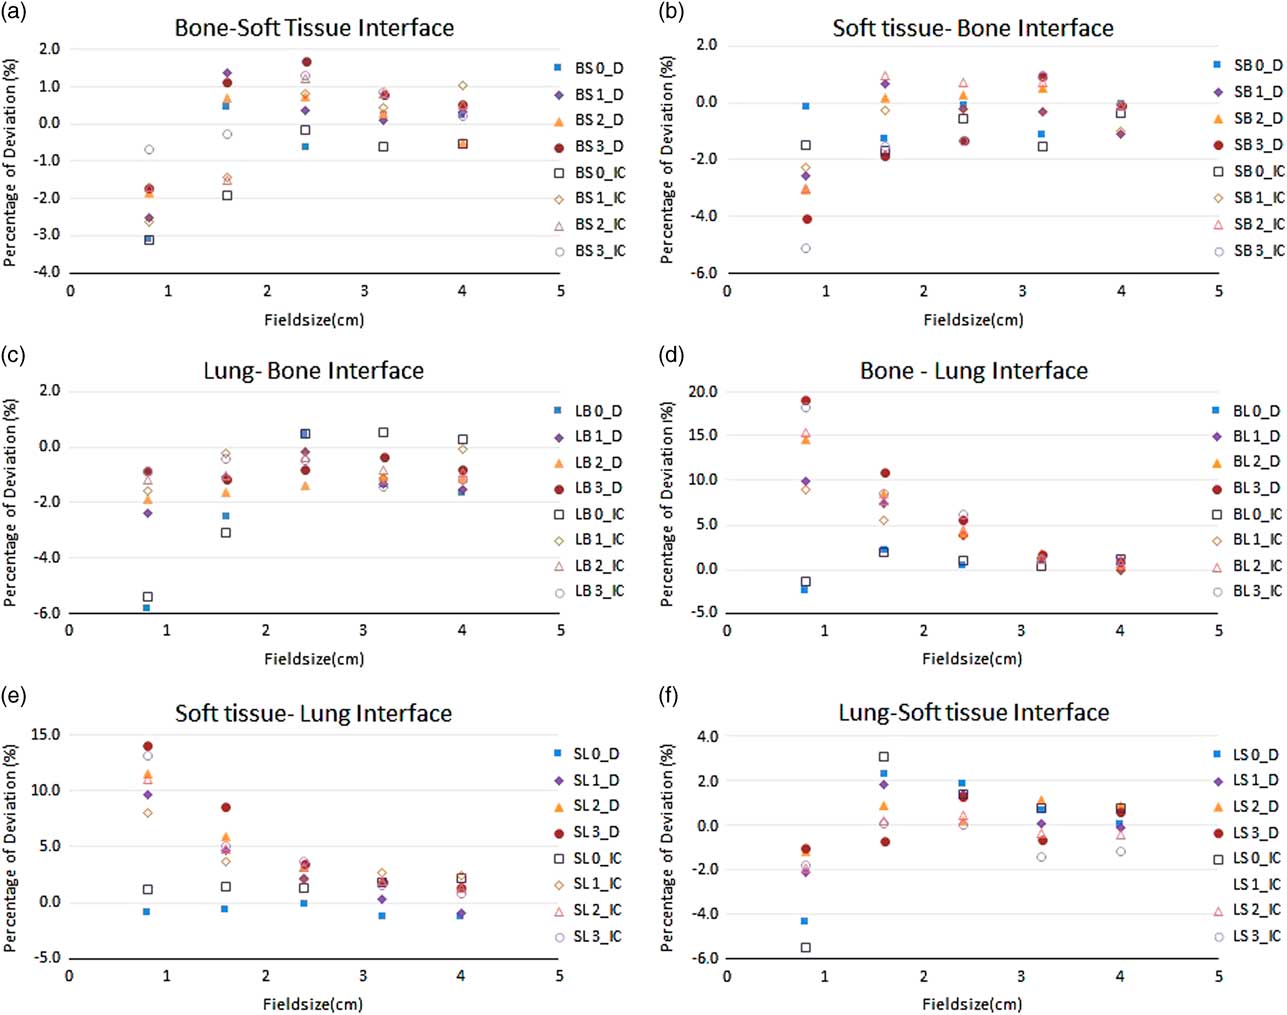
Figure 3 The percentage deviation of treatment planning system calculated and measured relative output factor using micro ion chamber and stereotactic radiosurgery diode(D) for the range of field sizes in different inhomogeneity scenarios in 15 MV photon beam. All output factors were normalised to 104×104 mm2.
Table 1 The percentage deviation of treatment planning system calculated and measured relative output factor using micro ion chamber (IC) and stereotactic radiosurgery diode (Diode) for the range of field sizes in different inhomogeneity scenarios in 6 MV photon beam

Notes: All output factors were normalised to 104×104 mm2.The codes in first column representing the setup of material composition in different combination at different depth. For example: BS0 states B—bone as first medium; S—soft tissue as measurement medium; 0—the depth of measurement in centimetres.
Abbreviations: S, soft tissue; B, bone; L, lung.
Table 2 The percentage deviation of treatment planning system calculated and measured relative output factor using micro ion chamber (IC) and stereotactic radiosurgery diode (Diode) for the range of field sizes in different inhomogeneity scenarios in 15 MV photon beam

Notes: All output factors were normalised to 104×104 mm2. The codes in first column representing the setup of material composition in different combination at different depth. For example: BS0 states B—bone as first medium; S—soft tissue as measurement medium; 0—the depth of measurement in centimeters.
Abbreviations: S, soft tissue; B, bone; L, lung.
For 8×8 mm2 field, the deviation was −1·1% at interface plane that is 0 cm depth and increased to −2·3% at the depth of 3 cm for SB Setup. For 15 MV, the deviation of −0·1% at interface plane and −4·1% at 3 cm were observed. Similarly, the BS setup shows the deviation of −2·8% at the 0 cm depth and subsequently reduced to 0·2% at 3 cm for 6 MV beam. For 15 MV, the deviation of −3·1% at 0 cm and −0·7% at 3 cm depth was observed.
With the lung equivalent as first medium, the ROF were measured in bone and soft tissue medium for 6 and 15 MV. Apart from 8×8 mm field, all other fields were showing the deviation around 2%. At 0 cm depth of LB setups (interface plane), the deviation of ROF were 0·1 and −1·8% for 24×24 and 16×16 mm for 6 MV and the deviation of 0·5 and 2·5% for 24×24 and 16×16 mm for 15 MV beams were observed. Similar range of deviation were observed for the setup of LS in both 6 and 15 MV. For 8×8 mm field, the deviation of −4·9, −2·7, −2·2, −1·7 and −4·3, −2·1, −1·2, −1·0% for 6 MV and the deviation of −5·8, −2·4, −1·9, −0·9 and −3·5, −3·8, −1·8, −1·0% for 15 MV were observed at 0, 1, 2 and 3 cm depth in LB and LS setup, respectively.
The measurements of ROF in the setup of SL and BL where the lung equivalent material is placed as measurement medium, a significant difference between measured and TPS calculated values was observed when approaching the smallest field of 8×8 mm. The deviation of ROF was found increasing as the measurement depth in the lung increases. For 24×24 mm field with 6 MV photon beam, the deviation of −0·1, 1·2, 2·2 and 2·5% were observed for the depths of 0, 1, 2 and 3 cm in the setup of SL, respectively. Similarly for BL setup, the deviation of 0·4, 1·9, 2·1 and 2·6% were observed.
When approaching 8×8 mm using 6 MV, the deviations were increased to 2·2, 4·7, 9·1 and 14·1% in SL and the deviation of 1·0, 7·5, 12·2 and 14·8% were observed for BL setups at the depths of 0, 1, 2 and 3 cm, respectively. For 15 MV, the deviation of 0·8, 9·6, 11·5 and 14·1% were observed in SL setup and the deviation of 2·5, 9·9, 14·6 and 19·2% were observed in BL setup at the depths of 0, 1, 2 and 3 cm, respectively.
Planar dose verification
For the planar dose verification, the setup of BL and LB were taken as it simulated the two extreme conditions of interface in the human body. The planar dose was verified for the fields of 24×24, 16×16 and 8×8 mm at 0 and 2 cm depth in measurement medium using gafchromic film. The measured and calculated transverse profiles of 24×24, 16×16 and 8×8 mm fields for 6 MV photon beam are shown in the Figure 4. The continuous lines correspond to the XVMC TPS calculated dose and the dashed lines correspond to the film measurements.
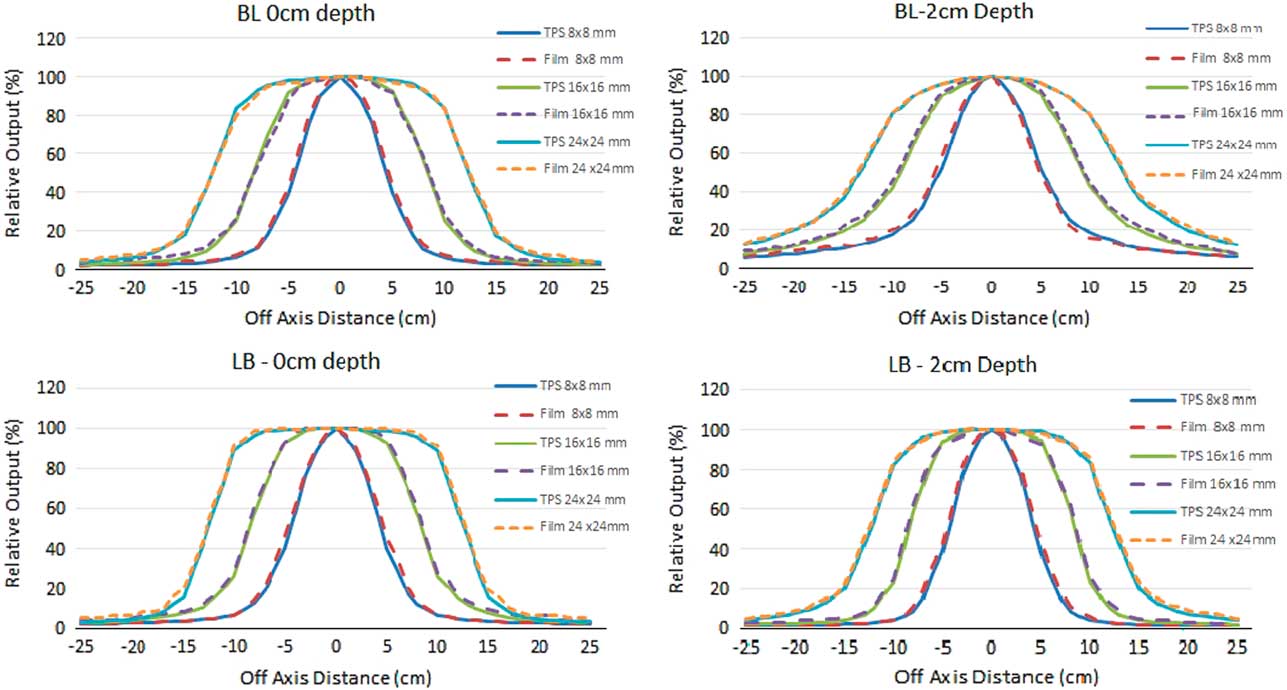
Figure 4 Comparison of transverse profiles at 0 and 2 cm depth planar verification for 24×24, 16×16 and 8×8 mm beam with treatment planning system calculated and film measurements.
DISCUSSION
In this study, we attempted to validate the Monaco XVMC treatment planning algorithm for small field geometries in a heterogeneous medium. Initially, the errors in the TPS commissioning were ruled out by comparing the values with that of measurements in homogeneous medium with deviation not exceeding 1·8%. Generally, the radiation treatments utilise the information provided by TPS which uses empirical or semi-empirical dose algorithms as dose engines. It has been proven by many studies that the conventional dose algorithms for radiation therapy treatment planning are approximate and limited in accuracy.Reference Jones and Das 8 – Reference Van Kleffens and Mijnheer 12 The experimental studies have shown that the TPS commissioned using water dose data can lead to >30% dose change in presence of low-density inhomogeneities such as lungs. 22 Also significant local effects are expected in high-density inhomogeneities in areas such as bones though it is not well- studied.
These differences are due to this fact that these algorithms do not adequately take into account the lateral transport of radiation. As a result, they produce inaccurate dose distributions, particularly in the presence of low or high-density inhomogeneities. When photon energy increased, the effect of this fact increased too because calculations are based on electron equilibrium and not on photon scattering. The magnitude of the errors in the calculated doses increases as the field size decreases. In recent years, MC dose calculation algorithm has been released and has been proven for its accuracy by many authors in most of the applications.Reference Ojala, Kapanen, Hyödynmaa, Wigren and Pitkänen 23 , Reference Li, Galvin, Harrison, Timmerman, Yu and Xiao 24
Many studies comparing the MC and model based algorithm have reported the superiority of MC algorithm. The measurement-based studies have reported the accuracy of MC dose calculation within 2–3% of deviation but all these measurements were averaging the effect of depth, tissue densities and thickness and the field size. Li et al. studied the influence of air cavity in the dose calculation and reported that the dose reduction near an air cavity was greater for smaller field size, higher energy, larger air cavity size, and shallower depth in water where the air cavity was situated.Reference Li, Yu and Holmes 25
Jones and Das studied the effect of lung heterogeneity on small beamlets for high energy photon beams by MC algorithm and showed a dose decrease for small fields in the presence of low-density media due to the lack of lateral electronic equilibrium and as the density and field size increased, the dose reduction was less pronounced. Their data suggested that some TPS may dramatically over or underestimate the dose in inhomogeneous media for small field sizes that are used for advanced radiotherapy techniques.Reference Jones and Das 8 Petoukhova et al. reported a good agreements with the measurement of conformal beam plans and reasonable agreements for dynamic conformal arc and intensity-modulated radiation therapy plans using i Plan RT Dose MC calculation with the experimental data for phantoms with air cavities.Reference Petoukhova, van Wingerden and Wiggenraad 26 For detector selection, the choice of detector for the small field measurements were studied by many others and justified the use of air filled micro ion chamber and diode detector for the ROF measurement with appropriate positioning and correction factors.Reference Benmakhlouf, Sempau and Andreo 27
In most of the scenarios in our study, the results were found comparable with previous investigations on the subject of small field analysis using XVMC dose calculation algorithm in the heterogeneous medium. In the setup of BS and LS where we have soft tissue equivalent as measurement medium, the deviation of ROF with TPS calculated was insignificant for the field size 16×16 mm and above. For 8×8 mm the maximum deviation was 2·8% at the interface plane of BS and 4·8% at LS interface plane and it was observed that, when depth increases the deviation has reduced to 1%, which shows the improvement of charged particle equilibrium. In another scenario, the deviation for LB setup were −4·9 and −5·8% at the interface plane and reduced to −1·2 and −0·9% at 3 cm depth of bone equivalent measurement medium for 6 and 15 MV beams, respectively. As the depth increases in the denser medium such as bone, the deviation reduced on account of less scatter component.
With very small diffusion length of active volume and high sensitivity of a diode such as SRS diode, this makes them very promising for use in small field dosimetry. Diodes have characteristics which can limit their use without additional corrections such as those arising from dose rate dependence, variation of response and temperature dependence. The small volume ionisation chambers also have successfully been used for dosimetric measurements with proper correction factors for small fields. Noteworthy, the results of the ROF measurement in the homogeneous medium has ensured the magnitude of the errors in the heterogeneous medium has not altered due to the adoption of the correction factors for the ion chamber measurement.
To avoid any positional uncertainties during the depth variation, the setup with SAD technique was chosen by changing the depth by simply adding the required slab above the detector. The detectors were positioned parallel to the beam axis to ensure that the active region of the detector was covered fully even for the smallest field size.
In the scenario where the ROF measured for 8×8 mm with lung equivalent as measurement medium and bone as first medium, the maximum deviation of 14·8 and 19·2% were observed for 6 and 15 MV photon beam, respectively. Even with a suitable detector for the small field measurement and the high care of positioning accuracy, the dose measured in lung medium were showing a significant variation as a cause of dose build down region that the absorbed dose reduces sharply due the reduction of secondary electrons coming from upstream in the lung medium. The over estimation of measurement values for the smaller fields in lung equivalent medium and the under estimation in the soft tissue and bone equivalent medium were challenging the beam modelling for scatter components of small fields in the heterogeneous medium. The possible source of significant difference between the TPS calculated and the measured values may be explained as the correction factors for the measured square fields were obtained from the data by Francescon et al. which were collected with homogeneous medium and not for the heterogeneous medium. The difference in the energy spectrum of a small field in heterogeneous medium might have influenced the detector correction factor and consequently the output measurement.Reference Francescon, Kilby and Satariano 20 , Reference Francescon, Kilby, Satariano and Cora 21 This is where the existence of criticality of small fields of high energy photons in heterogeneous medium especially in low density. The significant deviation of measured ROF from TPS calculated in this scenario is demanding for in detail analysis. Where the planar dose verification is concerned there is not much significant variations found between measured and calculated dose at various scenarios as it is normalised to the central axis of the beam.
CONCLUSION
The accuracy of dose calculation in a heterogeneous medium for a range of small photon fields using the XVMC algorithms implemented in Monaco TPS was studied. The increasing in the practice of hypo-fractionated stereotactic delivery for extra-cranial targets is proving to be a superior and more accurate radiation technique. In this study, the results correlated with measurement data for field size 16×16 mm and above ensuring the accuracy of the algorithm. Noticeable deviation was observed for smallest field size of 8×8 mm with interfaces of significant change in density. The observed results demands further analysis of work with smaller field sizes.
Acknowledgement
None.


