Introduction
The Antarctic toothfish, Dissostichus mawsoni (Norman, 1937), is a mesopelagic predator and endemic to the seas around Antarctica with a circumpolar distribution. It is usually caught on the bottom at depths of 88–1600 m in water temperatures of -1.8°C to 2.3°C (DeWitt et al. Reference DeWitt, Heemstra, Gon, Gon and Heemstra1990). In the spring at McMurdo Sound, the Antarctic toothfish resides under heavy ice in the bottom 200 m of the water column and its blood is well fortified with antifreezes to withstand subzero temperatures (Eastman Reference Eastman1993). The species is reported to live over 30 years and can attain total lengths of up to 175 cm and weigh up to 80 kg (though specimens found in the stomachs of sperm whales indicate larger specimens may exist) (Yukhov Reference Yukhov1971, DeWitt et al. Reference DeWitt, Heemstra, Gon, Gon and Heemstra1990). The maximum size recorded for D. mawsoni in McMurdo Sound is c. 2 m in total length (TL) and 110 kg. On average, D. mawsoni is six times longer and 250 times heavier than other notothenioids in McMurdo Sound (Eastman Reference Eastman1993).
Tag returns suggest that long-distance movements of adult D. mawsoni are limited, although data are sparse due to low fishing levels outside of the Ross Sea and the short history of the commercial fishery (Smith & Gaffney Reference Smith and Gaffney2005). A mark and recapture study in McMurdo Sound revealed that 13 out of c. 5000 animals tagged were recaptured after a period of one to seven years (DeVries unpublished). These animals grew an average of 2 cm yr-1 (Eastman Reference Eastman1993). Two tagging studies conducted in 2001–03 showed a recapture rate of 1.5% (30 out of 2000), with the greatest distance travelled being 73 km over a period of 695 days (Hanchet et al. Reference Hanchet, Horn and Stevenson2001, Sullivan et al. Reference Sullivan, Smith, McKenzie and Hanchet2003).
Information on reproduction in D. mawsoni is likewise limited. Otolith studies of the McMurdo Sound population indicate that D. mawsoni become sexually mature around eight years of age and total lengths of more than 95 cm (Burchett et al. Reference Burchett, DeVries and Briggs1984, Horn et al. Reference Horn, Sutton and DeVries2003, La Mesa Reference La Mesa2007). Everson (Reference Everson and Laws1984) and Yukhov (Reference Yukhov1982) suggested that D. mawsoni spawn in the middle to late winter/early spring. Spawning adult females have never been captured; however, Yukhov (Reference Yukhov1971) inferred that mature eggs measure 4.0–4.3 mm and are pelagic. Juvenile D. mawsoni up to 12 cm in length live in surface waters near the Antarctic continent and feed on adult euphausiids and larval fish (Pakhomov & Pankratov Reference Pakhomov and Pankratov1992, Eastman & DeVries Reference Eastman and DeVries2000). Upon reaching total lengths of 18 cm, D. mawsoni assume a benthopelagic existence and descend in the water column to depths of 300–500 m (Eastman & DeVries Reference Eastman and DeVries2000).
Antarctic toothfish remain in the coastal waters for several years until they attain sexual maturity. At this time, they migrate north to oceanic waters between the shelf break and the Antarctic Polar Front (Eastman & DeVries Reference Eastman and DeVries2000). Dissostichus mawsoni make these migrations early in the summer and occupy depths between 300–500 m, with a preferred depth of 500 m (Eastman & DeVries Reference Eastman and DeVries2000). It has been speculated that Antarctic toothfish return to coastal waters for spawning several times in their lifespan, though they may not spawn every year (Yukhov Reference Yukhov1982, Eastman & DeVries Reference Eastman and DeVries2000). Analysis of morphological and reproductive data from collections in CCAMLR Subarea 88.1 by Fenaughty (Reference Fenaughty2006) suggested a spawning migration from the main Ross shelf to the Pacific–Antarctic Ridge to the north.
Recent genetic studies using both nuclear DNA and mitochondrial DNA single nucleotide polymorphisms (SNPs) of the Patagonian toothfish (Dissostichus eleginoides Smitt, 1898), the sister species to D. mawsoni, have demonstrated significant differentiation both within and among the three oceanic sectors (Kuhn Reference Kuhn2007). Appleyard et al. (Reference Appleyard, Ward and Williams2002) demonstrated highly significant differences between three fishing areas (Shag Rocks / South Georgia, Heard and McDonald islands and Macquarie Island) in mtDNA restriction fragment length polymorphism (RFLP) data, but no differentiation in frequencies of seven microsatellite loci (FST = -0.009, P = 0.785) for Patagonian toothfish. Rogers et al. (Reference Rogers, Morley, Fitzcharles, Jarvis and Belchier2006) documented differentiation of toothfish populations from the Falkland Islands from those around South Georgia and Bouvet Island (mtDNA FST > 0.906, P < 0.01, microsatellite FST = 0.014–0.034, P < 0.05), which may be explained by hydrogeographic isolation resulting from two deep ocean fronts. These genetic studies suggest that a number of factors may limit gene flow, including large geographic distances between toothfish habitats, deep water barriers affecting adult movements, and the Polar Front affecting larval transport (Shaw et al. Reference Shaw, Arkhipkin and Al-Khairulla2004).
Previous genetic work by Smith & Gaffney (Reference Smith and Gaffney2005) on the Antarctic toothfish observed limited mitochondrial sequence diversity but significant differentiation in haplotype frequencies between three fishing areas, while RFLP analysis of four nuclear loci showed no geographic differentiation. Using randomly amplified polymorphic DNA (RAPD), Parker et al. (Reference Parker, Paige and DeVries2002) found significant differentiation (FST = 0.297 ± 0.082, P < 0.0001) between McMurdo Sound and Antarctic Peninsula populations.
This study aims to expand the work of Smith & Gaffney (Reference Smith and Gaffney2005) by examining nuclear and mitochondrial single nucleotide polymorphisms (SNPs) in D. mawsoni. SNPs are the most prevalent form of genetic variation (Brumfield et al. Reference Brumfield, Beerli, Nickerson and Edwards2003, Seddon et al. Reference Seddon, Parker, Ostrander and Ellegren2005), providing a virtually unlimited number of loci for genetic studies (Kuhn & Gaffney Reference Kuhn and Gaffney2006). The simpler mutational dynamics of SNPs leads to the advantage of a lowered rate of homoplasy, with a capacity for rapid, large-scale and cost-effective genotyping (Seddon et al. Reference Seddon, Parker, Ostrander and Ellegren2005, Kuhn & Gaffney Reference Kuhn and Gaffney2006). As a result, SNPs are becoming markers of choice for large-scale genotyping surveys, including fisheries applications (e.g. Elfstrom et al. Reference Elfstrom, Smith and Seeb2006). A combination of both mitochondrial DNA (mtDNA) and nuclear DNA analyses can provide a powerful approach to population genetic structure, as these genomes have unique characteristics and different modes of inheritance (Avise Reference Avise2004).
Materials and methods
Sampling of D. mawsoni
Muscle tissue samples were collected from a total of 192 Antarctic toothfish from nine collections from four CCAMLR Subareas (Table I): Australian Antarctic Territory (Subarea 58.4.1, abbreviated AAT), South Shetland Islands (Subarea 48.1, SS) and the Ross Dependency (Subareas 88.1 and 88.2, RD88.1 and RD88.2). Because the two RD88.2 collections were taken from nearby stations within a week of each other, genetic data were pooled after evaluating statistical homogeneity. Three of these Subareas (AAT, SS and RD88.1) were previously examined by Smith & Gaffney (Reference Smith and Gaffney2005). Tissue samples were stored in 95% ethanol prior to DNA extraction. DNA was extracted either using the DNeasy Tissue Kit (Qiagen Inc, Valencia, CA) or by using the Promega Wizard® Genomic DNA Purification Kit (Promega, Madison, WI) according to manufacturer's protocols.
Table I. Details of Antarctic toothfish (Dissostichus mawsoni) collections.

N/A = data not available.
Marker development and DNA sequencing
Polymerase chain reaction (PCR) was used to amplify four mitochondrial regions (tRNA-THR/tRNA-PRO/control region (CR), cytochrome b (cyt b), 16S rRNA (16S) and NADH dehydrogenase subunit 2 (ND2)) and 14 nuclear gene fragments (bloodthirsty (bty), calmodulin (CaM), dystrophin 6a (Dyst6a), mixed lineage leukaemia-like protein (MLL), L-lactate dehydrogenase A introns 1 and 5 (LDHA1, LDHA5), ribosomal protein S7 (RPS7), triose phosphate isomerase (TPI), myoglobin (Mb), glucose-6-phosphate dehydrogenase (G6PD), rhodopsin (Rhod), SEC61 (SEC61), titin-like protein (TMO-4C4) and creatine kinase intron 7 (CK7)) using primers listed in Table II. Primers for bty, LDHA1, Mb, Rhod, and SEC61 were designed from published GenBank sequences (AY454308, AF170027, AF547166, AY141302 and AY113841, respectively). Reactions contained 2.4 µl 25 mM MgCl (Sigma, St. Louis, MO), 3 µl 10x PCR buffer (500 mM KCl + 100 mM Tris-HCl, pH = 8.0), 0.6 µl 10 mM dNTP mix, 0.6 µl 10 mM forward primer, 0.6 µl 10 mM reverse primer, 0.3 µl JumpStart Taq DNA Polymerase (Sigma, St. Louis, MO) and 1 µl DNA template. PCR reactions were carried out in a RoboCycler 96 Gradient Cycler (Stratagene, La Jolla, CA) and consisted of: an initial denaturation of 2 min at 94°C, followed by 35–45 cycles of denaturing at 94°C for 45 sec, annealing at 50–62°C for 1 min, and extending at 72°C for 1 min, with a final extension of 5 min at 72°C.
Table II. Dissostichus mawsoni PCR primers. Ta = annealing temperature (°C).

PCR products were run on 2% agarose gels to check the success of amplification. PCR products were then purified for sequencing using AMPure® beads according to manufacturer's protocol (Agencourt Bioscience, Beverly, MA). Cycle sequencing reactions in both directions were run in a PTC-100 programmable thermocycler (MJ Research, Inc, Waltham, MA) under the following conditions: 50 cycles of 94°C for 15 sec, 48°C for 20 sec, and 60°C for 4 min using the ABI BigDye® Terminator v3.1 Cycle Sequencing Kit following the manufacturers instructions (Applied Biosystems Inc, Foster City, CA). Sequencing reactions were prepped for sequencing using an ethanol/EDTA/sodium acetate precipitation protocol (Applied Biosystems Inc., Foster City, CA). Sequencing reactions were read using a SpectruMedix SCE2410 capillary sequencer (SpectruMedix, State College, PA). Sequences were edited and aligned using the program SeqManII (DNASTAR Inc, Madison, WI). Varying numbers of PCR products were sequenced for SNP discovery (n = 4 to 53 for nuclear amplicons; n = 32 to 68 for mitochondrial amplicons).
For two mitochondrial amplicons, overlapping sequences were assembled to yield a combined cytochrome b/tRNA-Thr/tRNA-Pro/control region amplicon. The most common haplotype was considered the reference sequence and submitted to GenBank (Accession number EF088420). For nuclear amplicons, reference sequences were obtained by direct sequencing of amplicons from homozygous individuals and deposited in GenBank: (EF535029 (Dyst6a), EF088418 (CaM), EF088421 (MLL), EF088423 (Rhod), EF088427 (G6PD), EF088419 (CK7), EF088417 (TPI), EF088426 (SEC61), EF088422 (Mb), EF088424 (TMO-4C4) and EF088425 (LDHA)). All sequences were examined for potentially informative SNPs, which were scored either by RFLP analysis, dCAPS or FP-TDI (see below).
SNP discovery and assay validation
In total, 14 nuclear amplicons were sequenced for SNP discovery, of which three were not used for population surveys due to low polymorphism or technical artifacts. Amplicons from 21 individuals sequenced in both directions for the titin-like protein gene (TMO-4C4) showed only two singleton mutations (Table III). Four individuals sequenced for L-lactate dehydrogenase A intron 1 showed two single nucleotide polymorphisms. The bloodthirsty (bty) amplicon was sequenced in both directions (613 bp) for 18 D. mawsoni individuals and was found to contain numerous sites at which all individuals were heterozygous. Additional sequencing of this amplicon from other notothenioid species (six Dissostichus eleginoides individuals, two Notothenia coriiceps Richardson, 1844, four N. rossii Richardson, 1844 and seven Champsocephalus gunnari Lönnberg, 1905) revealed the same pattern, suggesting the existence of a co-amplified duplicate bty locus in notothenioids.
Table III. Dissostichus mawsoni nuclear DNA polymorphisms. Major SNPs scored in boldface. GenBank Accession numbers in parentheses. Singleton substitutions marked with a superscript. +/- = insertion/deletion polymorphism. Nucleotides in coding sequence are indicated by (c).

The remaining 11 nuclear amplicons yielded high quality sequencing data, allowing for development of SNP scoring assays. Nine SNPs were initially scored by the FP-TDI method described below (LDHA:1224, SEC61:44, G6PD:130, G6PD:260, RPS7:374, TPI:127, CK7:136, CaM:203 and Rhod:243). FP-TDI analyses clustered individuals corresponding to putative genotypes. However, for six of the nine SNP loci scored, there were discrepancies between FP-TDI genotype calls and direct sequencing base calls (Table IV). Ultimately, we scored three SNPs using FP-TDI (CK7:136, RPS7:374 and TPI:127), one (CaM:203) by dCAPS and six (CK7:417, Dyst6a:78, LDHA:1908, Mb:276, Mb:301 and MLL:95) by RFLP analysis.
Table IV. Comparison of SNP genotype calls obtained by FP-TDI (shown in parentheses) with genotypes obtained by direct sequencing, RFLP or dCAPS.

Template directed Dye Terminator Incorporation assay (FP-TDI)
Initial PCR reactions were carried out as described above. 7.5 µl of the PCR product was purified using 2.5 µl of an ExoAP mixture containing 0.5 µl Antarctic phosphatase (New England Biolabs, Beverly, MA), 0.5 µl dH2O, 1 µl Antarctic phosphatase buffer and 0.5 µl of dilute Exonuclease I (Exo) (1 µl concentrated Exonuclease I into 9 µl exonuclease buffer (New England Biolabs, Beverly, MA)). Upon completion of the ExoAP digestion (37°C for 1 hour followed by 65°C for 5 min to inactivate the enzymes), the following protocol was used for the FP-TDI single-base primer extension reaction based on Chen et al. (Reference Chen, Levine and Kwok1999) and Hsu et al. (Reference Hsu, Chen, Duan, Miller and Kwok2001). To each 10 µl sample, a total of 10 µl of the following mixture was added: 0.01 µl of each fluorescently labelled ddNTP (PerkinElmer, Waltham, MA), 0.1 µl of each unlabelled ddNTP (Amersham Biosciences, Piscataway, NJ), 5.48 µl of 5X TDI reaction buffer, 0.3 µl Therminator Taq polymerase (New England Biolabs, Beverly, MA), and 4 µl of the 10 µM SNP primer (30 bp primer adjacent to the SNP site). The samples were then placed into a MWG Primus 96 thermocycler (MWG Biotech, High Point, NC) for an initial denaturation of 1 minute at 93°C followed by 35 cycles of 93°C for 10 sec and 55°C for 30 sec. Upon completion of the primer extension protocol, 10 µl of a mixture containing 0.1 µl 2.2 µg µl-1 single stranded binding protein (used to enhance polymerase fidelity by reducing misincorporation) (USB, Cleveland, OH), 2 µl 5X TDI buffer, and 7.9 µl dd-H2O was added to the samples. The mixtures were then incubated at 37°C for one hour and then held at 4°C until needed. The samples were then transferred to a Costar 96-well plate for fluorescence polarization (FP-TDI) measurement with a POLARstar OPTIMA microplate reader (BMG Labtech, Durham, NC).
Because each SNP examined was bi-allelic, the reaction mixture contained two differently labelled ddNTPs. For ddCTP, a ROX-labelled dye was used (excitation filter wavelength 584 nm, emission filter wavelength 612 nm). ddATP was labelled with fluorescein dye (excitation filter wavelength 485 nm, emission filter wavelength 520 nm) and ddUTP was labelled with R6G (excitation filter wavelength 520 nm, emission filter wavelength 520 nm). ddGTP was labelled with TAMRA (excitation filter wavelength 544 nm, emission filter wavelength 590 nm). Visual separation of genotypes was achieved by plotting polarization values from the two bases scored for each locus (see Fig. 1).

Fig. 1. FP-TDI graphical output of the CK7:136 polymorphism. Grey squares = T/T, diamonds = G/T, triangles = G/G, black squares = negative controls.
Restriction Fragment Length Polymorphism (RFLP) analysis
Ten SNPs were examined with restriction enzymes (all obtained from New England Biolabs (Beverly, MA) with the exception of EcoRI (MBI Fermentas, Hanover, MD)): cyt b:86 (HinfI), cyt b:266 (Sau96I), ND2:438 (NgoMIV), 16S:1228 (HaeIII), MLL:95 (DpnII), Dyst6a:78 (HinfI), CK7:417 (RsaI), Mb:276 (ApoI), Mb:301 (HinfI) and LDHA:1908 (EcoRI). Restriction enzyme digests were performed in 12 µl volumes containing 6 µl amplified PCR product, 4.5 µl dH2O, 1.2 µl 10X reaction buffer and 0.3 µl of enzyme (10 000 U ml-1) at 37–65°C (as per manufacturer's protocol) for 2–4 hours and subsequently scored on 2% agarose gels.
Derived Cleaved Amplified Polymorphic Sequence (dCAPS)
The dCAPS method (Neff et al. Reference Neff, Neff, Chory and Pepper1998) was used to score the polymorphism at position 203 in the CaM amplicon. This method incorporates a restriction enzyme recognition site, which includes the SNP, into the PCR product by utilizing a primer with one or more deliberate mismatches to the template DNA (Neff et al. Reference Neff, Neff, Chory and Pepper1998). The PCR product is then subjected to restriction enzyme digestion and the presence or absence of the designated SNP is scored (Neff et al. Reference Neff, Neff, Chory and Pepper1998).
Each PCR reaction contained 1.4 µl 25 mM MgCl (Sigma, St. Louis, MO), 1.7 µl 10x PCR buffer (500 mM KCl + 100 mM Tris-HCl, pH = 8.0), 0.3 µl 10 mM dNTP mix, 0.3 µl 10 mM forward primer (5′ CATGTGATAGTGGTAAAGAGATGTA), 0.3 µl 10 mM reverse primer (5′ TTGTGAAACCAAAAATCCTA), 0.2 µl JumpStart Taq DNA Polymerase (Sigma, St. Louis, MO) and 2 µl DNA template to generate a final volume of 17 µl. PCR reactions were carried out in a RoboCycler 96 Gradient Cycler (Stratagene, La Jolla, CA) and consisted of: an initial denaturation of 2 min at 94°C, followed by 35 cycles of denaturing at 94°C for 45 sec, annealing at 50°C for 45 sec and extending at 72°C for 1 min, with a final extension of 5 min at 72°C. Restriction enzyme digests were performed in 12 µl volumes containing 6 µl amplified PCR product, 4.5 µl dH2O, 1.2 µl 10X reaction buffer and 0.3 µl of enzyme RsaI (10 000 U ml-1) at 37°C for 2–4 hours and then subsequently scored on 10–15% precast acrylamide Criterion gels (Bio-Rad Laboratories, Hercules, CA).
Analysis of population structure
Analysis of molecular variance (AMOVA) was applied to both nuclear and mitochondrial data using ARLEQUIN version 3.11 (Excoffier et al. Reference Excoffier, Laval and Schneider2005). AMOVA evaluates patterns of molecular variation within and among populations, taking into account the sequence divergence of molecular haplotypes as well as their frequencies. The degree of population subdivision was described by F-statistics (Weir & Cockerham Reference Weir and Cockerham1984). Nucleotide (π) and haplotype (h) diversities were calculated for mitochondrial and nuclear sequence data using the program DnaSP v. 4.10.9 (Rozas et al. Reference Rozas, Sánchez-DelBarrio, Messeguer and Rozas2003). StatXact 4.0.1 (Cytel, Cambridge, MA) provided exact R×C tests for comparison of haplotype frequencies. Nonmetric multidimensional scaling of Nei's (Reference Nei1978) genetic similarity values was performed using SYSTAT 11 (Systat Software, San Jose, CA). In order to minimize statistical artifacts in evaluating tables of p-values, we used the false discovery rate (FDR) procedure of Benjamini & Yekutieli (Reference Benjamini and Yekutieli2001) as presented by Narum (Reference Narum2006).
Mitochondrial DNA
Median-joining networks are commonly used to depict relationships of closely related mitochondrial or nuclear haplotypes, for which traditional phylogenetic approaches yield multiple plausible trees (Bandelt et al. Reference Bandelt, Forster and Roehl1999). Median-joining networks were generated for D. mawsoni from mitochondrial DNA sequence data using Network v. 4.0.1.7 (www.fluxus-engineering.com). From preliminary data, a network file was generated from nine mitochondrial SNPs (Fig. 2, Table V). The four mitochondrial SNPs that were observed in multiple individuals (cyt b:86, cyt b:266, 16S:1228 and ND2:438) were used for further analyses (see Fig. 3 and Table VI).

Fig. 2. Median-joining network of composite haplotypes based on the cyt b/tRNA/CR, ND2 and 16S amplicons from Dissostichus mawsoni. Geographical source of each haplotype is indicated (black = RD88.1, white = RD88.2, dark grey = AAT1, Medium grey = AAT2, Light grey = SS). Mutations separating haplotypes are indicated on the branches.

Fig. 3. CCAMLR map of Dissostichus mawsoni sampling locations showing major mtDNA haplotype frequencies.
Table V. Dissostichus mawsoni mitochondrial DNA polymorphisms. Singleton substitutions marked with a superscript. GenBank Accession numbers in parentheses. SNPs scored in all individuals in boldface.
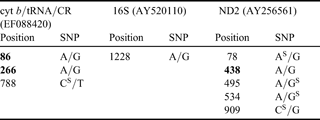
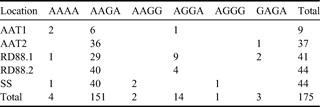
Table VI. Mitochondrial haplotype counts in Dissostichus mawsoni (cyt b:86, cyt b:266, 16S:1228 and ND2:438). Collections RD88.1A–RD881.D were pooled in view of homogeneous haplotype frequencies (R×C exact P = 0.927).

Nuclear DNA
For each locus, genotypic proportions within populations were compared to Hardy-Weinberg Equilibrium (HWE) expectations using the Markov chain method (Guo & Thomson Reference Guo and Thompson1992) implemented in ARLEQUIN v. 3.11 (Excoffier et al. Reference Excoffier, Laval and Schneider2005). Analysis included resampling 10 000 iterations per batch for 100 batches. The inbreeding coefficient, f, was calculated for the nuclear data using the program FSTAT (Goudet Reference Goudet1995). Heterogeneity of allelic frequencies among sampled populations was tested by exact R×C tests (StatXact 4.0.1, Cytel). Linkage disequilibrium between nuclear SNPs was calculated using the programme in ARLEQUIN v. 3.11 (Excoffier et al. Reference Excoffier, Laval and Schneider2005) while genotypic disequilibrium between loci was calculated using the programme FSTAT (Goudet Reference Goudet1995).
For nuclear gene data, the programme PHASE Version 2.1 (http://www.stat.washington.edu/stephens/software.html) was used to infer gametic phase in individuals heterozygous at two or more nucleotide positions (Stephens et al. Reference Stephens, Smith and Donnelly2001). In all cases, certainty of correct inference of gametic phase was estimated at 100% by PHASE.
Results
Mitochondrial DNA
In total, nine variable nucleotide positions were identified in the four amplicons sequenced (Table V). Five of these were synonymous substitutions in protein-coding regions, while two were non-synonymous and two were in non-coding regions. All seven synonymous and non-synonymous substitutions were at the third position. The transition/transversion ratio was 8:1. Nucleotide diversity (π) varied among amplicons from 0.00–0.03% (mean = 0.018%) while haplotype diversity (h) ranged from 0.000–0.182 (mean = 0.094) (Table VII). For this preliminary dataset (n = 38 sequences), AMOVA showed no genetic differentiation among populations (FST = 0.000, P = 0.44). The genealogical relationships among the resulting haplotypes are depicted in Fig. 2.
Table VII. Haplotype (h) and nucleotide (π) diversities and number of individuals sequenced (N) for mtDNA and nDNA loci for both Dissostichus eleginoides and D. mawsoni.

Previously published mitochondrial DNA sequences for D. mawsoni differed slightly from sequences obtained in this study. For the ND2 amplicon, the common haplotype was identical to AY256561; the other published sequence, from a Ross Dependency toothfish (DQ184498), differed by a single synonymous substitution (C → T at position 732). We did not observe this haplotype in our collections. For the cyt b region, the sequence obtained by Sanchez et al. (Reference Sanchez, Dettaï, Bonillo, Ozouf-Costaz, Detrich and Lecointre2007, GenBank DQ498816) differed from our common haplotype by two replacement substitutions at positions 616 (Glu → Ala) and 640 (Gln → Leu). For both amino acids, the residues observed in our sequence data are universal in notothenioids and other Perciformes, whereas the substitutions presented in DQ498816 have not been previously observed in notothenioids or other Perciformes. We did not observe any variation in the control region; a specimen from Terre Adelie (DQ487352) differed by a deletion of nucleotide 878 and a C → A transition at position 1248 compared to our sequence (EF488420).
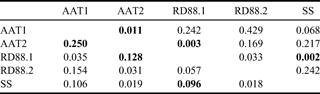
Four common mitochondrial SNPs (cyt b:86, cyt b:266, 16S:1228 and ND2:438) were scored for the complete sample set by RFLP analysis (Table VI). AMOVA showed significant differentiation among the five groups (FST = 0.074, P = 0.00148), accounting for 7.4% of the total variation. Pairwise FST comparisons (Table VIII) showed RD88.1 to differ significantly from SS and AAT2, and AAT1 to differ from AAT2.
Table VIII. Pairwise mitochondrial FST estimates for Antarctic toothfish populations (below diagonal). Unadjusted p-values are shown above diagonal; comparisons significant after adjustment for multiple testing are shown in boldface.

Smith et al. (Reference Smith, Gaffney and Purves2001) reported that HaeIII digestion of the 16S rRNA amplicon provided a diagnostic marker that distinguished D. mawsoni from D. eleginoides. Four out of 178 D. mawsoni individuals exhibited a HaeIII digestion pattern identical to that of D. eleginoides (n = 42), underscoring the desirability of multiple independent markers for reliable species identification.
Nuclear DNA
In total, 89 variable sites were identified in the 13 nuclear amplicons sequenced (excluding bty), eight in coding sequence and 81 in introns (Table III). Of these, nine were insertion/deletion polymorphisms, six of which were perfect or imperfect repeats of motifs two to nine base pairs in length, while the others (G6PD: 186..205, Dyst6a: 416..420 and Dyst6a: 1063..1067) were simple indels. SNPs in coding regions showed a transition/transversion ratio of 1.67, with five synonymous substitutions (all third position) and three non-synonymous substitutions (two first position and one second position). For non-coding SNPs, the transition/transversion ratio was 0.71 (not significantly different from the coding transition/transversion ratio (Fisher's exact P = 0.159)). Nucleotide diversity (π) varied among amplicons from 0.03–0.89% (mean = 0.35%) while haplotype diversity (h) ranged from 0.181–1.000 (mean = 0.67) (Table VII).
Comparisons with previously published sequence data were possible for three of the nuclear amplicons (Dyst6a, MLL and TMO-4C4). For Dyst6a, the published sequence (AF137119) differed from our sequences by seven substitutions and 15 indels. For MLL, the published sequence (AF137249) differed from our sequences by two nucleotide substitutions and two single-base indels. Our TMO-4C4 sequence differed from GenBank AY517803 by six nucleotides, all of which were found in the within the terminal 10 bp at either end of the latter, indicating possible sequencing errors in the previously published entry. In general, the degree of sequence divergence between the previously published sequences and those observed in our study is much higher (2.4% for Dyst6a, 2.3% for MLL, 1.5% for TMO-4C4) than the levels observed among individuals we examined (0.49% for Dyst6a, 0.33% for MLL, 0.06% for TMO-4C4), suggesting the presence of sequencing artifacts in the original GenBank entries.
Three tests for departure from HWE were significant after adjustment for multiple testing (Table IX). Significant among-region heterogeneity was observed for two of the 10 SNP loci (Table X). No gametic phase disequilibrium between SNPs was detected, except for two closely linked loci (Mb: 276–Mb: 301 in the South Shetland population (P < 0.00005). Hierarchical multilocus AMOVA showed no pattern of global differentiation (FST among Subareas = 0.0009, P = 0.41), but significant differentiation among collections within Subareas (FST = 0.024, P = 0.032) for the 10 nuclear SNPs analysed. Patterns of within-Subarea heterogeneity are shown by pairwise FST estimates (Table XI).
Table IX. Dissostichus mawsoni nuclear SNP frequencies. N=the number of individuals scored. f represents the inbreeding coefficient. Significant f values shown in boldface. All f represents the mean f across all loci.

Table X. Locus by locus AMOVA for D. mawsoni nuclear SNPs. Significant p-values for FST after adjustment for multiple testing are shown in boldface. f, the inbreeding coefficient, was calculated for loci with homogeneous allelic frequencies among populations.

Table XI. Pairwise nuclear FST estimates for Antarctic toothfish populations (below diagonal). Unadjusted p-values are shown above diagonal; comparisons significant after adjustment for multiple testing are shown in boldface.

Discussion
Single nucleotide polymorphisms are the most prevalent form of genetic variation (Brumfield et al. Reference Brumfield, Beerli, Nickerson and Edwards2003, Seddon et al. Reference Seddon, Parker, Ostrander and Ellegren2005), providing a virtually unlimited number of nuclear loci for genetic studies. Although the use of SNPs in non-model species is relatively recent, their potential for elucidating population structure and demographic history is great (Morin et al. Reference Morin, Luikart and Wayne2004, Seddon et al. Reference Seddon, Parker, Ostrander and Ellegren2005, Kuhn & Gaffney Reference Kuhn and Gaffney2006). The number of SNPs required to distinguish populations will depend upon the size of the populations studied, the genetic diversity of the populations, past and present patterns of gene flow between populations and the polymorphism of the SNPs (Seddon et al. Reference Seddon, Parker, Ostrander and Ellegren2005).
Methods for scoring SNPs are numerous. In this study we chose the FP-TDI platform on the basis of reported robustness, cost effectiveness and high throughput capabilities. Hsu et al. (Reference Hsu, Chen, Duan, Miller and Kwok2001) reported 100% concordance between SNP genotypes scored by FP-TDI and 5′-nuclease assays in a study that examined 90 individuals scored for 38 SNP loci. Similarly, Akula et al. (Reference Akula, Chen, Hennessy, Schulze, Singh and McMahon2002) found 100% agreement for 631 genotypes scored by FP-TDI and RFLP methods, while Helms et al. (Reference Helms, Cao, Krueger, Wijsman, Chamian, Gordon, Heffernan, Daw, Robarge, Ott, Kwok, Menter and Bowcock2003) reported differences of 0.2–0.3% between scores from FP-TDI and Pyrosequencing for two loci. In the current investigation, although all SNP loci scored by FP-TDI yielded distinct and readily scored clusters, discrepancies between FP-TDI scores and SNP genotypes obtained by other methods (direct sequencing, RFLP or dCAPS) occurred at rates greater than 10% in six of the 15 SNP loci initially evaluated (Table IV). For all six loci, FP-TDI assays showed higher frequencies of heterozygotes than the other methods, suggesting the possibility of template contamination during the FP-TDI assays.
For the mitochondrial and nuclear genes examined in this study, the Antarctic toothfish displays greatly reduced levels of sequence diversity (π) compared to D. eleginoides (Table VII). Mitochondrial sequence diversity is approximately twenty-five times greater in the latter, while nuclear gene sequence diversity is roughly two and a half times greater. Allozyme surveys likewise showed higher levels of polymorphism in D. eleginoides (P95 = 64%, 11 loci, Smith & McVeagh Reference Smith and McVeagh2000) than in D. mawsoni (P95 = 7%, 30 loci, McDonald et al. Reference McDonald, Smith, Smith, Novak, Johns and DeVries1992), although the low estimate for the latter may be biased by low sample sizes. These striking differences in the face of similar life histories suggest a considerably greater effective population size in the Patagonian toothfish, reflecting either greater abundance or a reduced susceptibility to historical population bottlenecks.
Although the degree of population geographic structure estimated from mtDNA in the Antarctic toothfish (FST = 0.074) is low compared to its sister species D. eleginoides (FST = 0.768, see Kuhn Reference Kuhn2007), our results show genetically distinct populations in D. mawsoni in the South Shetland Islands, the Ross Dependency and the Australian Antarctic Territory (Fig. 3). The pattern of nuclear SNP differentiation is consistent with the mtDNA data, and also revealed differentiation within the Ross Dependency between CCAMLR Subareas 88.1 and 88.2 (Fig. 4). These data are concordant with the RAPD analysis conducted by Parker et al. (Reference Parker, Paige and DeVries2002) which showed genetic differentiation between the Ross Dependency (McMurdo Sound) and the Antarctic Peninsula.

Fig. 4. Nonmetric multidimensional scaling plot of D. mawsoni populations based on Nei's (Reference Nei1978) genetic similarity estimates for nuclear SNP data. Solid triangles = Australian Antarctic Territory (Subarea 58.4.2), solid circles = Ross Dependency (Subarea 88.1), gray circle = Ross Dependency (Subarea 88.2), solid square = South Shetland Islands (Subarea 48.1).
Genetic differentiation of D. mawsoni populations may be a result of separation due to geographical features in the Southern Ocean. The Weddell Sea gyre and the Ross Sea gyre, two major cyclonic clockwise circulations in the Southern Ocean, may play a role in the isolation of populations (Orsi et al. Reference Orsi, Whitworth and Nowlin1995, Smith & Gaffney Reference Smith and Gaffney2005). Natal site fidelity has also been suggested as a factor promoting population subdivision in D. mawsoni (Parker et al. Reference Parker, Paige and DeVries2002).
Our results are consistent with the existence of limited gene flow among Antarctic toothfish populations within the regions sampled (Australian Antarctic Territory, Ross Dependency and the South Shetland Islands); however, additional sampling will be necessary to determine whether this species exhibits discrete stock structure or a pattern of isolation by distance across its global distribution. In any case, the evidence for population subdivision found in this and previous studies should be incorporated into fisheries management plans for the Antarctic toothfish.
Acknowledgements
We thank Peter Smith for providing tissue samples. NSF REU interns Ami Hamilton and Veronica Searles assisted with RFLP analyses. This research was supported in part by National Science Foundation award ANT-0338294 to PMG.