


Introduction
Neurocognitive dysfunction is frequently observed in individuals with mood disorders. During episodes of depression, deficits have been reported across multiple cognitive domains (Elliott, Reference Elliott1998), including attention (Lemelin et al. Reference Lemelin, Baruch, Vincent, Laplante, Everett and Vincent1996; MacQueen et al. Reference MacQueen, Tipper, Young, Joffe and Levitt2000; Cohen et al. Reference Cohen, Lohr, Paul and Boland2001), executive functioning (Goodwin, Reference Goodwin1997; Veiel, Reference Veiel1997; Fossati et al. Reference Fossati, Amar, Raoux, Ergis and Allilaire1999; Moritz et al. Reference Moritz, Birkner, Kloss, Jahn, Hand, Haasen and Krausz2002; Porter et al. Reference Porter, Gallagher, Thompson and Young2003), verbal and visuospatial memory (Austin et al. Reference Austin, Mitchell, Wilhelm, Parker, Hickie, Brodaty, Chan, Eyers, Milic and Hadzi-Pavlovic1999; Porter et al. Reference Porter, Gallagher, Thompson and Young2003; Taylor Tavares et al. Reference Taylor Tavares, Clark, Cannon, Erickson, Drevets and Sahakian2007) and psychomotor speed (Caligiuri & Ellwanger, Reference Caligiuri and Ellwanger2000). Several meta-analytic studies have concluded that patients with major depression exhibit a broad profile of deficits of moderate severity, particularity in effortful mnemonic processes (Christensen et al. Reference Christensen, Griffiths, Mackinnon and Jacomb1997; Zakzanis et al. Reference Zakzanis, Leach and Kaplan1998), which correlate with severity of depression (McDermott & Ebmeier, Reference McDermott and Ebmeier2009). Significant improvement has been shown in clinical remission, especially in episodic memory function (Clark et al. Reference Clark, Sarna and Goodwin2005; Neu et al. Reference Neu, Bajbouj, Schilling, Godemann, Berman and Schlattmann2005; Gallagher et al. Reference Gallagher, Robinson, Gray, Porter and Young2007), in most but not all studies, although some debate remains as to the extent, magnitude and time course of this improvement (Hasselbalch et al. Reference Hasselbalch, Knorr and Kessing2011).
In contrast to major depressive disorder (MDD), much of the work on the neurocognition of bipolar disorder (BD) has focused on the euthymic state. In part this has been driven by the question of whether cognitive deficits precede the onset of the disorder and are therefore a trait (or endophenotypic marker) of the illness. Several meta-analyses have described evidence of deficits in multiple aspects of attention, executive functioning, memory and psychomotor speed in euthymia (Robinson et al. Reference Robinson, Thompson, Gallagher, Goswami, Young, Ferrier and Moore2006; Torres et al. Reference Torres, Boudreau and Yatham2007; Arts et al. Reference Arts, Jabben, Krabbendam and van Os2008; Bora et al. Reference Bora, Yucel and Pantelis2009; Bourne et al. Reference Bourne, Aydemir, Balanzá-Martínez, Bora, Brissos, Cavanagh, Clark, Cubukcuoglu, Dias, Dittmann, Ferrier, Fleck, Frangou, Gallagher, Jones, Kieseppä, Martínez-Aran, Melle, Moore, Mur, Pfennig, Raust, Senturk, Simonsen, Smith, Soares, Soeiro-de-Souza, Stoddart, Sundet, Szöke, Thompson, Torrent, Zalla, Craddock, Andreassen, Leboyer, Vieta, Bauer, Worhunsky, Tzagarakis, Rogers, Geddes and Goodwin2013). By contrast, relatively few studies have focused specifically on the depressed phase of BD. This is surprising given the evidence from prospective, longitudinal studies that patients experience mood symptoms approximately half of the time they have the disorder, with depressive symptoms being significantly more prevalent (Judd et al. Reference Judd, Akiskal, Schettler, Endicott, Maser, Solomon, Leon, Rice and Keller2002, Reference Judd, Akiskal, Schettler, Coryell, Endicott, Maser, Solomon, Leon and Keller2003). Ascertaining the neuropsychological performance of patients during these episodes is therefore of great importance.
In general, there seems to be a degree of overlap in the cognitive domains affected in bipolar depression and MDD. However, because of the paucity of studies, only limited comparisons have been possible. Some studies indicate that the severity of impairment in bipolar depression is greater than in MDD (Wolfe et al. Reference Wolfe, Granholm, Butters, Saunders and Janowsky1987; Deptula et al. Reference Deptula, Manevitz and Yozawitz1991; Borkowska & Rybakowski, Reference Borkowska and Rybakowski2001; Xu et al. Reference Xu, Lin, Rao, Dang, Ouyang, Guo, Ma and Chen2012), although not all have found this (Popescu et al. Reference Popescu, Ionescu, Jipescu and Popa1991). In terms of the actual profile, this is difficult to characterize because of the relatively small number of studies, differences in the clinical characteristics of the samples (including medication-related issues), the wide range of measures used or the precise focus of the design (i.e. a broad assessment or a focus on a specific process/hypothesis). For example, Martinez-Aran et al. (Reference Martinez-Aran, Vieta, Reinares, Colom, Torrent, Sanchez-Moreno, Benabarre, Goikolea, Comes and Salamero2004) reported statistically significant performance decrements in depressed BD patients compared to controls in every test administered in a broad battery assessing multiple aspects of executive function and attention, verbal and non-verbal learning and memory. Similarly, Basso et al. (Reference Basso, Lowery, Neel, Purdie and Bornstein2002) reported significantly worse performance in depressed BD-I in-patients in multiple verbal memory processes (from the California Verbal Learning Test, CVLT), executive function and motor speed (verbal fluency, the Trail Making Test and Grooved Pegboard) compared to controls. However, in an earlier study using a similar series of tests, Neu et al. (Reference Neu, Kiesslinger, Schlattmann and Reischies2001) found that depressed BD patients performed significantly worse than controls on verbal fluency only, with no differences in the Trail Making Test, Wechsler visual memory or the Rey Auditory Verbal Learning Test (Rey-AVLT), although the latter test was not administered in a standard format and a correction for multiple comparisons was applied to the significance tests. By contrast, Dixon et al. (Reference Dixon, Kravariti, Frith, Murray and McGuire2004) found no differences between bipolar depressed patients and controls on either phonological or semantic fluency tests, but did see differences in other executive measures (Stroop, Hayling Sentence Completion Test).
Several studies have used combinations of tests from the Cambridge Neuropsychological Test Automated Battery (CANTAB) to explore aspects of attention, executive function and visuospatial memory in bipolar depression, with mixed findings. Some studies have found very few differences between depressed BD patients and controls (Sweeney et al. Reference Sweeney, Kmieca and Kupfer2000), especially in medication-free patients (Taylor Tavares et al. Reference Taylor Tavares, Clark, Cannon, Erickson, Drevets and Sahakian2007; Holmes et al. Reference Holmes, Erickson, Luckenbaugh, Drevets, Bain, Cannon, Snow, Sahakian, Manji and Zarate2008; Roiser et al. Reference Roiser, Cannon, Gandhi, Tavares, Erickson, Wood, Klaver, Clark, Zarate, Sahakian and Drevets2009), whereas others have reported widespread impairments, at a clinically significant level (<5th percentile of controls) in up to 42% of the group (Rubinsztein et al. Reference Rubinsztein, Michael, Underwood, Tempest and Sahakian2006). Broad deficits have also been described using the multiple subscales of the Wechsler Adult Intelligence Scale-III (WAIS-III; Schneider et al. Reference Schneider, Candiago, Rosa, Ceresér and Kapczinski2008). Other studies have sought to explore specific deficits and the underlying mechanisms. For example, Fossati et al. (Reference Fossati, Harvey, Le Bastard, Ergis, Jouvent and Allilaire2004) focused on the verbal episodic memory deficits in bipolar depression compared to controls and other depressed groups (first-episode MDD and recurrent MDD), with deficits being associated with episode recurrence (i.e. only in the bipolar and recurrent MDD groups). Burdick et al. (Reference Burdick, Gunawardane, Goldberg, Halperin, Garno and Malhotra2009) explored a range of tests of psychomotor speed and attention and reported that deficits were restricted to effortful but not automatic processes, and Kerr et al. (Reference Kerr, Scott and Phillips2005) used the Stroop test to explore the effect of emotional content on attentional processes and found that patients showed general attentional deficits compared to controls.
The effect of heterogeneity in samples and tests across studies is reflected in a meta-analysis that focused on neuropsychological functioning in BD, across symptomatic states, and also in euthymia (Kurtz & Gerraty, Reference Kurtz and Gerraty2009). This review found only five papers that met inclusion criteria for the bipolar depression analysis. From these studies, the only tests for which data could be extracted, according to their criteria of requiring similar tests/procedures from at least three, were Trails A (psychomotor speed/attention) and Trails B (executive function: set-shifting), verbal fluency (executive function: language) and verbal memory (the Rey-AVLT or the CVLT). The pooled effect sizes for each of these indicated medium to large effect sizes (Cohen's d = 0.64–1.20). A direct comparison with euthymic patients across these measures revealed significantly greater verbal fluency and verbal learning deficits in depressed individuals.
The aim of the present study was to extend previous findings by assessing a broad range of cognitive processes in a well-characterized patient sample and in matched controls. From the findings of previous studies, one important outstanding question relates to the precise profile and extent of the deficits observed in bipolar depression. When interpreting this profile it is necessary to acknowledge both the hierarchical organization of human cognitive functions and the complex interplay between different processes. The conceptualization of the observed deficits is fundamentally altered if the processes assessed do not operate independently. It is also important to note individual differences in performance, which lead to increased statistical variation when deficits are explored solely at the group level. A two-phase approach was therefore adopted with the data analysis: (i) the magnitude of differences between patients and controls is described not only in terms of effect size and accompanying statistical significance but also in terms of the percentile standing of patients within the control data. This should provide a clearer understanding of inter-individual variation in performance in bipolar patients. (ii) Principal component analysis (PCA) techniques were used to explore and better understand the component structure of neurocognitive processes. This approach also addresses the issue of how to deal with multiple outcome measures, which are an inherent feature of studies that aim to fully profile the range of cognitive functions.
Method
A cohort of 100 participants (53 bipolar patients and 47 controls) completed the study. Recruitment was part of an extended research programme into the effects of glucocorticoid receptor antagonists in bipolar depression (Watson et al. Reference Watson, Gallagher, Porter, Smith, Herron, Bulmer, Young and Ferrier2012).
Participants
Patients aged 18–65 years with a diagnosis of BD, confirmed using the SCID (First et al. Reference First, Spitzer, Williams and Gibbon1995), were recruited from secondary and tertiary care services in the North East of England. All were out-patients and currently in a depressive episode (SCID defined). Patients were excluded if they met criteria for any other current Axis I disorder, including anxiety disorder, schizophrenia or substance dependence/abuse. Illness characteristics, clinical ratings and medication history were determined by trained psychiatrists using full history, case-note and medication review and standardized rating scales.
Healthy control subjects were recruited by general advertisement. All controls were screened prior to testing to exclude anyone with a personal or family history (first-degree) of psychiatric illness, significant medical or neurological illness likely to affect neuropsychological functioning, or history of drug/alcohol abuse.
After a complete description of the study, written informed consent was obtained from all participants. The study was approved by the Newcastle and North Tyneside Local Research Ethics Committee.
Cognitive tests
Testing was carried out in a bespoke neuropsychological testing suite. All testing was carried out at the same time of day (early afternoon, to control for possible diurnal confounds) by one of the authors (P.G.) or a trained, experienced research assistant. As outlined in the introduction, a broad cognitive test battery was used, including computerized tests and traditional pen-and-paper measures, to assess attention and executive function, immediate memory, verbal and visuospatial learning and memory and psychomotor speed. These have been used in previous studies and are listed in the following text.
CANTAB Spatial Working Memory (SWM)
The SWM is a self-ordered search task that requires subjects to search for hidden tokens within a spatial array. The number of between-search errors (occasions when a subject returns to a square under which a token has been previously found) and within-search errors (occasions when a subject returns to a square already searched within a search sequence) are recorded, along with a strategy measure (where a lower strategy score reflects a more systematic search strategy).
CANTAB Spatial Recognition (SRec)
The SRec is a memory task in which subjects view five identical ‘squares’ presented in serial order in differing positions on the screen and are subsequently required to identify, from a choice of two squares, the one that occupies one of the five locations shown previously. Subjects complete four sets. The percentage of correct responses is recorded.
CANTAB Spatial Recognition-modified (SRec-m)
This modified version of the SRec task is identical to the standard version except that two sets of seven squares and then two sets of nine squares are used. The percentage of correct responses for sets 7 and 9 are recorded.
CANTAB Spatial Span and Reverse Spatial Span (SSp rSSp)
This test is analogous to the Corsi Block task, where participants must reproduce a spatial sequence, and is administered in the standard format and then reverse (where subjects tap the sequence in the opposite order from presentation). The maximum span reached is recorded for each.
Visual Patterns Test (VPT)
The VPT is a test of short-term visual memory in which subjects are required to remember and reproduce increasingly complex ‘checkerboard’ patterns (Della Sala et al. Reference Della, Gray, Baddeley, Allamano and Wilson1999). The test is scored in the same way as the SSp task with the maximum set size achieved being recorded.
CANTAB Pattern Recognition (PRec)
The PRec is a test of visual recognition memory in which subjects view a series of 12 coloured patterns and must then select the patterns they have seen in a two-choice, forced discrimination paradigm. Subjects complete two sets and the overall percentage correct is recorded.
CANTAB Pattern Recognition-modified (PRec-m)
Because of the risk of ceiling effects in healthy controls, a modified pattern recognition task was constructed that was similar to the CANTAB version except that the patterns were more abstract, black-and-white shapes and were more closely matched to their distracter during the recognition phase. These were taken from Vanderplas & Garvin (Reference Vanderplas and Garvin1959) and displayed using the Superlab program (Cedrus, USA). One set of 24 patterns was administered and the overall percentage correct recorded.
Self-Ordered Pointing Test (SOPT; McGonigle & Chalmers, Reference McGonigle and Chalmers2002)
The SOPT is a test of visual memory and strategic processing, using set sizes 4, 6, 8 and 10. The total correct is recorded.
Vigil Continuous Performance Test (CPT; Psychological Corporation, 1998)
This is a computerized CPT of sustained attention. Subjects view a continuous stream of letters and must respond when an ‘A–K’ sequence occurs. Errors of omission and commission and reaction time are recorded.
Rey-AVLT
This verbal learning and memory task was administered according to standardized instructions (Rey, Reference Rey1964; Lezak et al. Reference Lezak, Howieson and Loring2004). Multiple outcome measures can be derived from the test but those commonly reported are used here: total correct from the five recall trials of list A, delayed recall (total correct for list A7 and the percentage retained based on maximum recall from the immediate recall trials) and recognition from list A.
Forward and Backward Digit Span (fDSp bDSp)
This test of immediate verbal recall and working memory was again administered according to standardized instructions (Lezak et al. Reference Lezak, Howieson and Loring2004). The maximum span attained is recorded for both.
Verbal fluency (Controlled Oral Word Association Test, COWAT) and Excluded Letter Fluency Test (ELFT) (Bryan et al. Reference Bryan, Luszcz and Crawford1997; Lezak et al. Reference Lezak, Howieson and Loring2004)
In these tests of executive function, participants are required to produce as many words as possible beginning with, or not containing, a given letter. The total correct for each test is recorded.
Digit Symbol Substitution Test (DSST)
The DSST is a test of psychomotor speed and attention. The total correct in 90 s is recorded.
Speed and Capacity of Language Processing (SCOLP; Baddeley et al. Reference Baddeley, Emslie and Nimmo-Smith1992)
This is to test the speed and efficiency of cognitive processing. Total correct for ‘spot the word’ and speed of processing measures are recorded.
Statistical analysis
Data were analysed using SPSS version 19 (SPSS Inc., USA). The 26 outcome measures from the neurocognitive tests listed above were available for analysis. To address the aims outlined in the introduction: (i) overall group differences between patients and controls were first explored by MANCOVA, with individual outcomes examined with an independent-samples t test. Effect sizes were expressed as Cohen's d (Cohen, Reference Cohen1988). To examine inter-individual variation in performance, data from control participants were used to generate percentile ranks and the proportion of patients performing at or below the 5th, 10th and 16th (∼1 standard deviation; s.d.) percentile presented. (ii) A PCA was performed on the neuropsychological measures described above. The approach adopted follows closely the recommendations by Stevens (Reference Stevens2002) and Field (Reference Field2009). Because of the exploratory nature of this analysis procedure (particularly in terms of the selection of variables for inclusion and their retention in the resultant components), general methodology and data screening considerations are outlined in detail at the beginning of that section.
Results
Subject demographics and clinical detailsFootnote 1 Footnote †
Fifty-three bipolar patients (33 male, 20 female) participated in the study. Patients were aged between 22 and 63 years (mean = 47, s.d. = 10) and, using the National Adult Reading Test (NART; Nelson, Reference Nelson1982), had an estimated IQ of 109 (s.d. = 2). There were no current psychotic features in the group and no current diagnoses of substance abuse or dependence. The median age of onset in the group was 24 years (mean = 27, s.d. = 13). The median number of hospitalizations in the group was 1. Twenty-six patients (49%) had previously attempted suicide and 11 (22%) had previously been treated with electro-convulsive therapy (ECT; 12–18 months ago: n = 2; > 5 years ago: n = 9). All patients fulfilled SCID criteria for current depressive episode (none with psychotic features). The median length of current depressive episode in the group was 26 weeks (mean = 61.5, s.d. = 82.7). Depressive symptoms had a mean score of 28 (s.d. = 8) on the Montgomery–Åsberg Depression Rating Scale (MADRS; Montgomery & Åsberg, 1979) and of 20 (s.d. = 5) on the 17-item Hamilton Depression Rating Scale (HAMD-17; Hamilton, Reference Hamilton1960). All patients were receiving medication at the time of testing and had remained stable for a minimum of 4 weeks. Forty-two patients were taking a mood stabilizer (of whom n = 16 lithium). Thirty-nine patients were taking an antidepressant and 24 an antipsychotic.
The healthy control group (n = 47) consisted of 28 males and 19 females. Controls were aged between 18 and 64 years (mean = 45, s.d. = 14) and had a NART-estimated IQ of 112.5 (s.d. = 12). This group was matched to the patient group by sex (χ 2 = 0.76, df = 1, p = 0.783), age (t = 0.954, df = 98, p = 0.343) and NART score (t = 1.586, df = 93, p = 0.116).
Overall group differences
Some tests had a small number of missing or incomplete data points (maximum of five participants across the whole sample of n = 100); these were imputed using the mean of the respective group. Data for all neuropsychological test measures for patients and controls are presented in Table 1 along with effect sizes. Large effect sizes (d > 0.8) were found on 3/26 measures: speed of processing (SCOLP), verbal learning (Rey-AVLT total) and specific executive/working memory processes (ELFT). Medium-to-large (0.5 < d < 0.8) effects were found on 8/26 measures: tests of attention, delayed recall and other executive tasks (COWAT). Small-to-medium (0.2 < d < 0.5) effects were found on 12/26 measures, including the majority of visuospatial measures examined.
Table 1. Cognitive test performance of patients and controls
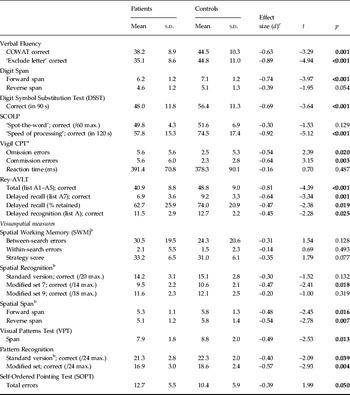
COWAT, Controlled Oral Word Association Test; SCOLP, Speed and Capacity of Language Processing; CPT, Continuous Performance Test; Rey-AVLT, Rey Auditory Verbal Learning Test; s.d., standard deviation.
a Data available on n = 75/100 participants.
b Tests from the Cambridge Neuropsychological Test Automated Battery (CANTAB).
c Effect size signs reversed on some measures so that negative values always indicate lower performance of patients relative to controls.
To control for the number of individual comparisons, the overall group effect was confirmed using a MANCOVA (with NART and age as covariates). Some individual outcome measures were omitted from this analysis to avoid inclusion of overlapping/commensurate outcomes: the Rey A7 percentage retained was omitted as it is highly correlated with ‘A7 correct’; similarly, the ‘modified trials’ of the SRec (sets 7 and 9) were omitted in favour of the ‘standard’ version. The SCOLP ‘spot-the-word’ test was omitted as it is conceptually similar to the NART (which was used as a covariate); finally, the PRec measure was omitted in favour of the ‘modified version’, which was less affected by ceiling effects (in the standard version, 28% of the n = 100 participants achieved the maximum possible score on the task whereas for the modified version only 2% scored the maximum) and Vigil was omitted as it was only completed on a subset of participants. The remaining 18 measures were entered into the analysis.
The MANCOVA revealed a highly significant main effect of group, with patients performing below the level of controls (F = 3.767, df = 18,79, p < 0.0001) and both NART and age being significant covariates (p < 0.0001).
An exploratory analysis was conducted to examine the relationship between HAMD-17 scores and cognitive measures in patients; however, there were no significant correlations with any variable (r < 0.25, p > 0.15 for all; individual data not shown).
Percentile standing of depressed patients
Data are presented in Table 2. For the tests reported, almost all produced at least one outcome measure on which about 25–50% of the patient sample performed at or below 1 s.d. of controls. Although these proportions diminished when considering performance at or below the 5th percentile, 20–34% of the patient sample exhibited performance decrements at this level in immediate/working memory (digit and spatial span), verbal learning and memory (Rey-AVLT), and psychomotor/processing speed (DSST and SCOLP).
Table 2. Percentile standing of depressed bipolar patients a

COWAT, Controlled Oral Word Association Test; SCOLP, Speed and Capacity of Language Processing; CPT, Continuous Performance Test; Rey-AVLT, Rey Auditory Verbal Learning Test; s.d., standard deviation.
a Data expressed as the percentage of the patient group performing at or below the cut-off. Percentile cut-off scores were calculated using the control data as reference.
Cognitive test component structure
For the purposes of the PCA, the 26 variables listed in Table 1 were considered for analysis. These variables were initially assessed on several criteria for inclusion, identical to those applied earlier in the MANCOVA. Nineteen variables were therefore available for the PCA (note that it was not necessary to exclude the SCOLP here, as it was in the covariate procedure above). Formal testing of the sample and data was also performed through the iterative process of extracting stable factor solutions using the Kaiser–Mayer–Olkin (KMO) measure of sampling adequacy and Bartlett's test of sphericity (Stevens, Reference Stevens2002). Factor rotation was completed by orthogonal (varimax) and oblique (direct oblimin) rotation methods, and the solutions compared (as recommended by several authors; Pedhauzur & Schmelkin, Reference Pedhauzur and Schmelkin1991; Stevens, Reference Stevens2002). As oblique rotations produce factors that will be correlated to some extent, it has been argued that this approach is more representative of the complex inter-relationships between processes of human cognition. However, because orthogonal rotations produce factors that are uncorrelated, the resulting components can be used as statistically independent factors for use in regression analyses to explore hierarchical organization of cognitive processes.
Overall sample
As recommended by Field (Reference Field2009), the overall correlation matrix was first examined for any extreme values (i.e. variables correlating very highly or very weakly with others). The SCOLP measures, SWM within-search errors and forward digit span were omitted. This resulted in the initial entry of 15 variables into the PCA. The initial model, following factor rotation, indicated that the PRec-m test did not load onto any component above the predefined criteria and also displayed low communality (0.307). Therefore, this variable was eliminated to produce the final PCA using the 14 variables remaining.
The factorability of the variables was confirmed: all variables correlated with at least five others at 0.77 > r > 0.30. The KMO measure of sampling adequacy was 0.833 (the cut-off for a ‘very good’ value is above 0.8) and Bartlett's test of sphericity was significant (p < 0.0001). The diagonals of the anti-image correlation matrix were all > 0.5 (the lowest value was 0.744), justifying the inclusion of each item in the analysis and the determinant of the initial correlation matrix was |R| = 0.001 (well above the recommended 0.00001), suggesting that multicolinearity is not an issue with the data. Finally, the communalities for the PCA ranged from 0.468 to 0.778 (mean = 0.690).
Four components were extracted after varimax factor rotation, with each independently explaining 40.3, 11.7, 9.6 and 7.4% of the variance (40.3, 52.0, 61.2 and 69.0% cumulatively). Following the recommended method of Stevens (Reference Stevens2002), the cut-off for interpretation of individual factor loadings should be equated to sample size, therefore a cut-off of 0.512 was used (see Table 3). The clustering of variables on these four components suggests that two components represent differing aspects of visuospatial processing: component 1, a ‘short-term/immediate’ measure, and component 3, a ‘self-ordered/strategic’ visuospatial processing measure. In the remaining two components, component 2 seems to represent ‘verbal learning and memory’ and component 4 ‘(verbal) executive function and working memory’.
Table 3. PCA rotated component matrices for all participants (n = 100)

PCA, Principal component analysis; SWM, Spatial Working Memory; VPT, Visual Patterns Test; SRec, Spatial Recognition; SOPT, Self-Ordered Pointing Test; DSST, Digit Symbol Substitution Test; Rey, Rey Auditory Verbal Learning Test; COWAT, Controlled Oral Word Association Test; ELFT, Excluded Letter Fluency Test.
Bold type indicates measures meeting criteria for component loading.
a Although variable loadings on each component are negative, these variables report error scores and therefore should be reversed for interpretation of true component loading.
Comparing this model to the oblique rotation, it is clear that three of the components are identical to the orthogonal solution. The pattern matrix shows that the cluster of factor loadings in components 1, 2 and 3 are identical to components 1, 2 and 4 respectively of the varimax solution. The fourth component in the structure matrix also shows identical loadings to the varimax solution, although, as can be seen from the pattern matrix, these load less cleanly because of moderate loadings with other factors. Loadings in the pattern matrix further show that SRec and SOPT do not load uniquely onto any of the four components for the same reason.
Comparison of bipolar patients and controls
A final exploratory analysis contrasts the profile of variable loadings for patients and controls separately. Because of the relative consistency between the models in the overall analysis, only orthogonal (varimax) rotations are reported. To fully permit differences to emerge from the overall analysis, this was performed from the point of initial data screening of all the original variables (i.e. reassessing the correlation matrices, for each sample separately). This resulted in 13 variables entering the initial model for controls and 12 for patients (see Table 4). The models were assessed using the same criteria as the overall PCA for data assumptions. For controls, the KMO measure was 0.738 and the communalities ranged from 0.610 to 0.870 (mean = 0.733); for patients, the KMO measure was 0.773 and the communalities ranged from 0.442 to 0.811 (mean = 0.645).
Table 4. PCA varimax rotated component matrices for controls and bipolar patients separately (initial model)

PCA, Principal component analysis; SWM, Spatial Working Memory; VPT, Visual Patterns Test; SRec, Spatial Recognition; SOPT, Self-Ordered Pointing Test; DSST, Digit Symbol Substitution Test; Rey, Rey Auditory Verbal Learning Test; COWAT, Controlled Oral Word Association Test; ELFT, Excluded Letter Fluency Test.
The criteria for significance of the loadings were calculated and based on the individual sample sizes (for controls > 0.575, for patients > 0.541).
Bold type indicates measures meeting criteria for component loading.
For controls, four components were extracted explaining 35.6, 15.1, 13.1 and 9.5% (cumulatively, 35.6, 50.7, 63.8, and 73.3%) of the variance. Components 2 and 4 are identical to those seen in the overall group analysis, and represent ‘verbal learning and memory’ and ‘(verbal) executive function/working memory’ respectively. The remaining two components separated visuospatial processes into a complex/strategic component (component 1) and a short-term/temporary component that included psychomotor processing (component 3). For patients, three components were extracted, explaining 39.0%, 16.0% and 9.5% of the variance (cumulatively, 39.0, 55.0 and 64.5%). In contrast to controls, there was a much broader loading onto the first component, which covered executive control (and also strategic aspects) and visuospatial memory. In component 2 the verbal learning and memory measures were included along with SOPT, possibly suggesting that this test was being completed in a different way compared to controls (i.e. relying on verbal rather than visual processing). The final component 3 includes SRec and a verbal working-memory measure.
Refined rotation
It is of note that some variables entered into the PCA exhibited loadings that were close to the cut-off for interpretation over multiple components; for example, the VPT and digit span reverse in controls and SOPT in patients. One final rotation is presented in Table 5 with these removed (these solutions also displayed complete overlap with the oblique rotation, suggesting a stable orthogonal profile; data not shown).
Table 5. PCA varimax rotated component matrices for controls and bipolar patients separately (‘refined’ model)

PCA, Principal component analysis; SWM, Spatial Working Memory; VPT, Visual Patterns Test; SRec, Spatial Recognition; SOPT, Self-Ordered Pointing Test; DSST, Digit Symbol Substitution Test; Rey, Rey Auditory Verbal Learning Test; COWAT, Controlled Oral Word Association Test; ELFT, Excluded Letter Fluency Test.
The criteria for significance of the loadings were calculated and based on the individual sample sizes (for controls > 0.575, for patients > 0.541).
Bold type indicates measures meeting criteria for component loading.
For controls, the communalities for the PCA were high, ranging from 0.605 to 0.882 (mean = 0.764), and for patients, from 0.436 to 0.810 (mean = 0.657). As previously, for controls four components were extracted explaining 37.8, 15.6, 12.2 and 10.7% (37.8, 53.5, 65.7 and 76.4% cumulatively), whereas for patients three components were extracted, explaining 38.2, 17.3 and 10.1% of the variance (cumulatively, 38.2, 55.5, 65.7 and 73.8%). In controls, this four-component solution retains the ‘verbal memory and learning’ factor in component 1, and component 2 seems to be a strategic, visuospatial self-ordered search component, whereas component 3 includes the immediate spatial span measures with psychomotor speed. In component 4 the digit span was not included in the model, leaving a verbal fluency/executive component. In patients, the verbal memory (component 2) is identical to that seen in controls in terms of variable loading, whereas the visuospatial measures do not separate, having a much broader loading onto the first factor. It is also of note that all the components include a mixture of verbal and visual/spatial measures that do not separate precisely, as they do in controls.
Discussion
The present study comprehensively characterized neurocognitive dysfunction in adults with a diagnosis of bipolar depression, compared with a well-matched control group. In line with previous work, the data were compared on their statistical significance. However, the additional use of effect sizes, percentile standing and PCA (to examine the component structure of cognitive processes) permitted a more in-depth analysis. Multivariate analysis revealed an overall group effect, with depressed BD patients performing significantly worse than controls. Comparison of individual cognitive test variables indicated that the patient group performed significantly worse than controls on 18/26 measures examined, with large effect sizes on tests of speed of processing, verbal learning and specific executive/working memory processes (3/26 measures). Medium-to-large effects were found on 8/26 measures, including tests of attention, delayed recall and other executive tasks (COWAT). Small-to-medium effects were observed on 12/26 measures, including the majority of visuospatial measures examined. The use of control data to derive cut-off scores and establish the percentile standing of individuals in the bipolar depressed group highlighted the inter-individual variability in performance across measures. Almost all tests produced at least one outcome measure on which around 25–50% of the patient sample performed at least 1 s.d. below the control mean. Between 20% and 34% of the patient sample performed at or below the 5th percentile of the control group in tests of immediate/working memory (digit and spatial span), verbal learning and memory (Rey-AVLT) and psychomotor/processing speed (DSST and SCOLP). Lastly, an exploratory PCA highlighted differences between patients and controls in the profile and content of the underlying component loadings of the data. Overall, there were fewer extracted components in patients, suggesting more homogeneity, particularly of visuospatial processes. However, the individual variables that loaded into these components were less specific in terms of modality, with every one containing combinations of both verbal and visuospatial measures.
Effect size differences in the present study are modest compared to those seen in a previous meta-analysis by Kurtz & Gerraty (Reference Kurtz and Gerraty2009), although there are only two tests on which a direct comparison can be made (i.e. in BD depression) and these were derived from multiple small samples (n = 81/96, from 4/5 studies). The present study therefore represents a large, comprehensive dataset in this research area. Some comparisons with the findings in euthymic BD patients should also be noted. Similar to the present study, the recent large-scale analysis by Bourne et al. (Reference Bourne, Aydemir, Balanzá-Martínez, Bora, Brissos, Cavanagh, Clark, Cubukcuoglu, Dias, Dittmann, Ferrier, Fleck, Frangou, Gallagher, Jones, Kieseppä, Martínez-Aran, Melle, Moore, Mur, Pfennig, Raust, Senturk, Simonsen, Smith, Soares, Soeiro-de-Souza, Stoddart, Sundet, Szöke, Thompson, Torrent, Zalla, Craddock, Andreassen, Leboyer, Vieta, Bauer, Worhunsky, Tzagarakis, Rogers, Geddes and Goodwin2013) found that the majority of measures assessed lay in the small-to-medium effect size range. Two of the three measures on which large effects were observed in the present study (SCOLP speed of processing and ELFT fluency) have not been assessed in previous studies; however, the third (verbal learning) was greater here than in the euthymic analysis (d = 0.81 v. 0.51). It has been suggested previously that depressive symptoms may have a particular impact on verbal memory processes (Porter et al. Reference Porter, Gallagher, Thompson and Young2003; Gallagher et al. Reference Gallagher, Robinson, Gray, Porter and Young2007; Gorwood et al. Reference Gorwood, Corruble, Falissard and Goodwin2008; Kurtz & Gerraty, Reference Kurtz and Gerraty2009). Although speculative, it may be that the profiles of euthymic and depressed BD broadly overlap, but with greater dysfunction in some episodic processes when symptomatic. The effects on the processing speed and complex executive measure remain to be established.
In terms of the assessment of percentile standing, our data are in accordance with previous findings (Iverson et al. Reference Iverson, Brooks, Langenecker and Young2011), suggesting that, although ‘broad’ significant statistical differences are observed, overall effect size differences vary according to the domain examined and those patients with performance at or below the cut-off for impairment (on an individual measure) represent a subgroupFootnote 2 . One further caveat to note when interpreting these findings is that, even in healthy adults; some individuals will perform at or below such cut-offs. ‘Abnormal’ performance on some cognitive tests in a battery can sometimes be ‘psychometrically normal’ and does not necessarily signify impairment indicative of the presence of underlying brain dysfunction (Binder et al. Reference Binder, Iverson and Brooks2009). Nevertheless, given the overall proportions of patients performing below these cut-offs on some measures in the present study, this factor cannot fully explain the extent of impairment. Factors such as intrinsic and extrinsic motivation have also been shown to influence cognitive test performance, even in healthy subjects (Robinson et al. Reference Robinson, Stevens, Threapleton, Vainiute, McAllister-Williams and Gallagher2012). It is necessary to be cognizant of these effects when assessing the profile and magnitude of low cognitive test scores. This highlights the need to view the scores (or performance) in the context of any clinical condition, particularly where motivation to testing may be a factor. It is also important for future studies to identify whether there are specific clinical or illness characteristics defining those patients performing at the lowest percentile.
Medication use is also a limitation of the present study, as is typical of the majority of studies in bipolar depression. Although the effects of medication on performance cannot be discounted, it is important to note that cognitive deficits have been described in some studies of medication-free patients with major depression (Porter et al. Reference Porter, Gallagher, Thompson and Young2003) and euthymic BD (Goswami et al. Reference Goswami, Sharma, Varma, Gulrajani, Ferrier, Young, Gallagher, Thompson and Moore2009; Bourne et al. Reference Bourne, Aydemir, Balanzá-Martínez, Bora, Brissos, Cavanagh, Clark, Cubukcuoglu, Dias, Dittmann, Ferrier, Fleck, Frangou, Gallagher, Jones, Kieseppä, Martínez-Aran, Melle, Moore, Mur, Pfennig, Raust, Senturk, Simonsen, Smith, Soares, Soeiro-de-Souza, Stoddart, Sundet, Szöke, Thompson, Torrent, Zalla, Craddock, Andreassen, Leboyer, Vieta, Bauer, Worhunsky, Tzagarakis, Rogers, Geddes and Goodwin2013).
Very few studies in BD have used factor analysis (FA) or PCA in the assessment of cognitive processes, although there are some important implications of these methods. For example, to reduce the number of contrasts with large test batteries, tests are often reduced to composites (or multivariate analysis conducted) by generic cognitive domain. These may not be representative if the underlying factors/components differ in patients compared to controls. They are also of use in identifying tests or processes that load onto multiple underlying components and therefore reduced performance on such measures may be through any of several potential ‘mechanisms’. A study by Czobor et al. (Reference Czobor, Jaeger, Berns, Gonzalez and Loftus2007) examined the factor structure of cognitive performance in patients with BD and patients with schizophrenia and reported six common factors in both samples: attention, working memory, ideational fluency, verbal knowledge, non-verbal functions and learning. However, within these factors there were some significant differences in the profiles of impairment between the diagnostic groups (patients with schizophrenia performing worse in the attention and non-verbal domains). Using a predominantly confirmatory FA approach to identifying intermediate cognitive phenotypes, Langenecker et al. (Reference Langenecker, Saunders, Kade, Ransom and McInnis2010) reported that the depressed bipolar subgroup performed significantly worse than controls on seven of eight factors assessed (auditory memory, visual memory, processing speed with interference resolution, verbal fluency and processing speed, conceptual reasoning and set-shifting, emotional processing, and fine motor dexterity). It is important to note the distinction between the PCA and FA techniques. FA derives a mathematical model from which factors are estimated whereas PCA decomposes the available data into sets of linear variables. As such, it has been argued that only FA can truly estimate the underlying factors, with PCA simply examining the strength of the relationship between a given variable within each linear component, although these approaches lead to similar results when communalities are high (Field, Reference Field2000). As can be seen in the present analysis, some variables were excluded at the initial data screening stage and further removed from the model because of insufficient or multiple component loadings. This may have been a consequence of the small sample size. To fully derive stable underlying factors will require replication in a much larger sample. However, it should be noted that data were assessed throughout the PCA procedure to ensure that statistical assumptions were met and the data were viable for meaningful analysis.
The application of this analysis approach offers opportunities to develop our understanding of cognitive functioning in mood disorders. Of particular interest is the notion that the underlying factor structure may differ subtly in bipolar depression compared to healthy controls. Theoretical accounts gleaned from the literature on cognitive ageing may offer insights into these findings – of fewer components and more variability within each. For example, the dedifferentiation account proposes that there is a loss of specificity in cognition in ageing, whereby previously functionally discrete processes become less differentiated through decline in neural connectivity, becoming more amorphous (for a discussion see Dolcos et al. Reference Dolcos, Rice and Cabeza2002). A further parallel is the notion of ‘cognitive scaffolding’, whereby adaptive changes can occur in the underlying neural circuitry engaged in the performance of cognitive tasks, in response to structural or functional decline, resulting in the recruitment of alternative circuits or processes than those typically used. This has been described as a model to explain changes and variability (because it may not occur to the same extent in all individuals) in cognitive processes in ageing (Park & Reuter-Lorenz, Reference Park and Reuter-Lorenz2009). Together these accounts could explain increased inter- and intra-individual variability in cognitive performance, often found in mood disorders more generally. Future research should focus on establishing the relationship between cognitive components and the cognitive hierarchy underpinning the profiles; that is, can broader dysfunction be explained by more circumscribed core deficits? Establishing the reasons behind the differences in the cognitive profile of bipolar disorder should also be a focus, especially by identifying potential cognitive phenotypes and underlying functional and structural brain connectivity.
Acknowledgements
This work was supported by grant funding from the Stanley Medical Research Institute (SMRI) and the Medical Research Council (MRC).
Declaration of Interest
None.


