


NOMENCLATURE
- σ r,Sur
surface residual stress (MPa)
- σ C,ax
maximum compressive residual stress (MPa)
- h r0
depth to the machined surface of σ C,ax (μm)
- h ry
response depth of residual stress (μm)
- P ε
strain energy density (J/m2)
- P d
distortional strain energy density (J/m2)
- P v
dilatational strain energy density (J/m2)
- σ1, σ2 and σ3
three principal stresses in three-dimensional space (MPa)
- ε1, ε2 and ε3
strains in the directions of three principal stresses
- E
Young’s modulus of titanium alloy Ti–6Al–4V (GPa)
- μ
Poisson ratio of titanium alloy Ti–6Al–4V
- C o
amplitude constant (MPa)
- φ
phase angle (In degree)
- ς
damping coefficient
- w d
damped frequencies (μm−1)
- v f
feed speed (m/s)
- a e
width of cut (mm)
- Z
number of teeth
- v c
cutting speed (m/min)
- f z
feed per tooth (mm)
- σ s
yield limit of titanium alloy Ti–6Al–4V (MPa)
- σ a
stress amplitude (MPa)
- R 0
stress ratio
1.0 INTRODUCTION
Titanium alloy Ti–6Al–4V is widely used in the aviation, aerospace, enginery and other manufacturing industries for its excellent combination of properties, such as high strength to weight ratio, good fracture toughness and strong resistance to corrosion( Reference Xiong and Wu 1 ). In these applications, the components are always subjected to cyclical mechanical and thermal loads, and thus, it puts forward higher requirement of reliability of parts, which is directly related to surface integrity of the product achieved by final machining.
For the past several decades, many researches have been carried out on machining-induced surface integrity and its effect on fatigue performance. In most of these studies, fatigue life is generally regarded as the function of surface integrity indictors, such as surface topography and residual stress and micro-hardness. Zhang et al. found that the logarithm of surface roughness or surface micro-crack presents the relationship of a quadratic curve with fatigue life, and fatigue life decreases with an increase of surface roughness( Reference Zhang, Liu, Liu and Yue 2 ). Javidi et al. found that an increase of compressive residual stress causes an increase of fatigue life through the study of the effect of surface integrity on fatigue life of 34CrNiMo6( Reference Javidi, Rieger and Eichlseder 3 ). Meanwhile, the effect of residual stress on fatigue life is found to have more pronounced than the effect of surface roughness. Due to the presence of highly compressive surface residual stresses caused by the turning operation, explained by Sharman et al. that the turned specimens to have a higher fatigue strength than electro-chemical machined and electro-discharge textured specimens made from Ti–45Al–2Nb–2Mn+0.8 vol% TiB2 alloy( Reference Sharman, Aspinwall, Dewes, Clifton and Bowen 4 ). Liu et al. concluded that the softened layer below the work-hardened surface and the compressive residual stress field were regarded as the two main reasons to prolong the fatigue life of the machined surface, which was drawn on the basis of face milling and three points bending fatigue life tests of 17-4PH stainless steel( Reference Liu, Huang, Zou and Liu 5 ). Li et al. found that the fatigue limit of Ti–6Al–4V can be improved with the increase of surface compressive stress under a given stress ratio, while this effect drops with an increase of stress ratio. The region where crack initiates is also affected by the distribution status of residual compressive stress on the material surface( Reference Li, Xuan, Wang and Tu 6 ).
According to the conclusions of previous studies, the fatigue performance of the machined workpiece is determined by the interactions of the above-mentioned surface integrity indictors, but one generally accepted way to improve fatigue resistance is to induce a compressive residual stress in the surface layers of the material, making the nucleation and propagation of fatigue cracks more difficult. However, the influence of machining-induced residual stress distribution on fatigue performance is still confusing. Smith et al. found that the fatigue life is directly proportional to both the surface compressive residual stress and the maximum compressive residual stress in their study on the relationship between surface integrity and fatigue life of hard turned AISI 52100 steel( Reference Smith, Melkote, Lara-Curzio, Watkins, Allard and Riester 7 ). Farrahi et al. worked with the AFNOR 60SC7 spring steel and showed that fatigue life improvement is owing to the maximum residual stress and also the depth of the response depth of residual stress. A correlation was found between the fatigue life and the area-under-the-residual stress curve( Reference Farrahi, Lebrijn and Couratin 8 ). Guo et al. found that the slope of the compressive residual stress profile was an important factor in rolling contact fatigue damage, and they also demonstrated that the relative fatigue damage can be characterised by multi-axial fatigue damage parameters under the influence of machining-induced residual stress profiles( Reference Guo and Yen 9 , Reference Guo and Barkey 10 )
In aspect of cutting parameters on machining-induced residual stress, Sun claims for milling Ti–6Al–4V that an increase in feed rate makes the residual stresses more tensile at the surface, and with increasing cutting speed, surface residual stresses becomes more compressive( Reference Sun and Guo 11 ). Sridhar confirmed that the form of surface stress got more compressive with the increase of cutting speed when milling IMI-834( Reference Sridhar, Devananda, Ramachandra and Bhat 12 ). However, Guerville claimed the opposite to Sridhar’s conclusion, and that is more tensile residual stresses are generated with increasing cutting speed( Reference Guerville, Vigneau, Dudzinski, Molinari and Schulz 13 ). Mantle also found that compressive stresses decreased when the cutting speed was increased in milling gamma-titanium aluminide( Reference Mantle and Aspinwall 14 ). Thus, it is difficult to achieve a unified conclusion on the influence of cutting parameters on the machining-induced residual stresses. Furthermore, residual stress distribution characteristics in peripheral milling of titanium alloy Ti–6Al–4V have received little coverage in the previous literatures.
Following the analysis given above, there are two problems needing to be solved. On the one hand, sensitivity of cutting parameters of peripheral milling-induced residual stress profile and its overall state are not well identified. On the other hand, the correlation between the machining-induced residual stress and fatigue performance needs to be revealed. In the present study, residual stress profile induced by peripheral milling of Ti–6Al–4V is first studied. And then an energy criterion for machining-induced residual stress field, named surface energy, is proposed to characterise the whole stated of the residual stress field. Finally, the effects of residual stress profile and surface energy induced by peripheral milling on tensile–tensile fatigue performance of titanium alloy Ti–6Al–4V are discussed.
2.0 CHARACTERISATION OF MACHINING-INDUCED RESIDUAL STRESS
In this section, profile and the overall state of machining-induced residual stress are characterised.
2.1 Residual stress profile induced by machining
Under the action of cutting load, the newly formed surface undergoes forced compression to cause plastic deformation, and as the force is removed the material undergoes partial, but not a full recovery, due to the permanent deformation that has occurred. The material further from the machined surface which is only elastically deformed, springs back from the compression state and forces the plastically deformed material closer to the machined surface into tensile (or small compressive). Therefore, as shown in Fig. 1, four key factors of the residual stress profile can be identified as surface residual stress (σ r,Sur ), maximum compressive residual stress (σ C,ax ) and location (h r0), response depth (h ry )( Reference Yang, Liu, Ren and Zhuang 15 ).
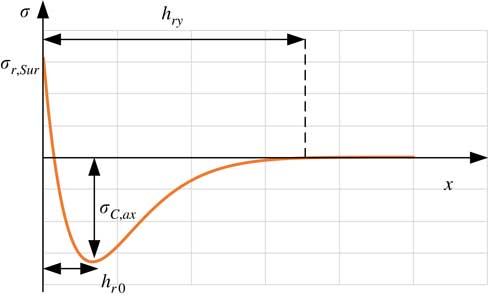
Figure 1 (Colour online) Residual stress profile induced by machining.
2.2 Energy criteria for residual stress field
Machining-induced residual stress field is actually the energy field that stores strain energy input by cutting system and dissipated by various forms, such as plastic deformation and fracture.
The residual stress field after cutting is in the state of self-balance, therefore, the plastic deformation history during the machining process is not been considered in the present study. In addition, the assumption is also made that the studied material is an isotropic material. On the basis of the elastic-plasticity theory, the strain energy density P ε of one certain point in the residual stress field can be expressed as follows:
 $$P_{{\rvarepsilon}} {\equals}{1 \over 2}{\rm \rsigma }_{1} {\rm {\rvarepsilon}}_{1} {\plus}{1 \over 2}{\rm \rsigma }_{2} {\rm {\rvarepsilon}}_{2} {\plus}{1 \over 2}{\rm \rsigma }_{3} {\rm {\rvarepsilon}}_{3} $$
where σ1, σ2 and σ3 are the three principal stresses in three-dimensional space; ε1, ε2 and ε3 are the strains in the directions of three principal stresses, respectively.
The strain energy density P ε is the sum of distortional strain energy density P d and dilatational strain energy density P v , where P v can be expressed as follows:
 $$P_{v} {\equals}{3 \over 2}{\rm \rsigma }_{m} {\rm {\rvarepsilon}}_{m} {\equals}{{1{\minus}2{\rm \rmu }} \over {6E}}({\rm \rsigma }_{1} {\plus}{\rm \rsigma }_{2} {\plus}{\rm \rsigma }_{3} )^{2} $$
where σ m , ε m are the mean values of principal stresses and principal strains. E and μ are the Young’s modulus and the Poisson ratio of the material, respectively.
As a consequence, the distortional strain energy density v d can be expressed as follows:
 $$P_{d} {\equals}P_{{\rm {\rvarepsilon}}} {\minus}P_{v} {\equals}{{1{\plus}{\rm \rmu }} \over {6E}}\left[ {({\rm \rsigma }_{1} {\minus}{\rm \rsigma }_{2} )^{2} {\plus}({\rm \rsigma }_{2} {\minus}{\rm \rsigma }_{3} )^{2} {\plus}({\rm \rsigma }_{1} {\minus}{\rm \rsigma }_{3} )^{2} } \right]$$
Considering that the machining-induced residual stress is usually distributed only in the shallow part of the workpiece, the normal stress σ2 in the direction perpendicular to the machined surface is approximately zero. Meanwhile, it is assumed that the volume does not change during the plastic deformation process, and the value of μ is 0.5. Therefore, the equation of strain energy density is updated as follows:
 $$P_{{\rm {\rvarepsilon}}} {\equals}P_{d} {\equals}{1 \over {2E}}({\rm \rsigma }_{1}^{2} {\plus}{\rm \rsigma }_{3}^{2} {\minus}{\rm \rsigma }_{1} {\rm \rsigma }_{3} )$$
The machining-induced residual stress is a function of the depth from the machined surface, and it is the same for the strain energy density. For the purpose of describing the strain energy density by a general function, an exponential cosine attenuation function, which is described as Equation (5), is proposed. It is proved in the author’s previous work that the exponential cosine attenuation function has a high precision to represent the hook distribution feature of the machining-induced residual stress profile( Reference Yang, Liu, Ren and Zhuang 15 ):
 $${\rm \rsigma (}x{\rm )}{\equals}C_{0} {\rm e}^{{{\minus}{{{\rm \rzeta }w_{d} x} \over {\sqrt {1{\minus}{\rm \rzeta }^{2} } }}}} {\rm cos}(w_{d} x{\plus}{\rm \rvarphi })$$
where σ(x) is the value of residual stress at a given depth x to the machined surface. C 0 is the amplitude constant, φ is the phase angle and these two parameters determine the value of residual stress at any position below the machined surface. ς is the damping coefficient, which indicates the attenuation of the residual stress profile. w d is the damped frequencies, which is related to the periods of the residual stress profile.
Combined Equations (4) and (5), the strain energy density P ε is updated as follows:
 $$P_{{\rm {\rvarepsilon}}} {\equals}{1 \over {2E}}[{\rm \rsigma }_{1}^{2} (x){\plus}{\rm \rsigma }_{3}^{2} (x){\minus}{\rm \rsigma }_{1} (x){\rm \rsigma }_{3} (x)]$$
Therefore, the strain energy stored in unit time during the machining process can be drawn as follows:
 $$P_{{\rm cut}} {\equals}{{v_{f} a_{e} } \over {2E}}\mathop \int \nolimits_0^{h_{{ry}} } \left[ {{\rm \rsigma }_{1}^{2} (x){\plus}{\rm \rsigma }_{3}^{2} (x){\minus}{\rm \rsigma }_{1} (x){\rm \rsigma }_{3} (x)} \right]{\rm d}x$$
where v f , a e are the feed speed and width of cut, respectively. And the feed speed v f can be calculated by the following equation:
 $$v_{f} {\equals}{{v_{c} f_{z} Z} \over {60{\rm \rpi }d}} {\rm (m/s})$$
where Z is the number of teeth in milling cutter.
On the basis of the assumption that the distribution of residual stresses is uniform beneath the machined surface, the strain energy stored into the workpiece material in unit time during the machining process can be used to characterise the overall state of machining-induced residual stress.
3.0 MATERIAL AND EXPERIMENTS
3.1 Material and cutting experiments
The material studied was two phase titanium alloy Ti–6Al–4V. As shown in Fig. 2, two kinds of phases named α and β are included, where the α phase is shown in black while the β phase is white. The chemical compositions of Ti–6Al–4V are as follows (wt%): 4.83–6.8% Al, 3.5–4.5% V,<0.25% Fe,<0.05% N ,<0.2 O and balance Ti.
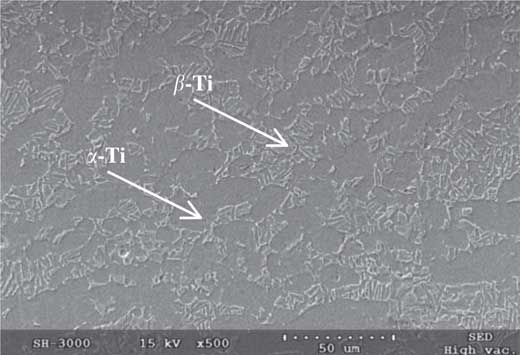
Figure 2 Microstructure of Ti–6Al–4V alloy.
Figure 3 shows a schematic diagram of the sample used. Different processing techniques were applied for surface A and surface B to exclude the effect on fatigue performance, surface A is processed by end milling, grinding and polishing with the same machining parameters for all the specimen. While for surface B, the investigated surface, peripheral milling (as shown in Fig. 4) was conducted under different cutting parameters. A three factor and four level orthogonal experiment was designed to get different residual stress fields of surface B, and the cutting speed v c , feed per tooth f z and radial depth of cut a e are given in Table 1. The machining experiments were carried out on a vertical type machining center (DAEWOOACE-V500). The diameter of the cutter was 6 mm with 4-flute tool with variable helix angles (38° and 41°), which is made from cemented carbide. The experiments were performed with dry machining and the milling mode was down milling.
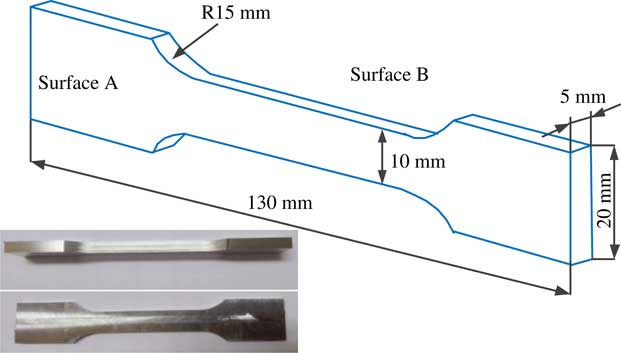
Figure 3 (Colour online) Fatigue specimen.

Figure 4 (Colour online) Set-up of the peripheral milling test.
Table 1 Cutting process parameters

3.2 Residual stress measured
A Proto-LXRD diffractometer with Cu Kα radiation tube was used to measure the residual stresses of Ti–6Al–4V induced by peripheral milling. The collimator diameter is 1mm. Tube voltage and current are 30 kV and 25 mA, respectively. The (213) crystallographic planes of α phase of titanium alloy Ti–6Al–4V were measured, and the peak position 2θ is 139.47°. Nickel filters were applied to reduce the intensity of copper K-β radiation. Two position sensitive scintillation detectors were used to cover all ranges of ψ angles. Residual stresses of all test positions were measured in two directions: parallel (σ1) and perpendicular (σ3) to the cutting direction in the machined surface, and all these parameters were taken at three locations and repeated twice at each location.
In addition, the electro-chemically polished method was applied to get the residual stress profile in machined surface layer, and the test positions are 2 μm, 4 μm, 6 μm, 8 μm, 10 μm, 20 μm, 40 μm, 60 μm and 80 μm beneath the machined surface. Parameters of the electro-chemically polished method are listed in Table 2.
Table 2 Parameters of the electro-chemically polished method( Reference Vosough, Kalhori, Liu and Svenningsson 16 )

3.3 Fatigue tests
As shown in Fig. 5, the tensile–tensile fatigue experiments were carried out on the Instron 8801 electro-hydraulic-servo fatigue testing machine at room temperature. Stress control was adopted in the form of a sine wave with a frequency of 20Hz. Two kinds of loading conditions were applied. In case 1, maximum fatigue alternating stress σmax is 1,000 MPa, which is larger than the yield limit σ s (894–903 MPa) of the studied material. Stress amplitude σ a and stress ratio R 0 are 450 MPa and 0.1. And in case 2, the maximum fatigue alternating stress σmax is 800 MPa, which is smaller than the yield limit σ s of the studied material. Stress amplitude σ a and stress ratio R 0 are 360 MPa and 0.1, respectively. In the present study, the fatigue experiments under the same cutting conditions are repeated three times, and the average value is used to characterise the fatigue performances of the specimens.
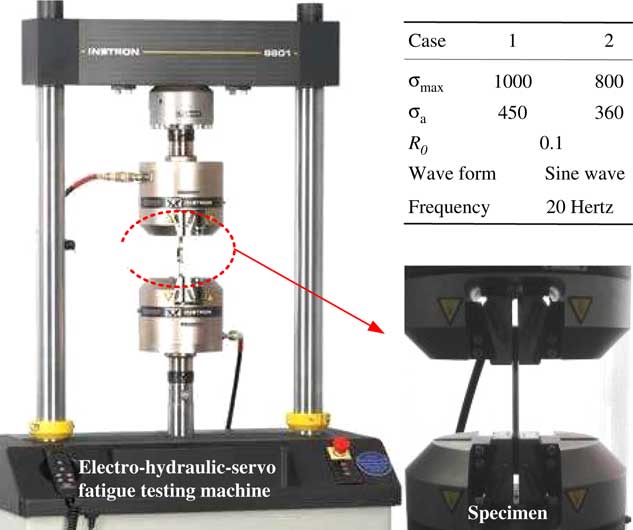
Figure 5 (Colour online) Fatigue experiments equipment and experimental conditions.
4.0 RESULTS AND DISCUSSION
In this section, peripheral milling-induced residual stress profile and its energy index were first characterised, and the sensitivity of them to the cutting parameters was analysed. Second, the influences of residual stress profile and surface energy on fatigue life were discussed.
4.1 Machining-induced residual stress profile
As shown in Fig. 6, the residual stress profile of titanium alloy Ti–6Al–4V induced by peripheral milling follows a similar pattern, a compressive (or small tensile) peak at the machined surface, followed by a compressive peak, settling at a distance without positive again, or very small positive values. It also can be found that the value of the maximum compressive stress can reach 600 MPa in the place of approximately 2–10 μm beneath the machined surface, and the response depth of residual stress is less than 100 μm.
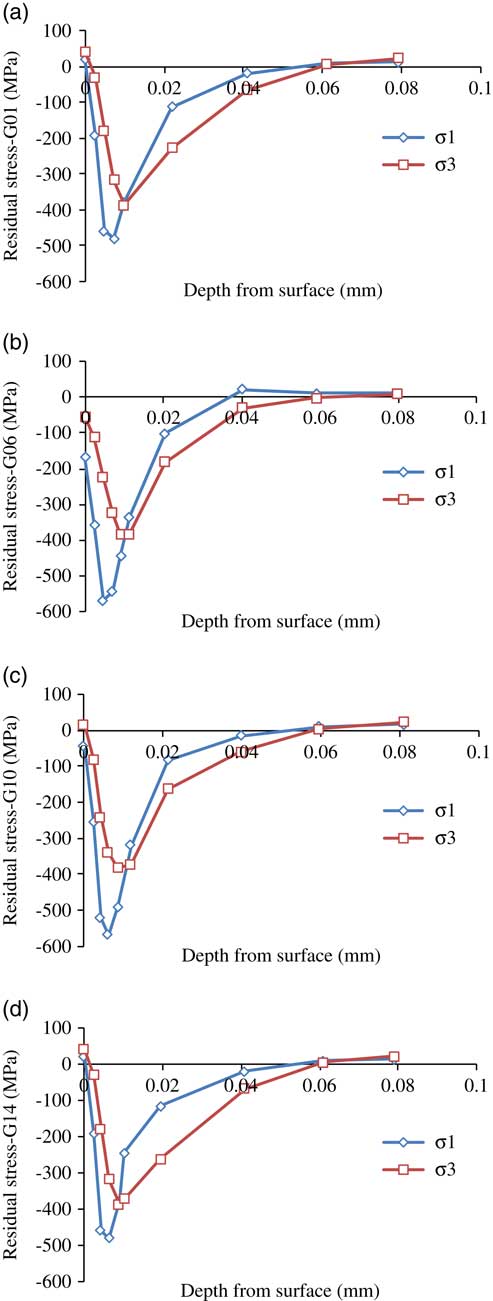
Figure 6 (Colour online) In-depth distribution of machining-induced residual stress.
On the basis of the measured residual stress profile, four key factors σ r,Sur , σ C,ax , h r0 and h ry were identified, and their sensitivity to cutting parameters were drawn as follows.
Values of the four key factors σ r,Sur , σ C,ax , h r0 and h ry of the measured residual stress profile, and their relationship with cutting parameters are summarised in Fig. 7. It can be seen that the four factors of σ1 and σ3 show a similar variation trend, both values of σ r,Sur and σ C,ax of σ1 are larger than those of σ3, while h r0 and h ry of σ1 are smaller than those of σ3. Compared to v c and f z , a e has little effect on the four key factors of residual stress profile. In addition, the changes of h r0 and h ry with the cutting parameters are not obvious, and this is mainly due to two reasons, first, thermo-mechanical coupling effect induced by peripheral milling under the presented cutting conditions has a small change. Second, values of h r0 and h ry are small, and limited spacing test points are selected considering the accuracy of XRD method. In aspects of σ r,Sur and σ C,ax , both σ r,Sur values of σ1 and σ3 decreased with the increase of cutting speed. While increase trends are found for σ C,ax by increasing the cutting speed, and it is more significant for σ3. When f z was changed from 0.02 mm to 0.05 mm, the values of σ r,Sur and σ C,ax of σ1 decreased significantly, and the variations of σ r,Sur and σ C,ax of σ1 against f z were pretty minute.
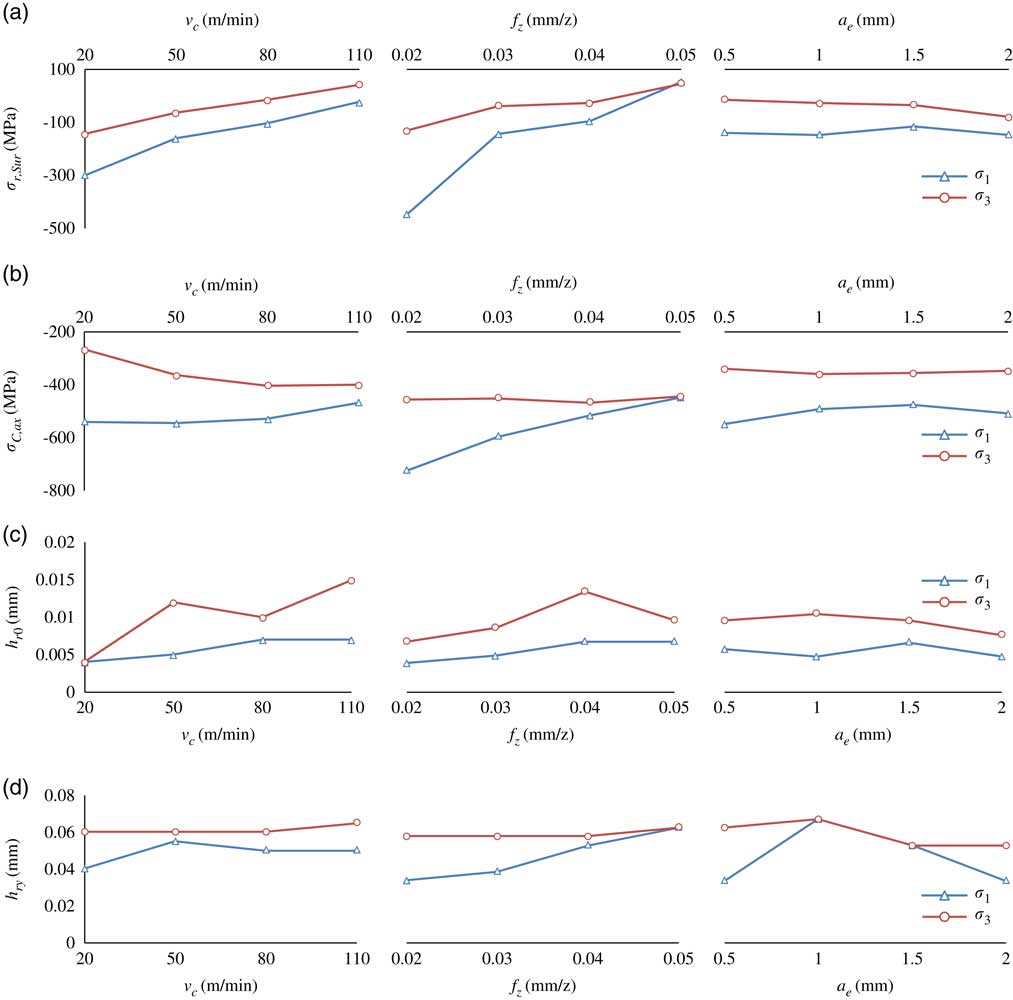
Figure 7 (Colour online) Relationship of (a) σ r,Sur , (b) σ C,ax , (c) h r0 and (d) h ry with cutting parameters.
4.2 Machining-induced surface energy
To get the machining-induced surface energy parameter P cut, four coefficients in Equation (5) were optimised subsequently. A multi-objective optimisation method is needed to fulfill the work, and particle swarm optimisation (PSO) method is applied in the present study. PSO is an evolutionary method similar to genetic algorithms, which is widely used for machining process optimisation( Reference Ulutan 17 ). In PSO algorithm, the population has n p particles that represent candidate solutions. Each particle is a m p dimensional real valued vector where m p is the number of optimised parameters, and each optimised parameter represents a dimension of the problem space. The flow chart of PSO method is shown in Fig. 8
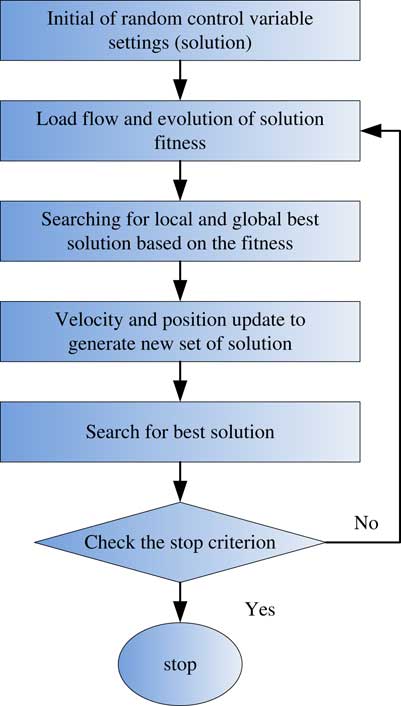
Figure 8 (Colour online) The flow chart of PSO method.
.
The surface stress is represented with both phase angle and amplitude, so there is no need to have restrictions on the values of φ and C 0 in Equation (5). In the present study, the amplitude is ranged from 0 to 1,000 MPa, and phase angle is set in the range of [−π, +π]. The damped frequency is proportional to the inverse of the period of the wave, and since it was estimated that the function would settle less than 100 μm, ω d is in the range [0, 200] μm−1. Since the desired shape is under damped, the damping coefficient (ς) is mathematically upper-limited at 1. On the other hand, if a wave is only slightly damped (e.g. ς<0.5), it would oscillate between positive and negative many times, and the residual stress profiles conventionally do not exhibit such behavior. Thus, the lower-limited of ς is 0.5( Reference Ulutan, Arisoy, Özel and Mears 18 ). Based on the measured values of residual stress, coefficients of the exponentially damped cosine function in both σ1 and σ3 directions are optimised, and the results are shown in Tables 3 and 4, respectively.
Table 3 Results of the optimised coefficients in σ1 direction (partial)

Table 4 Results of the optimised coefficients in σ3 direction (partial)

In Tables 3 and 4, R 2 is the linear correlation coefficient, and the value of R 2 lies in the range [0, 1], with ‘1’ indicating a perfect fit and ‘0’ indicating an imperfect one. It can be deduced from the results of R 2 that the proposed function gives a high precision to represent the machining-induced residual stress profile.
In Equation (7), Young’s modulus (E) of Ti–6Al–4V is 110×109 Pa, and the width of cut (d) is 5 mm.
With the data of Young’s modulus, feed speed, width of cut and the exponentially damped cosine functions of σ1 and σ3, machining-induced surface energy P cut , which unit in SI (kg/m/s) unit system is watt, was calculated. The values of the surface energy were in the range of 0.16–33.65 W, and the maximum value was get under the cutting condition of G16, while the minimum value for G03. The influence of cutting parameters on the value of machining-induced surface energy was analysed, as shown in Fig. 9.
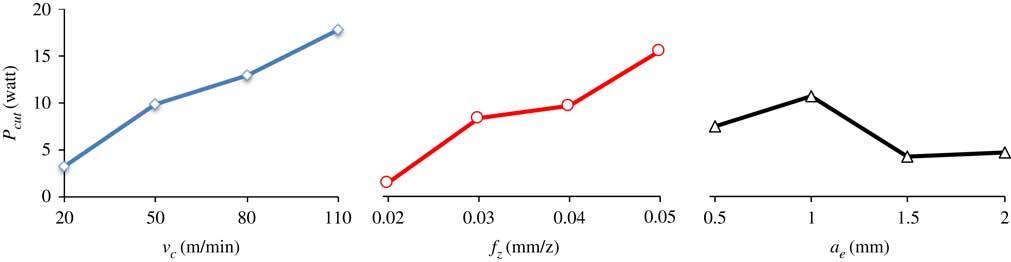
Figure 9 (Colour online) Relationship of surface energy with cutting parameters.
According to Fig. 9, with the increase of cutting speed, the machining-induced surface energy tends to become larger. This is probably due to the large cutting force under the condition of high cutting speed. It also can be found that the machining-induced surface energy gets larger with the increase of feed rate, which can be proved by Equation (7) that the strain energy stored in unit time during the machining process is directly proportional to the feed speed. In addition, the strain energy stored in unit time has little change with the varied a e for the fact of that it has little effect on the four key factors of residual stress profile. Different from linear relation of surface energy to cutting speed v c and feed rate f z , the effect of depth of cut a e on surface energy is weakened when the value of a e is greater than 1.5 mm. Furthermore, analysis of variance showed that the feed rate was the main factor affecting the machining-induced surface energy, followed by the depth of cut and cutting speed, respectively.
4.3 Effects of residual stress and surface energy on fatigue life
The fatigue test results show that the life range of the sample for case one is 2,510–8,141 cycles, and the life range for case two is 16,709–3,5341 cycles, which are shown in Fig. 10. Accordingly, the maximum fatigue life is increased by 434.1% with the maximum fatigue stress reduced 200 MPa.
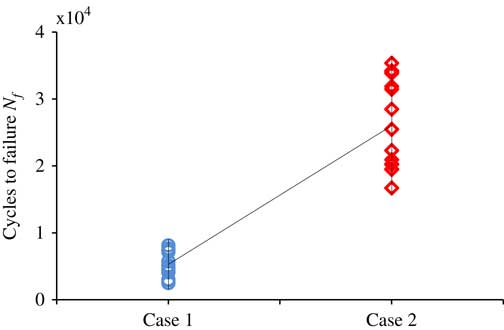
Figure 10 (Colour online) Fatigue life under various loading conditions.
The changes of fatigue life against the four key factors of the residual stress profile are shown in Figs. 11–14. As shown in Fig. 11, surface residual compressive stress is beneficial to prolong the fatigue life, and fatigue life is obviously improved with the increase of the surface residual compressive stress for both cases of one and two. It is mainly because most of the fatigue fracture of structural parts made from industrial alloys originates from the surface of the material( Reference Srikanth, Kosmac, Bona, Yin and Zhang 19 ), surface residual compressive stress makes the nucleation and propagation of fatigue cracks more difficult. In addition, according to Westergaard’s( Reference Westergaard 20 ) analysis of the stress field at the tip of fatigue crack, stress intensity factor K dominants the distribution of the stress field at the crack tip, and it will be the equivalent stress intensity factor K eff , which is coupled with the residual stress intensity factor and the initial stress intensity factor when the alternating load is acted separately. Therefore, the fatigue crack growth rate increases and the service life of part reduced. Meanwhile, compressive residual stress plays the opposite role.
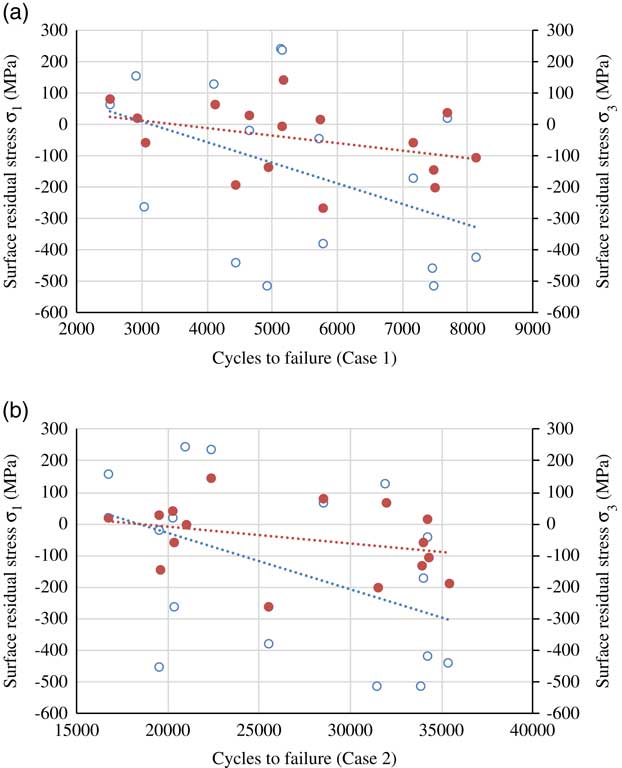
Figure 11 (Colour online) Effect of the surface residual stress on fatigue life.
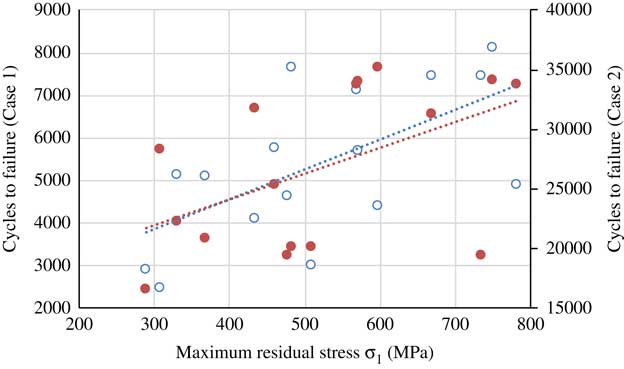
Figure 12 (Colour online) Effect of the maximum residual stress on fatigue life.
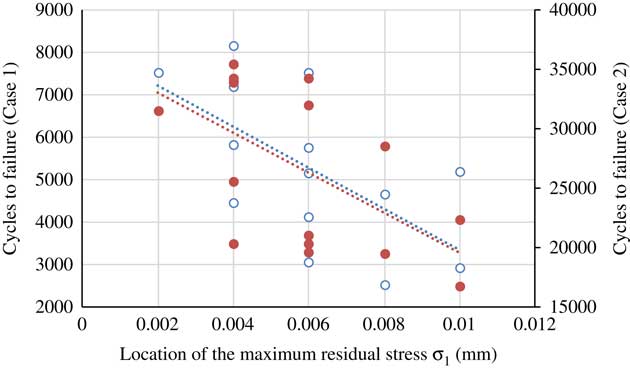
Figure 13 (Colour online) Effect of location of the maximum residual stress on fatigue life.
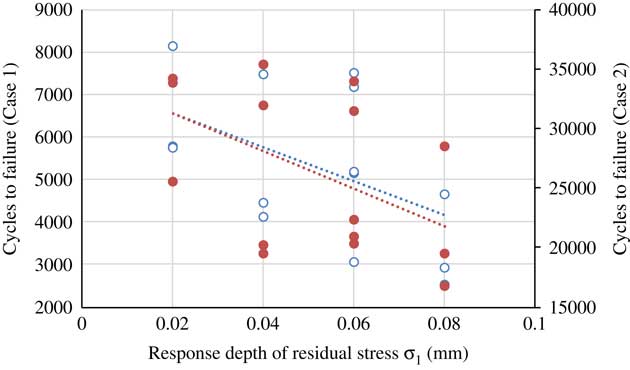
Figure 14 (Colour online) Effect of the response depth of residual stress on fatigue life.
For the reason that the direction of σ3 is perpendicular to the direction of tensile–tensile load, surface residual compressive stress in σ3 direction has a weak impact on fatigue life. Therefore, the influence of residual stress in σ3 direction will not be considered later. According to Figs 12 and 13, results show that the maximum compressive residual stress leads to an increase of fatigue life, while the effect decreases with the location of the maximum residual stress far away from the machined surface. Fig. 14 shows that the large depth of residual stress is not conducive to prolong the fatigue life.
As discussed above, it is hard to find the best combination of the four factors of the residual stress profile to get the best fatigue performance of the machined titanium alloy Ti–6Al–4V. Fatigue is an irreversible process of energy dissipation. In the process of fatigue, a part of the external machinery energy can be absorbed by the material, and the absorbed energy has a direct relationship with the fatigue life of the specimen( Reference Wang, Crupi, Guo and Zhao 21 ). According to Feltner( Reference Feltner and Morrow 22 ), there is an energy threshold W f for material fracture, which has nothing to do with loading history. The fatigue damage energy is the accumulation of plastic strain energy of materials under cyclic loading( Reference Morrow 23 , Reference Macek, Łagoda and Mucha 24 ), and the existence of initial plastic strain energy (machining-induced surface energy) will inevitably lead to the increase of fatigue damage energy, which accelerates fatigue failure. Therefore, large values of machining-induced surface energy lead to a decrease of fatigue life, which is shown in Fig. 15.
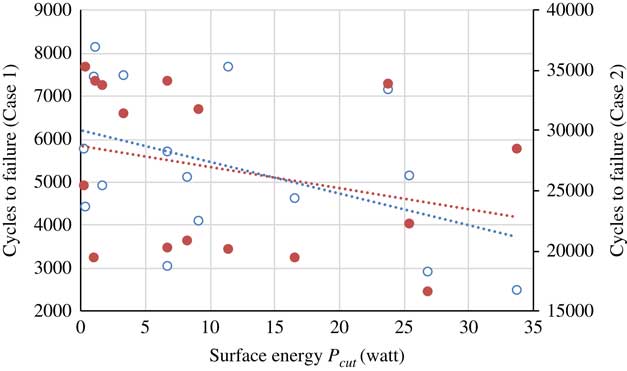
Figure 15 (Colour online) Effect of machining-induced surface energy on fatigue life.
To determine the significance of the factors of the residual stress on fatigue performance, the analysis of variance (ANOVA) tests was conducted. In the present study, a significance level of 0.05 (confidence level of 95%) was selected, and ANOVA results for the factors of residual stress are presented in Table 5. According to ANOVA analyses, values of statistic level P are much less than 0.05, which means that all the factors of residual stress have significant effects on fatigue performance of the machined titanium alloy Ti–6Al–4V. The values of the significant difference level F ratio indicate that the effect of σ C,ax on fatigue life is larger than other factors of residual stress for both cases 1 and 2. In addition, fatigue performance of case 2 is more sensitive to the machining-induced residual stress than that of case 1, which means that the effect of residual stress on fatigue life decreased with the increase of fatigue load.
Table 5 ANOVA tests results

5.0 CONCLUSION
In the present study, residual stress profile induced by peripheral milling of Ti–6Al–4V was first studied. And then, energy criteria for machining-induced residual stress field, named surface energy, were proposed to characterise the whole stated of the residual stress field. Finally, the effect of machining-induced residual stress and its energy property on fatigue performance of titanium alloy Ti–6Al–4V were discussed. The following conclusions were derived according to the researches:
Variation trend of surface residual stress (σ r,Sur ), maximum compressive residual stress (σ C,ax ), location (h r0) and response depth (h ry ) with cutting parameters showed a similar pattern for both measure directions those parallel (σ1) and perpendicular (σ3) to the cutting direction in the machined surface. Cutting speed and feed rate have a main effect on surface residual stress, and the depth of cut has little effect on all four key factors of residual stress profile.
With the increase of cutting speed and feed rate, machining-induced surface energy tended to become larger. But increasing the depth of cut caused the strain energy stored in unit time to decrease. Furthermore, the effect of depth of cut on surface energy was weakened when the value of cutting depth was greater than 1.5 mm.
Both the surface compressive residual stress and the maximum compressive residual stress are good for prolonging the fatigue life. While the large value of machining-induced surface energy led to a decrease of fatigue life, it was for the fact of the fatigue life is in inverse proportion to the values of the location of maximum compressive stress and response depth of residual stress. According to ANOVA analysis, maximum compressive stress has a greater impact on fatigue life than other residual stress factors.
Acknowledgements
This work was supported by the Key Natural Science Project of Anhui Provincial Education Department (KJ2018A0021) and High-level talent fund of Anhui University.


