Introduction
Sorghum (Sorghum bicolor (L.) Moench) is an important cereal crop in dryland regions of the world (National Research Council, 1996) and the main staple crop that is adapted to various agro-climatic regions of the world (Smith and Frederiksen, Reference Smith and Frederiksen2000). It is cultivated under several biotic and abiotic production constraints (National Research Council, 1996; Smith and Frederiksen, Reference Smith and Frederiksen2000; Ejeta, Reference Ejeta2007; AATF, 2011). Sorghum is adapted to a wide range of climatic gradients and has high variation for flowering time, plant and inflorescence morphology (Morris et al., Reference Morris, Ramu, Deshpande, Hash, Shah, Upadhyaya and Kresovich2013; Lasky et al., Reference Lasky, Upadhyaya, Ramu, Deshpande, Hash, Bonnette and Morris2015; Zhang et al., Reference Zhang, Kong, Robertson, Goff, Epps, Kerr and Paterson2015). Africa is considered as the continent of domestication and a centre of diversity for cultivated sorghum (Harlan and De Wet, Reference Harlan and de Wet1971; Li et al., Reference Li, Zhang, Zhou, Guan, Yao, Song, Wang and Zhang2010), with two centres overlapping with the borders of Nigeria (Harlan, Reference Harlan1971, Reference Harlan1992). However, Nigeria is the largest producer of sorghum grain (Nzeka and Akhidenor, Reference Nzeka and Akhidenor2018).
In order to obtain an efficient germplasm management and utilization, accurate genetic fingerprinting and genotype selection in crop improvement, the information on genetic diversity is very important and has been successfully employed (Engles et al., Reference Engles, Rao, Brown and Jackson2002; Bucheyekei et al., Reference Bucheyekei, Gwanama, Mgonja, Chisi, Folkertsma and Mutegi2009). The extent of genetic diversity within a species is mostly used to measure the level of species adaptability because genetic diversity is advantageous for survival in an erratic environmental condition (Rao and Hodgkin, Reference Rao and Hodgkin2002; Govindaraj et al., Reference Govindaraj, Vetriventhan and Srinivasan2015). Genetic variation within a population is the foundation for selection in plant breeding and is also fundamental to plant improvement (Mohammadi and Prasanna, Reference Mohammadi and Prasanna2003). Therefore the conservation of plant genetic diversity is pivotal to human food security (Rao and Hodgkin, Reference Rao and Hodgkin2002).
Genetic diversity among crop species can be estimated by using morphological, biochemical and molecular markers (Geleta and Labuschagne, Reference Geleta and Labuschagne2005; Mehmood et al., Reference Mehmood, Bashir, Ahmad, Akram, Jabeen and Gulfraz2008). Although with morphological characters, the measurement of genetic diversity is much easier, however, these traits are highly affected by the environment (Tuinstra et al., Reference Tuinstra, Grote, Goldsbrough and Ejeta1996; Van Beuningen and Busch, Reference Van Beuningen and Busch1997; Abdi et al., Reference Abdi, Bekele, Asfaw and Teshome2002). Previous researches have reported diversity assessment in sorghum using Random Amplified Polymorphism DNA (Agrama and Tuinstra, Reference Agrama and Tuinstra2003; Kanbar et al., Reference Kanbar, Shakeri, Alhajturki, Horn, Emam, Tabatabaei and Nick2019), Restricted Fragment Length Polymorphism (Deu et al., Reference Deu, Gonzalez-de-Leon, Glaszmann, Degremont, Chantereau, Lanaud and Hamon1994; Smith et al., Reference Smith, Kresovich, Hopkins, Mitchell, Dean, Woodman, Lee and Porter2000), Simple Sequence Repeat (Smith et al., Reference Smith, Kresovich, Hopkins, Mitchell, Dean, Woodman, Lee and Porter2000; Agrama and Tuinstra, Reference Agrama and Tuinstra2003; Casa et al., Reference Casa, Mitchell, Hamblin, Sun, Bowers, Paterson, Aquadro and Kresovich2005; Deu et al., Reference Deu, Rattunde and Chantereau2006; Wang et al., Reference Wang, Dean, Erpelding and Pederson2006) and Single Nucleotide Polymorphism (Murray et al., Reference Murray, Rooney, Hamblin, Mitchell and Kresovich2009; Hu et al., Reference Hu, Olatoye, Marla and Morris2019)
Despite all work done on genetic diversity studies in sorghum, the genetic diversity of Nigerian sorghum has not been well fully characterized (Olatoye et al., Reference Olatoye, Hu, Maina and Moris2018). Therefore additional research needs to be done on Nigerians sorghum genetic diversity for conservation and sustainable utilization. Thus, a highly informative, co-dominant, more effective and very potent tool like the Single Nucleotide Polymorphism (SNP) marker (Varshney et al., Reference Varshney, Beier, Khlestkina, Kota, Korzun, Röder, Graner and Börner2007) would be useful. In this study, SNPs markers were used to estimate the genetic diversity and relationships among gene bank sorghum accessions and other sorghum lines obtained from institutions within and outside Nigeria, for the efficient and effective conservation and utilization of the available genetic diversity.
Materials and methods
Plant materials
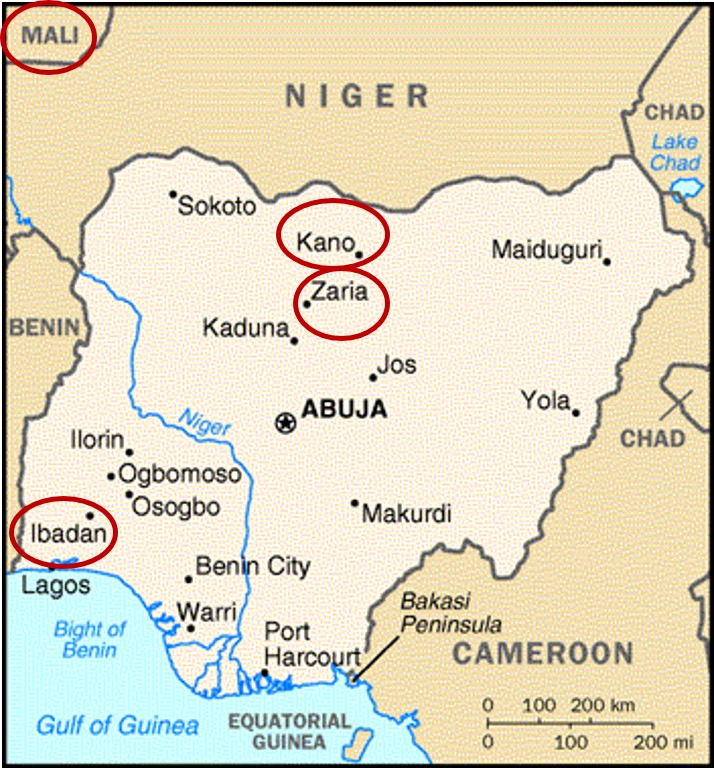
A total of 214 sorghum accessions consisting of 92 accessions from International Crops Research Institute for the Semi-Arid Tropics (ICRISAT), Kano, Nigeria, seven breeding lines from Institute for Agricultural Research (IAR), Zaria, Nigeria, 11 breeding lines from ICRISAT, Bamako, Mali and 104 accessions for National Center for Genetic Resources and Biotechnology (NACGRAB), Ibadan, Nigeria (online Supplementary Fig. S1) were collected for this study.
Genomic DNA extraction and SNP genotyping
Seeds of all the accessions were shipped to ICRISAT-India and sown on the plant quarantine field. Genomic DNA was isolated from 2 weeks old plants using the Qiagen Inc., Valencia, CA, USA, DNeasy Plant Mini Kit and digested using the thermostable ApeKI restriction enzyme. The accessions were then genotyped using the ICRISAT-CEG (https://www.icrisat.org/ceg/) Genotyping-by-Sequence (GBS) Platform. Raw reads from the sequenced GBS library were called in the GBS analysis pipeline (Tassel version: 3.0.147), an extension to the Java program TASSEL (Bradbury et al., Reference Bradbury, Zhang, Kroon, Casstevens, Ramdoss and Buckler2007), was used to call SNPs from the sequenced library by aligning tags to the BTx623 sorghum genome [Sorghum bicolor v.1.0; (Paterson et al., Reference Paterson, Bowers, Bruggmann, Dubchak, Grimwood, Gundlach and Rokhsar2009)]; This procedure provided 317,279 SNPs covering all the 10 chromosomes of the sorghum genome. Out of these 4980 SNP loci having a minimum of 0.05 allele frequency and no missing data for 157 sorghum accessions (online Supplementary Table S1), were selected using TASSEL version 4.1.12 and used for analysing the genetic diversity of sorghum accessions in the current study. Map distribution of the SNP loci on the 10 sorghum chromosomes (ch) was 693 in ch1, 630 in ch2, 656 in ch3, 559 in ch4, 580 in ch5, 437 in ch6, 302 in ch7, 367 in ch8, 377 in ch9 and 379 in ch10.
Data analysis
To quantify genetic variation among the 157 sorghum accessions, genetic diversity estimates which include minor allele frequency (MAF), gene diversity, observed and expected heterozygosity, frequency of private alleles, percentage of polymorphic loci and polymorphic information content (PIC) which refers to the relative significance of each marker with respect to the amount of polymorphism according to Botstein et al. (Reference Botstein, White, Skolnick and Davis1980) were calculated using the Genetic Analysis in Excel (GenAIEx) version 6.4 (Peakall and Smouse, Reference Peakall and Smouse2012) and PowerMarker (Liu and Muse, Reference Liu and Muse2005) softwares. The Nei's genetic distance (Nei and Li Reference Nei and Li1987) between accessions was generated by using the PowerMarker software.
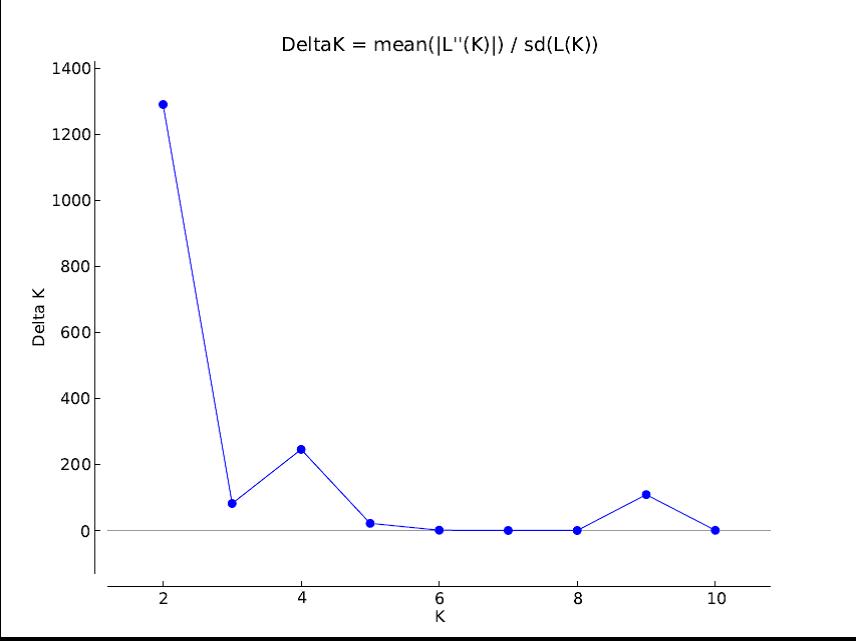
Identification and partitioning of the sorghum accessions into genetic groups was performed using two complementary clustering approaches: (i) Dendrogram was constructed based on the Neighbour-Joining (Saitou and Nei, Reference Saitou and Nei1987) algorithm according to shared-allele distance and visualized using MEGA version 5 (Tamura et al., Reference Tamura, Peterson, Peterson, Stecher, Nei and Kumar2011). (ii) Structure version 2.3.3 software (Pritchard et al., Reference Pritchard, Stephens and Donnelly2000; Falush et al., Reference Falush, Stephens and Pritchard2003) was used for the Bayesian clustering of the 157 Sorghum accessions. A burn-in period of 50,000 and a Markov chain Monte Carlo (MCMC) replications set at 50,000 was used. Three runs were performed by setting the number of clusters (K) from 1 to 10. The optimal subpopulation model was investigated in several ways: (a) by applying the informal pointers (i.e. geographical origin) proposed by Pritchard et al. (Reference Pritchard, Stephens and Donnelly2000) (b) by considering ΔK, a second order rate change with respect to K, as defined in Evanno et al. (Reference Evanno, Regnaut and Goudet2005), and (c) by plotting the log probability L(K) and ΔK of the data overruns, as implemented in STRUCTURE HARVESTER (Earl, Reference Earl2012) and thus the most likely value of K determined. Analysis of molecular variance (AMOVA) (Excoffier et al., Reference Excoffier, Smouse and Quattro1992) and the fixation index (F ST) used for population differentiation and level of significance for variance component estimates were computed using the GenAlEx software.
Results
Genetic diversity
From the 4980 informative SNPs markers, 0.08% had a MAF < 0.05, 38.88% had a MAF ⩽0.2, approximately 50% of the markers had a MAF > 0.2, and 8.78% showed almost equal allele frequencies (with MAF of 0.5) (Fig. 1).

Fig. 1. Frequency distribution of minor allele frequency among 157 sorghum accessions.
Accessions from NACGRAB-Ibadan, Nigeria showed the highest values for Nei's gene diversity and PIC, followed by ICRISAT-Kano, Nigeria and ICRISAT-Bamako, Mali (Table 1).
Table 1. Genetic diversity generated by 4980 SNP markers from 157 sorghum accessions

Ho, observed heterozygosity; He, expected heterozygosity; PIC, polymorphic information content, and % P, percentage of polymorphic loci.
We identified 174 private alleles (MAF > 0.01) only from ICRISAT-Kano, Nigeria and NACGRAB-Ibadan, Nigeria sorghum germplasms. Since accessions from IAR-Zaria, Nigeria and ICRISAT-Bamako, Mali had fewer than 10 accessions, we did not estimate the proportion of private alleles. The observed heterozygosity (Ho) within accessions obtained from ICRISAT-Kano, Nigeria, ranged from 0.00 to 0.98 with an overall mean of 0.26. Accessions from IAR-Zaria, Nigeria had observed heterozygosity ranging from 0.00 to 1.00 and the overall mean of 0.19. Within accessions obtained from ICRISAT-Bamako, Mali, observed heterozygosity ranged from 0.00 to 1.00 with an overall mean of 0.20, accessions obtained from the NACGRAB-Ibadan, Nigeria gene bank had observed heterozygosity ranged from 0.00 to 0.96 with a mean of 0.23. The expected heterozygosity (He) within accessions obtained from ICRISAT-Kano, Nigeria, ranged from 0.00 to 0.50 with an overall mean of 0.30. Accessions from IAR-Zaria, Nigeria had the expected heterozygosity ranging from 0.00 to 0.50 and the overall mean of 0.28. Within accessions obtained from ICRISAT-Bamako Mali, expected heterozygosity ranged from 0.00 to 0.50 with an overall mean of 0.30, accessions obtained from NACGRAB-Ibadan, Nigeria gene bank, had expected heterozygosity ranged from 0.00 to 0.50 with a mean of 0.30. The percentage of polymorphic loci obtained from ICRISAT-Kano, Nigeria and NACGRAB-Ibadan, Nigeria also reflects greater genetic variation compared to accessions from ICRISAT-Bamako, Mali and IAR-Zaria, Nigeria.
Genetic differentiation within and among the four germplasms
Molecular variance component among and within the accessions was compared to serve as a complementary indicator for genetic diversity. Analysis of molecular variance (AMOVA) shows that genetic variation within accessions accounted for 96% of the total variation, while the variation among populations from the four research institutes was 4% (Table 2). In spite of the very low variation among the populations; the fixation index (F ST) of 0.04 was highly significant (P < 0.001).
Table 2. Analysis of molecular variance (AMOVA) and Wright's fixation index (F ST) for 157 sorghum accessions based on by 4980 SNP markers

***P-value < 0.001.
Genetic distance and cluster analysis of 157 sorghum accessions
The pair-wise genetic distances between the germplasms which was calculated using PowerMarker software based on the allele frequency revealed the relatedness of accessions on a germplasm × germplasm basis. From the matrices given in Table 3, accessions from NACGRAB-Ibadan, Nigeria and IAR-Zaria, Nigeria were the most distant followed by ICRISAT-Kano, Nigeria and IAR-Zaria, Nigeria. While accessions from NACGRAB-Ibadan, Nigeria and ICRISAT-Kano, Nigeria were the closest at 0.01.
Table 3. Genetic distance matrices between germplasms calculated according to Nei and Li (Reference Nei and Li1987) for the 157 sorghum accessions

In order to gain further insight into the genetic diversity among different collection of sorghum, a neighbour joining tree method which was based on shared-allele genetic distances was constructed. The 157 sorghum accessions were classified into three genetically distinct groups (Fig. 2). The first group composed of 7 accessions of which 2 were from NACGRAB-Ibadan, Nigeria and the other 5 from ICRISAT-Kano, Nigeria. The second group was divided into two subgroups (2A and 2B). The subgroup 2A consisted of 17 accessions of which 5 were from NACGRAB-Ibadan, Nigeria and the other 12 were from ICRISAT-Kano, Nigeria. Subgroup 2B consisted of the majority of all analysed accession (129) and was separated into smaller groups (2Bi and 2Bii). 2Bi composed of 59 accessions with 42 from NACGRAB-Ibadan, Nigeria and 17 from ICRISAT-Kano, Nigeria. The subgroup 2Bii composed of 70 accessions with all lines from ICRISAT-Bamako, Mali, IAR-Zaria, Nigeria and others from NACGRAB-Ibadan, Nigeria and ICRISAT-Kano, Nigeria. The third major group represented 3 accessions from NACGRAB-Ibadan, Nigeria and one accession from ICRISAT-Kano, Nigeria. The model-based programme STRUCTURE was used to determine genetic relationship among the 157 sorghum accessions. STRUCTURE was run for K = 1–10 based on the distribution of alleles at 4980 SNP loci. The number of populations K = 2 revealed greater variability of maximum likelihood (Ln P(D)) among different tested K values than among repeated runs and was considered as the optimal number of populations (online Supplementary Fig. S2). The analysis of population structure revealed two major subpopulations (Fig. 3). Majority of the accessions were categorized as having admixed ancestry. We observed 77 accessions with evidence of admixture (41,29,6,1 accessions from ICRISAT-Kano, Nigeria, NACGRAB-Ibadan, Nigeria, ICRISAT-Bamako Mali and IAR-Zaria, Nigeria, respectively). The accessions represented by red colour include 19 from ICRISAT-Kano, Nigeria and 41 from NACGRAB-Ibadan, Nigeria. The remaining 19 accessions from the four research institutes were represented by the green colour.

Fig. 2. Dendrogram of 157 sorghum accessions based on the Nei's genetic distance calculated from data of 4981 SNP markers, using the neighbour joining algorithm as the clustering method. Accessions in cluster 1 ![]() , Accessions in cluster two with subclusters 2A
, Accessions in cluster two with subclusters 2A ![]() , 2Bi
, 2Bi ![]() , and 2Bii
, and 2Bii ![]() . Accessions in Cluster 3.
. Accessions in Cluster 3.![]() .
.

Fig. 3. Population structure of 157 sorghum accessions.
Discussion
The description of genetic variability in a germplasm is vital for proper application and management of genetic materials (Thudi and Fakrudin, Reference Thudi and Fakrudin2011). The average expected heterozygosity among the 157 sorghum accessions in this study is low. Previous research reported expected heterozygosity ranging from 0.6 to 0.8 among reference set of sorghum using a small set of highly polymorphic Simple Sequence Repeat (SSR) markers (Dje et al., Reference Dje, Forcioli, Ater, Lefèbvre and Vekemans1999, Uptmoor et al., Reference Uptmoor, Wenzel, Friedt, Donaldson, Ayisi and Ordon2003, Ngugi and Onyango, Reference Ngugi and Onyango2012, Ramu et al., Reference Ramu, Billot, Rami, Senthilvel, Upadhyaya, Ananda Reddy and Hash2013). However, the expected heterozygosity recorded in this study corroborate the reports of Ren et al. (Reference Ren, Sun, Chen, You, Wang, Peng and Peng2013) and Dao et al. (Reference Dao, Sanou, Mitchell, Gracen and Danquah2014) in which SNPs markers were employed and expected heterozygosity ranged between 0.2 and 0.3. The observed heterozygosity reported in the present study is 0.24 which is much higher than what was reported by Ramu et al. (Reference Ramu, Billot, Rami, Senthilvel, Upadhyaya, Ananda Reddy and Hash2013). In self-pollinating crops like sorghum in which the accessions have been kept over several generations by continuous regeneration via selfing, it is expected that the observed heterozygosity will be very small. However, due to the bi-allelic nature of SNP markers, the gene diversity or expected heterozygosity and also other values like the PIC cannot be more than 0.50, which is contrary to what is obtainable for multi-allelic markers such as SSRs in which the maximum can approach 1 (Ren et al., Reference Ren, Sun, Chen, You, Wang, Peng and Peng2013). According to Smith et al. (Reference Smith, Kresovich, Hopkins, Mitchell, Dean, Woodman, Lee and Porter2000), the PIC value of markers can give better or more information on variability in a germplasm by considering the number of alleles, then the relative frequencies of the individual allele. The average PIC value (0.24) obtained from this study was similar to other studies where SNPs markers were used (Lu et al., Reference Lu, Yan, Guimaraes, Taba, Hao, Gao and Xu2009; Hao et al., Reference Hao, Li, Xie, Weng, Li, Zhang and Zhang2011; Ren et al., Reference Ren, Sun, Chen, You, Wang, Peng and Peng2013; Dao et al., Reference Dao, Sanou, Mitchell, Gracen and Danquah2014). Thus comparing the four germplasms, with respect to the PIC values and also the heterozygosity values, across the germplasms, all the accessions seem to have a relatively narrow genetic base with accessions from IAR-Zaria, Nigeria showing more similarities and those from NACGRAB-Ibadan, Nigeria being more diverse. We detected private alleles in two germplasm (MAF > 0.01). The distribution of private alleles among accessions suggests these alleles could represent introgression from neighbouring research institutes. These private alleles may be useful in sorghum improvement for the discovery of new agronomic traits.
With sorghum being a self-pollinating crop, it is expected that the percentage variation within the population will be lower than among the population (Hamrick, Reference Hamrick, Schonewald-Cox, Chambers, MacBryde and Thomas1983). Our study revealed a low (6%) percentage of genetic variation among the sorghum accession while 94% genetic variation was found within the germplasms. These results negate those of Manzelli et al. (Reference Manzelli, Pileri, Lacerenza, Benedettelli and Vecchio2007) and Motlhaodi et al. (Reference Motlhaodi, Geleta, Bryngelsson, Fatih, Chite and Ortiz2014) who reported higher variation among accessions than within accessions but was similar to those of Tadesse and Feyissa (Reference Tadesse and Feyissa2013) and Tesfamichael et al. (Reference Tesfamichael, Githiri, Kasili, Skilton, Solomon and Nyende2014). This indicates that the accessions used in this study are not under any selection for crop improvement and there is probably continuous flow of genes among accessions from the four research institutes resulting in similarity among accessions. Also, when there is a high level of seed exchange and open sorghum marketing across localities, there is a high probability of seed mixture which narrows down the overall diversity and in turn a high percentage of the overall genetic variation being present within germplasms than among (Tesfamichael et al., Reference Tesfamichael, Githiri, Kasili, Skilton, Solomon and Nyende2014). Additionally, the population size of the germplasm collections from ICRISAT-Bamako, Mali (9) and IAR-Zaria, Nigeria (7), were very low compared to those from NACGRAB-Ibadan, Nigeria and the ICRISAT-Kano, Nigeria. The small sample sizes from those two locations may have also affected the percentage of genetic variation among the accessions (Pimm et al., Reference Pimm, Gittlaman, McCracken and Gilpin1989). It is therefore important for plant breeders to retain the ideal population size in germplasm conservation for crop improvement. As populations are not genetically the same, in order to sufficiently estimate the genetic diversity, many individuals need to be sampled (Govindaraj et al., Reference Govindaraj, Vetriventhan and Srinivasan2015).
There was high diversity within each accession, mostly within the NACGRAB-Ibadan, Nigeria and ICRISAT-Kano, Nigeria accessions with the existence of private alleles. This could be very useful to sorghum breeding program since such alleles may be linked to important traits. The ICRISAT-Kano, Nigeria and NACGRAB-Ibadan, Nigeria accessions were generally clustered together. This clustering could be because they were collected from very close regions as most of these accessions were collections obtained as a result of scientist exploration activities. Most of the accessions clustered together in cluster 2, and were further divided into subclusters 2A, 2Bi and 2Bii, indicating that there is still some degree of variability among genotypes of the major cluster. The subclusters, differentiated between accessions from NACGRAB-Ibadan, Nigeria and ICRISAT-Kano, Nigeria with the majority of the accessions from ICRISAT-Bamako, Mali, being grouped together with those from ICRISAT-Kano, Nigeria. Also, the farmers varieties obtained from IAR-Zaria, Nigeria were grouped in the subclusters 2Bii with most of the other released varieties obtained from NACGRAB-Ibadan, Nigeria gene bank and also with the ICRISAT-Kano, Nigeria and ICRISAT-Bamako, Mali accessions. This Indicates genetic relatedness among accessions which may be due to mixtures of seeds from released varieties with farmers' cultivars.
Furthermore, the smaller clustering of accessions within subclusters could be due to different naming systems of the same accessions in the different institutions such as ICRISAT-Kano, Nigeria and NACGRAB-Ibadan, Nigeria. Subcluster 2Bii with the Indian durra Striga resistant accession (N13) clustered with most of the NACGRAB-Ibadan, Nigeria accessions and in close proximity with one of the ICRISAT-Kano, Nigeria accession (Kamu awangda). Also, SRN39 and Framida obtained from ICRISAT-Bamako, Mali, which has also been classified as resistant to Striga were clustered together with IAR-Zaria, Nigeria accessions (SAMSORG39 and SAMSORG40). These reveal the relatedness of these accessions through common ancestry or sharing of same genetic background. Similar clustering pattern observed in this study has been reported previously by Tesfamichael et al. (Reference Tesfamichael, Githiri, Kasili, Skilton, Solomon and Nyende2014). Clustering of accessions obtained from ICRISAT-Bamako, Mali, in close proximity with accessions from IAR-Zaria, Nigeria also shows the extent of germplasm exchange and common gene pool sharing between these neighbouring countries and geographical zones. Grouping pattern in this research is, therefore, indicating that there could be seed exchange and pollen dispersal which causes similarity between nearby populations. There was a clear separation of the 157 sorghum accessions into two major groups with the appearance of similarity of the genetic information among accessions. The results from the pair-wise genetic distances and AMOVA corroborate that of the structure analysis, revealing lower variation among the accessions from the four research institutes. We detect concordance between our dendrogram and population structure results. From these results, SNP markers have proven to be very promising for monitoring genetic variability. Understanding the population structure of the Nigerian sorghum accessions is vital to establish new strategies useful for the preservation and utilization its genetic diversity.
Our results suggest that the sorghum accessions from different geographic origins or institutions could come from the same gene pool and may not be useful for continual sorghum improvements. Therefore, when planning for a new germplasm collection and conservation, it is imperative to characterize the available germplasm before commencing on a breeding program. Conclusively, our study revealed high genetic diversity within the sorghum germplasm. Hence, these sorghum accessions will be protected from genetic vulnerability to biotic and abiotic stresses in the growing environments and breeders will be guided on how to utilize and conserve the germplasm.
Supplementary material
The supplementary material for this article can be found at https://doi.org/10.1017/S1479262119000212
Acknowledgements
This work was undertaken as part of PhD research for author G. Afolayan and part of CGIAR Research Program (CRP) on Grain Legumes and Dryland Cereals. Authors would therefore like to acknowledge the financial support provided by Dryland Cereals for research fellowship through the West Africa Center for Crop Improvement (WACCI). Authors would also like to appreciate the Alliance for Green Revolution in Africa (AGRA) for scholarship and WACCI for excellent supervision. Also the National Centre for Genetic Resources and Biotechnology (NACGRAB), ICRISAT- Nigeria, ICRISAT- Mali and the Institute for Agricultural Research (IAR), Zaria for providing the sorghum germplasm for the study.