


Introduction
Neural crest cells (NCCs) are multipotent cells derived from the dorsal side of the neural tube during early embryo development. These NCCs undergo a series of developmental processes that includes induction, epithelial–mesenchymal transition (EMT), migration, differentiation, and eventually gives rise to cellular components in most vertebrate organ systems (Hall, Reference Hall2008). The NCCs delaminate from the neuroepithelium and migrate to their predetermined locations. This migration process is tightly regulated to allow the NCCs to reach their precise target locations, in which failure to do so would result in birth malformations. This failure has already been reported for abnormal migration of cephalic NCCs in chick embryos (McKinney et al., Reference McKinney, McLennan and Kulesa2016). The timing for cranial NCCs migration is different between chick, mouse and Xenopus. In the chick embryo, neural crest migration occurs concomitantly with the fusion of the neural folds. However, in mouse and Xenopus embryos, the NCCs migrate when the neural plate is still open (Nichols, Reference Nichols1987; Sadaghiani and Thiebaud, Reference Sadaghiani and Thiebaud1987; Theveneau et al., Reference Theveneau, Duband and Altabef2007). The migration of NCCs at the borders of the neural plate/tube relies on inductive signalling molecules from the surrounding neuroepithelium, neural plate and underlying mesoderm (Mayor et al., Reference Mayor, Morgan and Sargent1995). The signals involved may include fibroblast growth factors (FGFs), bone morphogenetic protein (BMP), wingless-type (Wnt) and retinoic acid (RA). Normally, a gradient of BMPs is set up at the borders of the neural plate and has been deemed to be essential for the specification of the developmental fate of the NCCs. The BMPs interact with Wnts, FGFs and RA to convert the cells at neural plate/tube borders to become neural crest precursor cells (Barembaum and Bronner-Fraser, Reference Barembaum and Bronner-Fraser2005; Steventon et al., Reference Steventon, Carmona-Fontaine and Mayor2005). These precursors, located at the dorsal side of the neural tube, then undergo EMT that converts them into mesenchyme-like neural crest cells. This EMT process is modulated by transcription factors, such as members of the Snail, Sox, and Endothelins (Ets) gene families. These transcription factors synergistically regulate cell–cell and cell–matrix adhesions, which facilitate the NCCs to detach from the neuroepithelium (Theveneau and Mayor, Reference Theveneau and Mayor2011).
The FGF ligand family is composed of 18 members (FGF1–10 and FGF16–23), which can be divided into six subfamilies, five paracrine subfamilies, and one endocrine subfamily, according to sequence similarity and phylogeny analysis (Beenken and Mohammadi, Reference Beenken and Mohammadi2009). The importance of FGF signalling in NCC migration is now widely accepted but the difference in NCC migration between different animal models should not be ignored (Yardley and Garcia-Castro, Reference Yardley and Garcia-Castro2012). FGF signalling might exert different effects on NCC migration at the cranial and trunk levels due to differences in their spatial–temporal bioactivities. For example, FGF signalling is involved in regulating frontal bone formation by synergistically working with TGFβ and dysfunction in this process disrupts cranial NCC osteogenesis, causing abnormal craniofacial development (Sasaki et al., Reference Sasaki, Ito, Bringas, Chou, Urata, Slavkin and Chai2006). Li et al. (Reference Li, Quarto and Longaker2010) have reported that FGF signalling activates NCC proliferation and the acquisition of osteogenic potential to promote frontal bone development. In addition, combined FGF and BMP signalling modulates the development of outflow tract valve primordium of heart by directing the differentiation of cardiac NCC-derived cushions (Zhang et al., Reference Zhang, Chang, Huang, Lin, Luo, Schwartz, Martin and Wang2010). Nevertheless, it is still unclear which role FGFs play during NCC migration in the embryo. In this study, we have employed various approaches to block FGF signalling to determine the cellular and molecular mechanisms of FGF’s action on NCC migration during early chick embryo development.
Materials and methods
Chick embryos and gene transfection
Fertilized leghorn eggs were acquired from the Avian Farm of South China Agriculture University. They were incubated in a humidified incubator (Yiheng Instruments, Shanghai, China) set at 38°C with 70% humidity. The eggs were incubated until the chick embryos reached the desired developmental stage. For gene transfection, 0.5 μl of plasmid DNAs (1.5 mg/ml green fluorescent protein (GFP), Sprouty2–GFP or Dn-FGFR1–GFP) (Yang et al., Reference Yang, Dormann, Munsterberg and Weijer2002a; Wang et al., Reference Wang, Li, Wang, Han, Chuai, Wang, Ho, Lee, Geng and Yang2013, Reference Wang, Li, Wang, Chuai, Chan, Lei, Münsterberg, Lee and Yang2015, Reference Wang, Chen, Liang, Liang, Gao, Chuai, Münsterberg, Bao, Cao and Yang2017) were microinjected into the neural tubes of HH10 (Hamburger and Hamilton stage 10) chick embryos (Hamburger and Hamilton, Reference Hamburger and Hamilton1951). Using a pair of platinum wires fashioned in parallel as electrodes, the plasmids carrying the gene of interest were transfected randomly into the neural tube cells by electroporation. The parameters used for efficient electroporation were as previously described (Yang et al., Reference Yang, Dormann, Munsterberg and Weijer2002a). For one-sided gene transfection, the polarity of the electric pulse was kept constant (Fig. S1). After electroporation, the embryos were further incubated for 8–10 h. For the experiments, all embryos were photographed and fixed for immunofluorescence staining and in situ hybridization. All experiments were performed in replicates of at least four embryos. All animal experiments were performed according to relevant national and international guidelines and approved by the Medical Research Animal Ethics Committee at Jinan University, China
Immunohistological staining
Immunofluorescence staining was performed on whole-mount embryos using HNK1, PAX7, and N-cadherin antibodies, according to methods previously described (Yang et al., Reference Yang, Chrisman and Weijer2008; Yue et al., Reference Yue, Wagstaff, Yang, Weijer and Munsterberg2008). Briefly, the embryos were fixed in 4% paraformaldehyde at 4°C overnight and then washed with PBS. Non-specific immunoreactions were blocked using 2% bovine serum albumin +1% Triton-X + 1% Tween 20 in PBS, for 2 h at room temperature. The embryos were then washed in PBS and incubated with primary monoclonal HNK1 (C0678, Sigma-Aldrich, 1:200, PAX7 (pax7, DSHB, 1:100) and N-cadherin (6B3, DSHB, 1:100) antibodies, overnight at 4°C on a shaker. After extensive washing, the embryos were incubated with anti-mouse or anti-rabbit Alexa Fluor 555 antibodies (2 µg/ml, Invitrogen) overnight at 4°C. After immunofluorescence staining, all the embryos were counterstained with DAPI (Invitrogen, 1:1000) for 30 min at room temperature. All immunofluorescence staining was performed in replicates from at least four embryos.
In situ hybridization
Whole-mount in situ hybridization of chick embryos was performed according to methods previously described (Henrique et al., Reference Henrique, Adam, Myat, Chitnis, Lewis and Ish-Horowicz1995). Digoxigenin-labelled RNA probes were synthesized to detect the presence of cyclin D1 transcripts in cells (Shoval et al., Reference Shoval, Ludwig and Kalcheim2007). The whole-mount stained embryos were photographed and then frozen sections were prepared from these by cutting at a thickness of 15 μm on a cryostat microtome (Leica CM1900).
Semi-quantitative RT-PCR
Total RNA was isolated from embryonic tissues using a TRIzol kit (Invitrogen, USA) according to the manufacturer’s instructions. First-strand cDNA was synthesized, to a final volume of 25 µl, using SuperScript III First-Strand (Invitrogen, USA). Following reverse transcription, PCR amplification of the cDNA was performed using as follows: N-cadherin: 5′-CTGGGGACATTGGGGACTTC-3′, 5′-ATAGTCTTGCTCACCACCGC-3′ (Zhang et al., 2017). PCR was performed in a Bio-Rad S1000TM Thermal cycler (Bio-Rad, USA). The cDNAs were amplified for 30 cycles. One round of amplification was performed at 98°C for 10 s, at 60°C for 15 s and at 72°C for 30 s (TaKaRa, Japan). The PCR products (20 µl) were resolved on 1% agarose gels (Biowest, Spain) in 1 × TAE buffer (0.04 M Tris–acetate and 0.001 M EDTA), and GeneGreen Nucleic Acid Dye (TIANGEN, China). The reaction products were visualized using a transilluminator (SYNGENE, UK) and a computer-assisted gel documentation system (SYNGENE). Each of these experiments was replicated three times.
Photography
After immunohistological staining, the whole-mount chick embryos were photographed using a fluorescence stereomicroscope (MVX10; Olympus, Osaka, Japan) and imaging software (Image-Pro Plus 7.0). Sections of the stained embryos were photographed using an epifluorescence microscope (Olympus IX51, Leica DM 4000B) at ×200 or ×400 magnification using the Olympus software package (Leica CW4000 FISH).
Data analysis
Areas that positively expressed HNK1 and PAX7 were measured and quantified using an Image-Pro Plus 7.0. Data analyses and statistical charts were constructed using a GraphPad Prism 5 software package (GraphPad Software, CA, USA). The results were presented as mean value (x̅ ± SE). All data were analyzed using analysis of variance (ANOVA), which was employed to establish whether or not there was any difference between control and experimental data. P-values < 0.05 were considered to be significantly different.
Results
Inhibition of FGF signalling by Sprouty2 in the developing neural tube increases NCC migration.
We investigated whether FGF signalling was involved in NCC migration during development. This was addressed by transfecting Sprouty2–GFP, which negatively regulated FGF signalling (Aranda et al., Reference Aranda, Alvarez, Turro, Laguna and de la Luna2008), into one-half of the neural tube in HH10 chick embryos. Transverse sections of the cranial and trunk regions of the transfected embryos confirmed that the left side of the neural tubes was transfected and expressed GFP (control plasmid) or Sprouty2–GFP. The right side of the neural tube did not express GFP and served as the non-transfected control (Fig. 1A1–D1 ). Immunofluorescence staining was performed on the transfected embryos using HNK1 antibody to reveal the presence of the migrating NCCs. The results showed that inducing Sprouty2–GFP expression in the neural tube caused a significant increase in HNK1+ NCCs, at both the cranial and trunk levels (Fig. 1B2, B3, D2, D3 ) compared with neural tubes transfected with GFP alone (Fig. 1A2, A3, C2, C3 ). The increase in NCCs induced by Sprouty2, compared with the control, was observed in 12 out of 14 transfected experimental embryos examined (Control = 0%, N = 0/8; Sprouty2–GFP = 85.71%, N = 12/14) (Fig. 1E ). The increased presence of HNK1+ NCCs was statistically significant at both cranial and trunk regions (cranial: 1.65 ± 0.55, P = 0.007; trunk: 1.95 ± 0.76, P = 0.003; N = 8) as compared with the control (cranial: 1.05 ± 0.15; trunk: 1.01 ± 0.03; N = 8) (Fig. 1F ).
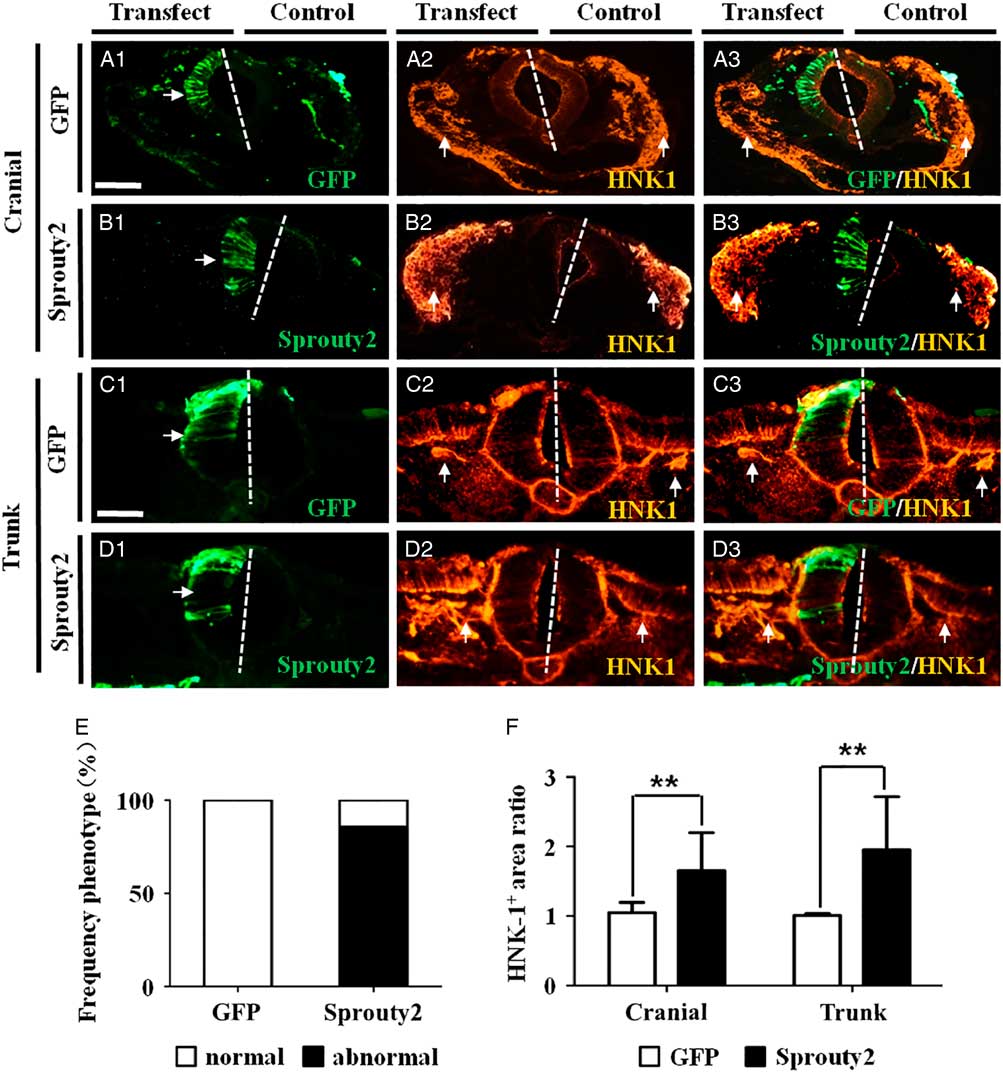
Figure 1 Induced Sprouty2 expression in chick neural tube increases HNK1+ neural crest cell production. A half-side of the neural tube in HH10 chick embryos was transfected with either GFP or Sprouty2–GFP constructs and then allowed to develop for 8–10 h. Immunofluorescence staining to demonstrate HNK1 expression was performed on transverse sections of the transfected embryos (left-hand side of the neural tube transfected with the constructs while the right-hand side served as the non-transfection control). (A1–D1) Representative transverse sections of embryos transfected with GFP (A1) or Sprouty2 (B1) at the cranial level, and GFP (C1) or Sprouty2 (D1) at the trunk level. (A2–D2) Immunofluorescence staining showing HNK1 expression in embryos transfected with GFP (A2) or Sprouty2 (B2) at cranial level, and GFP (C2) or Sprouty2 (D2) at the trunk level. (E) Bar chart showing the frequency of the phenotype following GFP or Sprouty2 transfection. (F) Bar chart showing the comparison of HNK1+ neural crest cell areas between control and transfected side. (A3–D3) Merged images of (A1–D1) and (A2–D2), respectively. (E) Bar chart showing the frequency of phenotypes following GFP or Sprouty2 transfection. (F) Bar chart comparing areas containing HNK1+ NCCs between control and transfected sides. Scale bars = 100 µm in (A1–B3) and 50 µm in (C1–D3).
To verify the above observations, the transfected embryos were immunofluorescently stained with PAX7 antibody, which revealed the presence of pre-migratory NCCs (Fig. S2). In the control, GFP transfection alone did not affect the symmetrical distribution of PAX7+ NCCs at cranial level (Fig. S2A2, A3). In contrast, Sprouty2–GFP transfection increased the production of cranial PAX7+ NCCs (Fig. S2B2, B3) in 72.73% of experimental embryos examined (control = 0%, N = 0/8; Sprouty2–GFP = 72.73%, N = 8/11) (Fig. S2C). This increase in cranial NCCs induced by Sprouty2 was statistically significant (cranial: 2.08 ± 0.30, P = 0.007; N = 5) compared with the control (cranial: 1.00 ± 0.02; N = 5) (Fig. S2D). The results suggested that blocking FGF signalling with Sprouty2–GFP can increase the number of pre-migratory NCCs at both cranial and trunk levels.
Effects of blocking FGFR1 on NCC migration
FGF signalling in the neural tube can be blocked by transfecting a dominant-negative FGFR1 (Dn-FGFR1) construct into the neural tubes. A half-side (left-hand side) of the neural tube was transfected with the Dn-FGFR1 construct, which was confirmed by co-transfection with a GFP construct (Fig. 2A1–D1 ). We first investigated whether the number of HNK1+ NCCs was increased by Dn-FGFR1 blocking FGF signalling. The results revealed that there were significantly more HNK1+ NCCs at the Dn-FGFR1-transfected side than the contralateral control side, at both cranial and trunk levels (Fig. 2B2, B3, D2, D3 ). This increase was not observed when the neural tube was transfected with GFP instead of Dn-FGFR1 (Fig. 2A2, A3, C2, C3 ). The increase in NCCs induced by blocking FGFR1 was observed in 71.43% of embryos examined (control = 0%, N = 0/8; Dn-FGFR1 = 71.43%, N = 10/14) (Fig. 2E ). The increase in HNK1+ NCCs was statistically significant (cranial: 1.85 ± 0.70, P = 0.009; trunk: 2.05 ± 0.88, P = 0.005; N = 5) compared the controls (cranial: 1.05 ± 0.15; trunk: 1.01 ± 0.03; N = 5) (Fig. 2F ).
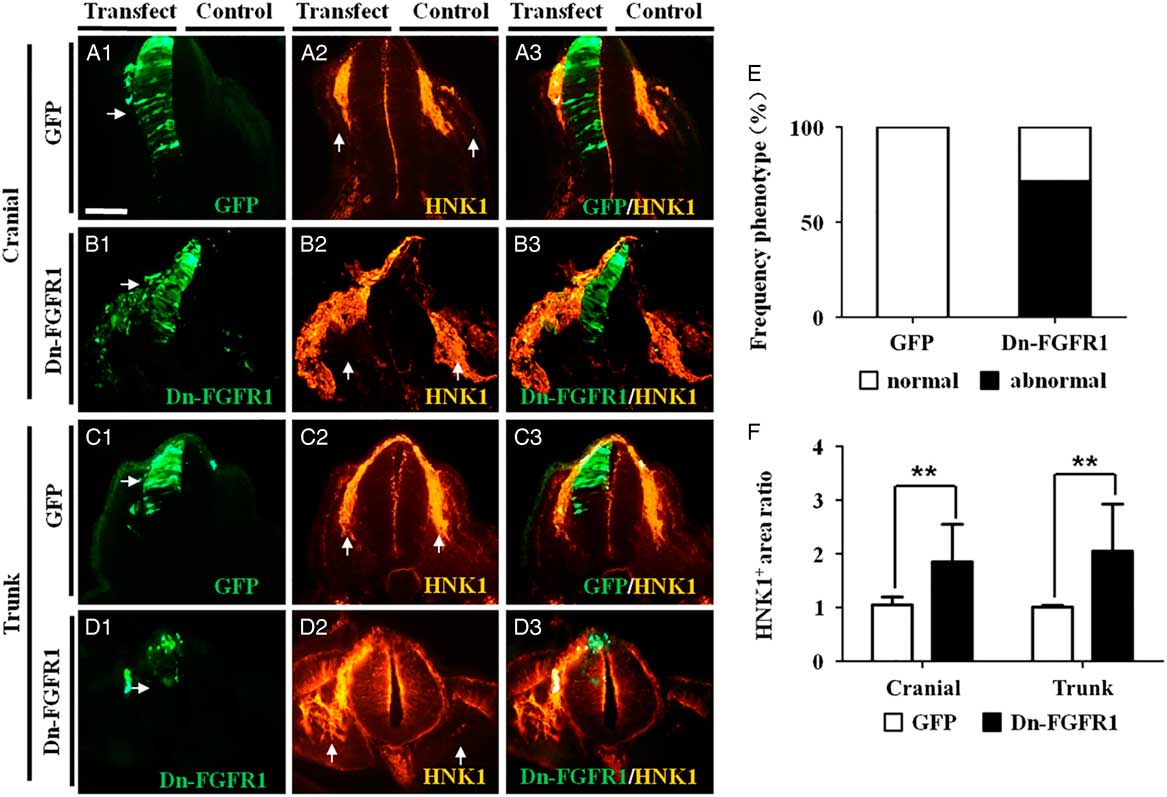
Figure 2 Inhibition of FGFR1 expression in chick neural tube increases HNK1+ neural crest cells production. A half-side of the neural tube in HH10 chick embryos was transfected with either GFP or Dn-FGFR1–GFP constructs and then allowed to develop for 8–10 h. Immunofluorescence staining to demonstrate HNK1 expression was performed on transverse sections of the transfected embryos (left-hand side of the neural tube transfected with the constructs while right-hand side served as the non-transfection control). (A1–D1) Representative transverse sections of embryos transfected with GFP (A1) or Dn-FGFR1 (B1) at the cranial level, and GFP (C1) or Dn-FGFR1 (D1) at the trunk level. (A2–D2) Immunofluorescence staining showing HNK1 expression in embryos transfected with GFP (A2) or Dn-FGFR1 (B2) at cranial level, and GFP (C2) or Dn-FGFR1 (D2) at the trunk level. (A3–D3) Merged images of (A1–D1) and (A2–D2), respectively. (E) Bar chart showing the frequency of phenotypes following GFP or Dn-FGFR1 transfection. (F) Bar chart comparing areas containing HNK1+ NCCs between control and transfected sides. Scale bars = 50 µm in (A1–D3).
Effects of inhibiting FGF signalling by Sprouty2 on N-cadherin expression in the neural tube
Immunofluorescence staining for N-cadherin (Fig. 3A2–D2 ) was performed on embryos that had been transfected with Sprouty2–GFP on a half-side of the neural tube (Fig. 3A1–D1 ). The results showed that inducing Sprouty2 expression in the neural tube did not affect N-cadherin expression at both cranial and trunk levels (Fig. 3A2–D2, A3–D3 ). There was no statistical difference in N-cadherin expression between the control and Sprouty2 groups (cranial: 1.01 ± 0.11, P = 0.944; trunk: 1.06 ± 0.12, P = 0.430; N = 5) (Fig. 3F ). The results suggested that suppression of FGF signalling in the neural tube would not alter N-cadherin expression.
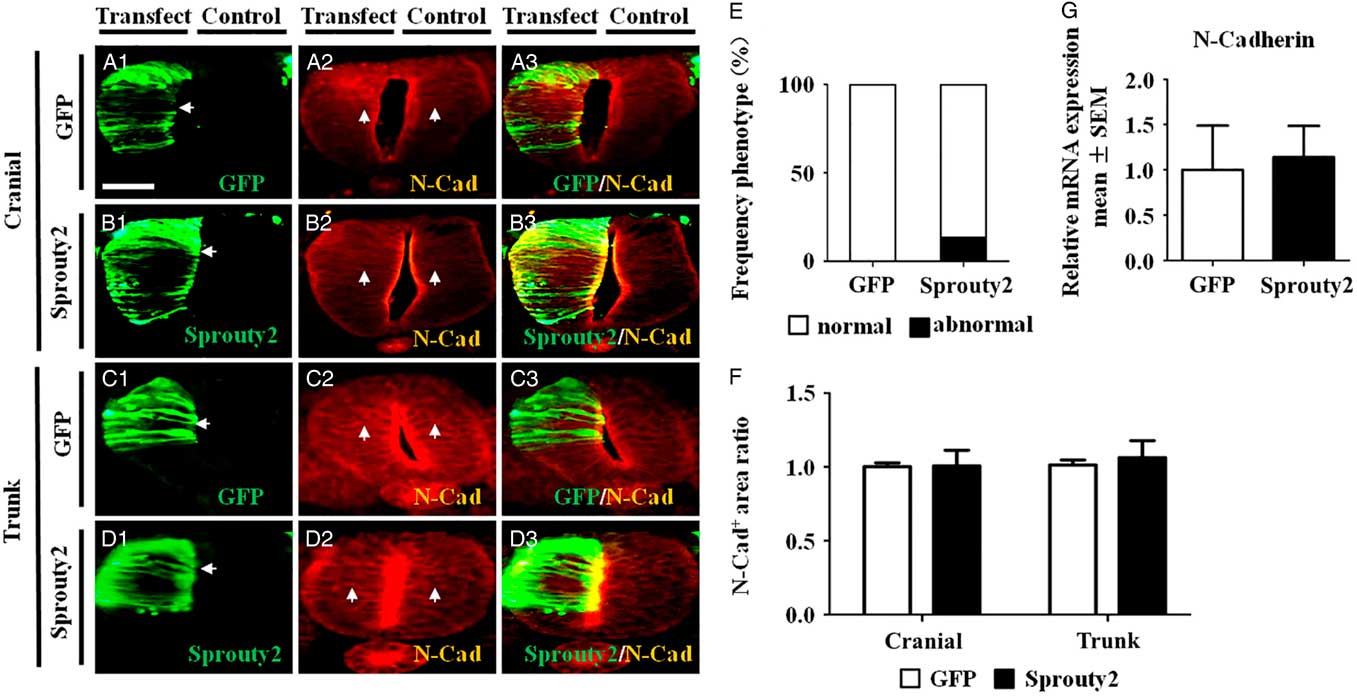
Figure 3 Sprouty2 does not affect N-cadherin expression in chick neural tube. (A1–D1) Representative transverse sections of embryos transfected with GFP (A1) or Sprouty2 (B1) at the cranial level, and GFP (C1) or Sprouty2 (D1) at the trunk level. (A2–D2) Immunofluorescence staining showing N-cadherin (N-Cad) expression in embryos transfected with GFP (A2) or Sprouty2 (B2) cranially and GFP (C2) or Sprouty2 (D2) at the trunk. (A3–D3) Merged images of (A1–D1) and (A2–D2), respectively. (E, G) Bar charts showing the frequency of phenotypes following GFP or Sprouty2 transfection. (F) Bar chart comparing N-Cad+ areas in neural tubes between control and transfected side. (G) RT-qPCR analysis revealed the relative N-cadherin expression levels in GFP and Sprouty2 transfected tissues. Scale bars = 25 µm in (A1–D3).
Effects of inhibiting FGF signalling by Sprouty2 on cyclin D1 expression in the neural tube
We performed whole-mount in situ hybridization for cyclin D1 expression on embryos transfected with GFP or Sprouty2–GFP on a half-side of the neural tube (Fig. 4A1–D1 ). We determined that the area of neural tube that expressed cyclin D1 was significantly increased by Sprouty2–GFP (Fig. 4B2, D2 ) compared with the GFP control (Fig. 4A2, C2 ). The results implied that inhibiting FGF signalling by Sprouty2 increased cell proliferation, which was observed in 73.68% (N = 14/19) of experimental embryos examined (Fig. 4E, F ).
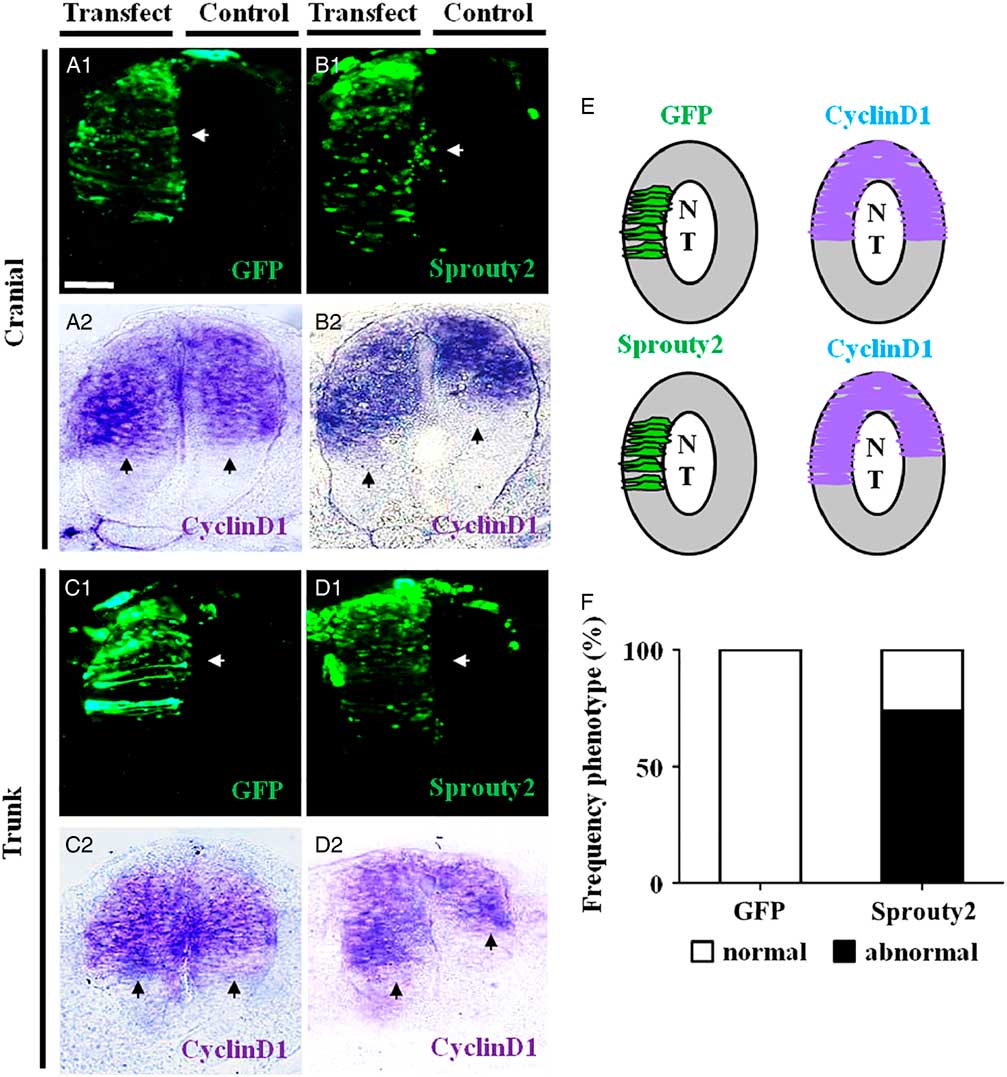
Figure 4 Sprouty2 increased cyclin D1 expression in chick neural tubes. A half-side of the neural tube in HH10 chick embryos was transfected with either GFP or Sprouty2–GFP, and then incubated further for 8–10 h. In situ hybridization was performed on the transfected embryos to identify cells expressing cyclin D1 (left-side transfected; right-side non-transfected control). (A1–D1) Representative transverse sections of embryos transfected with GFP (A1) or Sprouty2 (B1) at the cranial level, and GFP (C1) or Sprouty2 (D1) at the trunk level. (A2–D2) In situ hybridization showing cyclin D1 expression in transverse sections of embryos transfected with GFP (A2) or Sprouty2 (B2) at cranial level, and GFP (C2) or Sprouty2 (D2) at the trunk level. (E) Schematic drawing comparing cyclin D1 expression in neural tubes between control and transfected side. (F) Bar chart showing the frequency of the phenotypes following GFP and Sprouty2–GFP transfections. NT, neural tube. Scale bars = 25 µm in (A1–D2).
Discussion
Neural crest cell migration is an essential morphogenetic process in the developing embryo. This process has been commonly studied using mouse and zebrafish embryos. However, we selected the early chick embryos as our experimental model because these embryos are easy to manipulate and analyze. In addition, development of chicken embryos at early stages has a lot in common with early human embryos. To date, the best live imaging of NCC migration has been conducted with chicken embryos. Hence, the early chick embryo is the most ideal model for investigating NCC migration.
The molecular mechanism controlling NCC migration involves a complex network of interacting genes that is still poorly understood. In human, there are 22 members in the FGF family and some of these are involved in regulating NCC migration by FGF signalling. FGF signalling could be blocked using various molecular approaches such as inducing Sprouty2 expression or inhibiting FGFR1 in the developing neural tube. Moreover, HNK1 and PAX7 expression could be used to follow NCC migration. NCCs start expressing HNK1 as soon as they delaminate and migrate away from the neural tube, while PAX7 is expressed in pre-migratory NCCs. In this study, we demonstrated that they had the same effects on the HNK1+ migrating NCCs production and PAX7+ pre-migratory NCCs.
In mammals, Sprouty2 regulates the tyrosine kinase/ERK signalling pathways, including EGF and FGFs. Hence, Sprouty2 is involved in many biological processes such as cell growth, differentiation and migration (Henrique et al., Reference Henrique, Adam, Myat, Chitnis, Lewis and Ish-Horowicz1995; Yue et al., Reference Yue, Wagstaff, Yang, Weijer and Munsterberg2008). Our results revealed that blocking FGF signalling significantly increased the number of HNK1+ NCCs present at both the cranial and trunk levels in the chick embryo. This result was further validated by transfecting the left side of the neural tube with GPF (serving as the control) while the right side was transfected with Sprouty2–GFP within the same embryo to prevent interembryo variations. HNK1 is mainly expressed by migrating NCCs, so we re-assessed the results by examining the pre-migratory NCCs population that expressed PAX7 (Shoval et al., Reference Shoval, Ludwig and Kalcheim2007; Aranda et al., Reference Aranda, Alvarez, Turro, Laguna and de la Luna2008). We determined that blocking FGF signalling by inducing Sprouty2 expression in the neural tube also significantly increased the number PAX7+ pre-migratory NCCs. Using the same strategy, we transfected dominant-negative FGFR1 (Dn-FGFR1) constructs into the developing neural tube to block FGF signalling (Yang et al., Reference Yang, Dormann, Munsterberg and Weijer2002b). The results showed that this procedure significantly increased NCC migration, implying that FGFR1 plays a crucial role in the migration process. It has been reported that blocking FGFR1 delayed cardiac NCCs migration (Sato et al., Reference Sato, Scholl, Kuhn, Stadt, Decker, Pegram, Hutson and Kirby2011), however this is inconsistent with our conclusions. It has also been reported that FGF could control the timing of NCC emigration at the trunk level (Martinez-Morales et al., 2011). We agree with the latter and demonstrated that FGF signalling significantly affected NCC migration.
Cell adhesion is a fundamental morphogenetic process that regulates normal embryonic development. Cadherins, a large family of calcium-dependent cell adhesion molecules, are spatiotemporally distributed in the developing embryo and play a crucial role in determining the formation of NCCs. Neural crest cells express different sets of cadherins at different stages of development that include induction, migration and subsequent differentiation. It has been reported that N-cadherin expression is essential for NCC separation from the neural tube and also allows the NCCs to interact with each other during migration. During NCC induction, E-cadherin expression is downregulated in the neural plate and replaced by N-cadherin (Pla et al., Reference Pla, Moore, Morali, Grille, Martinozzi, Delmas and Larue2001). N-Cadherin is negatively regulated by the combined actions of BMP signalling and proteolysis (Shoval et al., Reference Shoval, Ludwig and Kalcheim2007; Taneyhill, Reference Taneyhill2008). NCC migration is a complex process that is directed by the intrinsic properties of NCCs and their interaction with the external environment. There is accumulating evidence that cell-to-cell interaction is also crucial for establishing and maintaining the directionality of NCC migrations (Clay and Halloran, Reference Clay and Halloran2014; Barriga and Mayor, Reference Barriga and Mayor2015). It has been reported that increased N-cadherin expression is important for NCC migration (Pla et al., Reference Pla, Moore, Morali, Grille, Martinozzi, Delmas and Larue2001; Shoval et al., Reference Shoval, Ludwig and Kalcheim2007) and N-cadherin is regulated by the FGF signalling pathway (Bryant et al., Reference Bryant, Wylie and Stow2005; Perrais et al., Reference Perrais, Chen, Perez-Moreno and Gumbiner2007). In this study, we revealed that blocking FGF signalling by inducing Sprouty2 expression in the neural tube increased NCC migration. Interestingly, we did not find any corresponding changes in N-cadherin expression in the cranial and trunk neural tube. This implied that the effects of FGF signalling on NCC bioactivities were independent of N-cadherin. It has been reported that FGF-2 could increase N-cadherin expression in human calvaria osteoblasts, this finding contradicts our present results (Debiais et al., Reference Debiais, Lemonnier, Hay, Delannoy, Caverzasio and Marie2001) and may be attributed due to the differences in species and different cell types.
Cell proliferation at the dorsal side of neural tube is important for NCC development and subsequent migration (Wang et al., Reference Wang, Li, Wang, Han, Chuai, Wang, Ho, Lee, Geng and Yang2013, Reference Wang, Li, Wang, Chuai, Chan, Lei, Münsterberg, Lee and Yang2015,). In this study, we demonstrated that blocking FGF signalling, by inducing Sprouty2 expression in the neural tube, could significantly increase cyclin D1 expression in the neural tube cells. This result suggests that normally FGF signalling inhibits pre-migratory NCC proliferation through MAPK signalling, and explains why blocking FGF signalling in HH10 embryos could significantly increase the number of cranial and trunk NCCs.
Embryo development is a complex and dynamic process and the embryonic environment plays an important role in maintaining normal development (Reichetzeder et al., Reference Reichetzeder, Putra, Li and Hocher2016). FGF are secreted by embryonic cells into this environment and through an autocrine or paracrine manner regulates brain, heart, liver and kidney organogenesis (Brewer et al., Reference Brewer, Mazot and Soriano2016; Itoh et al., Reference Itoh, Ohta, Nakayama and Konishi2016). It has been reported that FGF8 is expressed in early stage embryos and knocking out this gene severely affects cardiac NCC proliferation and survival. Moreover, FGF8 deficiency in cardiac NCCs would lead to abnormal development of the heart outflow tract (Abu-Issa et al., Reference Abu-Issa, Smyth, Smoak, Yamamura and Meyers2002; Itoh et al., Reference Itoh, Ohta, Nakayama and Konishi2016). Similarly, FGF10 is indispensable for normal liver development and knocking out this gene severely affects hepatocyte proliferation and survival, resulting in a small abnormal liver (Berg et al., Reference Berg, Rountree, Lee, Estrada, Sala, Choe, Veltmaat, De Langhe, Lee, Tsukamoto, Crooks, Bellusci and Wang2007). FGF23 is an important regulator of mineral homeostasis, which rises sharply in patients with kidney disease. FGF23 could apparently activate fibroblasts and perpetuate the profibrotic signal transduced by the injured kidney, which further increases the progression of the disease (Smith et al., Reference Smith, Holt and Hewitson2017). Therefore, FGF signalling plays an important role in embryonic development, homeostasis and disease development.
In conclusion, we have demonstrated that FGF signalling plays an important role in NCC development and migration. At the neurulation stage, blocking the FGF signalling in the developing neural tube increases NCCs migration, this is partly attributed to FGF’s ability to modulate pre-migratory NCC proliferation. Nevertheless, there is still many unknown aspects about how FGF interacts with NCC, these remains to be investigated in the future.
Acknowledgements
We would like to thank Prof. Chaya Kalcheim for providing the cyclin D1 plasmid.
Financial support
This study was supported by the National Natural Science Foundation of China (NSFC) grant (31401230; 81571436); Science and Technology Planning Project of Guangdong Province (2014A020213008) Science and Technology Program of Guangzhou (201510010073); and the Fundamental Research Funds for the Central Universities (21615421).
Conflicts of interest
The authors declare that they have no conflict of interest.
Ethical standards
All animal experiments were performed according to relevant national and international guidelines and approved by the Medical Research Animal Ethics Committee at Jinan University.
Supplementary material
To view supplementary material for this article, please visit https://doi.org/10.1017/S096719941800045X


