


1 Introduction
The laminar–turbulent transition of high-speed boundary layers results in large increases in skin friction drag and surface heating. The transition process is often accelerated by wall irregularities in the form of surface roughness or other imperfections interfering with the incoming laminar flow (Schneider Reference Schneider2008, Fedorov Reference Fedorov2011). While empirical correlations of roughness-induced high-speed flow transition are often used as a guidance for prediction purposes (e.g. Horvath et al. Reference Horvath, Zalameda, Wood, Berry, Schwartz, Dantowitz, Spisz and Taylor2012), there is a need to expand the understanding on the related physical mechanisms so as to eventually enable the development of enhanced physics-based transition models capable of delivering more accurate predictions (Reshotko Reference Reshotko2007).
The present study follows from that in Fiala, Hillier & Estruch-Samper (Reference Fiala, Hillier and Estruch-Samper2014), whereby the transition of a hypersonic blunt-body boundary layer was experimentally investigated. The study used surface heat transfer to identify the narrow range between critical and effective conditions, i.e. respectively the shortest height capable of altering the downstream laminar flow to induce transition onset and the shortest height where transition occurs at a fixed distance behind the element, and above which taller heights no longer lead to an upstream shift of transition onset. Such conditions were accordingly achieved with
 $k/\unicode[STIX]{x1D6FF}_{n}\approx 0.1$
(
$k/\unicode[STIX]{x1D6FF}_{n}\approx 0.1$
(
 $Re_{kk}=123$
, where
$Re_{kk}=123$
, where
 $Re_{kk}=\unicode[STIX]{x1D70C}_{k}U_{k}k/\unicode[STIX]{x1D707}_{k}$
;
$Re_{kk}=\unicode[STIX]{x1D70C}_{k}U_{k}k/\unicode[STIX]{x1D707}_{k}$
;
 $\unicode[STIX]{x1D70C}_{k}$
,
$\unicode[STIX]{x1D70C}_{k}$
,
 $U_{k}$
and
$U_{k}$
and
 $\unicode[STIX]{x1D707}_{k}$
being density, velocity and dynamic viscosity at element height) and
$\unicode[STIX]{x1D707}_{k}$
being density, velocity and dynamic viscosity at element height) and
 $k/\unicode[STIX]{x1D6FF}_{n}\approx 0.2$
(
$k/\unicode[STIX]{x1D6FF}_{n}\approx 0.2$
(
 $Re_{kk}=347$
), where
$Re_{kk}=347$
), where
 $\unicode[STIX]{x1D6FF}_{n}=0.4$
mm is the boundary layer thickness at roughness element location on the hemispherical nose. Noting the susceptibility of the blunt-body boundary layer to micron size roughness, and in order to enable a higher resolution to study the effect of roughness height (
$\unicode[STIX]{x1D6FF}_{n}=0.4$
mm is the boundary layer thickness at roughness element location on the hemispherical nose. Noting the susceptibility of the blunt-body boundary layer to micron size roughness, and in order to enable a higher resolution to study the effect of roughness height (
 $\unicode[STIX]{x0394}k$
), the location of the element is here shifted to a downstream region over the cylindrical portion of the body, thus allowing the boundary layer to develop further (
$\unicode[STIX]{x0394}k$
), the location of the element is here shifted to a downstream region over the cylindrical portion of the body, thus allowing the boundary layer to develop further (
 $\unicode[STIX]{x1D6FF}_{k}=1.75$
mm, based on laminar computational fluid dynamics (CFD) and with edge taken at 99.5 % of the recovery of total enthalpy
$\unicode[STIX]{x1D6FF}_{k}=1.75$
mm, based on laminar computational fluid dynamics (CFD) and with edge taken at 99.5 % of the recovery of total enthalpy
 $h_{o}$
from the wall). This enables documenting the region close behind the element (
$h_{o}$
from the wall). This enables documenting the region close behind the element (
 ${\sim}5\unicode[STIX]{x1D6FF}_{k}$
) and up to
${\sim}5\unicode[STIX]{x1D6FF}_{k}$
) and up to
 ${\sim}40\unicode[STIX]{x1D6FF}_{k}$
downstream of it.
${\sim}40\unicode[STIX]{x1D6FF}_{k}$
downstream of it.
An isolated quadrilateral element is tested in both a square and a diamond arrangement, i.e. respectively with an edge or a vertex of the square facing the flow and with height as the only additional variable. The square configuration aims at producing a similar test case to the studies by De Tullio et al. (Reference De Tullio, Paredes, Sandham and Theofilis2013), where the instability and breakdown to turbulence induced by a quadrilateral element was investigated numerically at Mach 2.5. Their results described the dynamics within the high shear region surrounding the downstream low- and high-speed streaks and the multiple modes of instability embedded in the wake of the roughness element. For a
 $k/\unicode[STIX]{x1D6FF}_{k}=0.44$
element (
$k/\unicode[STIX]{x1D6FF}_{k}=0.44$
element (
 $Re_{kk}=791$
), the roughness wake was found to be dominated by varicose mode instability driven by wall-normal shear, while sinuous mode instabilities (associated with lateral shear) were found to be relatively weaker. Results were in general agreement with previous numerical and experimental studies by Choudhari et al. (Reference Choudhari, Li, Wu, Chang, Edwards, Kegerise and King2010, Reference Choudhari, Li, Chang, Norris and Edwards2013) and Kegerise et al. (Reference Kegerise, King, Owens, Choudhari, Norris, Li and Chang2012) on isolated diamond elements at Mach 3.5, where sinuous modes were found to experience greater amplification for shorter elements and varicose instability to become more dominant and drive the breakdown to turbulence for higher
$Re_{kk}=791$
), the roughness wake was found to be dominated by varicose mode instability driven by wall-normal shear, while sinuous mode instabilities (associated with lateral shear) were found to be relatively weaker. Results were in general agreement with previous numerical and experimental studies by Choudhari et al. (Reference Choudhari, Li, Wu, Chang, Edwards, Kegerise and King2010, Reference Choudhari, Li, Chang, Norris and Edwards2013) and Kegerise et al. (Reference Kegerise, King, Owens, Choudhari, Norris, Li and Chang2012) on isolated diamond elements at Mach 3.5, where sinuous modes were found to experience greater amplification for shorter elements and varicose instability to become more dominant and drive the breakdown to turbulence for higher
 $Re_{kk}$
. In subsequent DNS studies on square elements by De Tullio & Sandham (Reference De Tullio and Sandham2015) in a Mach 6 boundary layer, two main mechanisms responsible for the excitation of wake modes were described: a first one due to the interaction of the local reversed flow with external disturbances and a second one due to the interaction between the roughness wake and the different boundary layer modes. As further shown in recent DNS studies, similar mechanisms are induced by hemispherical (Iyer & Mahesh Reference Iyer and Mahesh2013) and cylindrical roughness (Subbareddy, Bartkowicz & Candler Reference Subbareddy, Bartkowicz and Candler2014). In this study, we investigate in detail the effect of roughness height by systematically varying
$Re_{kk}$
. In subsequent DNS studies on square elements by De Tullio & Sandham (Reference De Tullio and Sandham2015) in a Mach 6 boundary layer, two main mechanisms responsible for the excitation of wake modes were described: a first one due to the interaction of the local reversed flow with external disturbances and a second one due to the interaction between the roughness wake and the different boundary layer modes. As further shown in recent DNS studies, similar mechanisms are induced by hemispherical (Iyer & Mahesh Reference Iyer and Mahesh2013) and cylindrical roughness (Subbareddy, Bartkowicz & Candler Reference Subbareddy, Bartkowicz and Candler2014). In this study, we investigate in detail the effect of roughness height by systematically varying
 $k/\unicode[STIX]{x1D6FF}_{k}$
, and hence
$k/\unicode[STIX]{x1D6FF}_{k}$
, and hence
 $Re_{kk}$
.
$Re_{kk}$
.
2 Experimental procedures
We employ a body of revolution as base geometry. The cylinder/flare configuration (figure 1
a), located well downstream of the blunt-cylinder nose, intends to facilitate interpretation of results through the enhancement of roughness-induced disturbances as they convect through the shock-wave/boundary-layer interaction (SBLI) region in a similar approach as that in the numerical simulations by Choudhari et al. (Reference Choudhari, LI, Chang and Edwards2009). Results rely on the measurement of heat transfer as a sensitive property to characterise near-wall fluctuations downstream of the element. As such, wake disturbances are here interpreted in terms of the resulting heat flux perturbation with respect to the undisturbed case (cf. the level of unsteady fluctuation associated more directly with the transition process). The amplification of disturbances within the wake of the diamond and square roughness elements (figure 1
b) is accordingly correlated to the gradual transition of the interaction from a fully laminar state with separation to a fully turbulent attached state, and transition onset locations
 $x_{tr}$
are derived based on the onset of heat transfer overshoot from the base level (e.g. see Berry & Horvath Reference Berry and Horvath2008). To facilitate high-resolution height adjustments (
$x_{tr}$
are derived based on the onset of heat transfer overshoot from the base level (e.g. see Berry & Horvath Reference Berry and Horvath2008). To facilitate high-resolution height adjustments (
 $\unicode[STIX]{x0394}k=50~\unicode[STIX]{x03BC}\text{m}$
), the roughness element is integrated to a micrometre module and varied within the range
$\unicode[STIX]{x0394}k=50~\unicode[STIX]{x03BC}\text{m}$
), the roughness element is integrated to a micrometre module and varied within the range
 $0\leqslant k/\unicode[STIX]{x1D6FF}_{k}\leqslant 1.71$
at a fixed location. This enables a detailed study on the effect of roughness height and the evaluation of existing correlation criteria (noting that the limitations inherent to sensor spatial/spectral resolution and restricted dataset challenge the development of more elaborate measures). A ‘controlled’ experimental study on roughness-induced transition is thus conducted in this manner.
$0\leqslant k/\unicode[STIX]{x1D6FF}_{k}\leqslant 1.71$
at a fixed location. This enables a detailed study on the effect of roughness height and the evaluation of existing correlation criteria (noting that the limitations inherent to sensor spatial/spectral resolution and restricted dataset challenge the development of more elaborate measures). A ‘controlled’ experimental study on roughness-induced transition is thus conducted in this manner.

Figure 1. Schematic of test models: (a) cylinder/flare region indicating locations of laminar separation
 $S$
and reattachment
$S$
and reattachment
 $R$
, with separation length
$R$
, with separation length
 $L$
, flare angle
$L$
, flare angle
 $\unicode[STIX]{x1D6FF}$
, measurement stations
$\unicode[STIX]{x1D6FF}$
, measurement stations
 $x_{meas}$
, roughness element location
$x_{meas}$
, roughness element location
 $x_{k}$
and undisturbed laminar boundary layer thickness and edge Mach number,
$x_{k}$
and undisturbed laminar boundary layer thickness and edge Mach number,
 $\unicode[STIX]{x1D6FF}_{k}$
and
$\unicode[STIX]{x1D6FF}_{k}$
and
 $M_{ek}$
; (b) quadrilateral roughness element planform geometries with edge length
$M_{ek}$
; (b) quadrilateral roughness element planform geometries with edge length
 $l_{k}$
and height
$l_{k}$
and height
 $k$
, and Mach number at edge
$k$
, and Mach number at edge
 $M_{ek}$
and roughness height
$M_{ek}$
and roughness height
 $M_{kk}$
.
$M_{kk}$
.
Table 1. Reference values of laminar separation defined by CFD (nomenclature as per figure 1).
Experiments were conducted at the Imperial College gun tunnel using nitrogen as the test gas and at a free-stream Mach number of
 $M_{\infty }=8.9$
. The total flow conditions were set at
$M_{\infty }=8.9$
. The total flow conditions were set at
 $p_{o,\infty }=60.8$
MPa and
$p_{o,\infty }=60.8$
MPa and
 $T_{o,\infty }=1150$
K, resulting in free-stream static pressure and temperature of
$T_{o,\infty }=1150$
K, resulting in free-stream static pressure and temperature of
 $p_{\infty }=3100$
Pa and
$p_{\infty }=3100$
Pa and
 $T_{\infty }=68.3$
K, and a unit Reynolds number of
$T_{\infty }=68.3$
K, and a unit Reynolds number of
 $Re_{\infty }=47.4\times 10^{6}~\text{m}^{-1}$
. Each run lasted 25 ms, including ramp-up to steady test conditions and a subsequent ramp-down, and with a established flow duration of 6 ms (starting 10 ms from tunnel start). For data reduction and laminar CFD, the Prandtl number is assumed constant at
$Re_{\infty }=47.4\times 10^{6}~\text{m}^{-1}$
. Each run lasted 25 ms, including ramp-up to steady test conditions and a subsequent ramp-down, and with a established flow duration of 6 ms (starting 10 ms from tunnel start). For data reduction and laminar CFD, the Prandtl number is assumed constant at
 $Pr=0.72$
and the viscosity is evaluated using Keyes’ law to handle the low external temperatures (near-wall viscosity predictions related to higher temperatures are
$Pr=0.72$
and the viscosity is evaluated using Keyes’ law to handle the low external temperatures (near-wall viscosity predictions related to higher temperatures are
 $1.3\,\%\pm 0.5\,\%$
greater than using Sutherland’s law). The numerical procedure is formulated as a second-order accurate ‘convection–diffusion-split’ axisymmetric Navier–Stokes code with convective fluxes solved using an explicit generalised Riemann problem and diffusive fluxes evaluated by an implicit centred-differencing procedure (wall temperature set at
$1.3\,\%\pm 0.5\,\%$
greater than using Sutherland’s law). The numerical procedure is formulated as a second-order accurate ‘convection–diffusion-split’ axisymmetric Navier–Stokes code with convective fluxes solved using an explicit generalised Riemann problem and diffusive fluxes evaluated by an implicit centred-differencing procedure (wall temperature set at
 $T_{w}$
). The turbulent boundary layer over the tunnel nozzle results in a relatively high-disturbance free-stream environment in comparison to that attainable in quiet hypersonic facilities (Schneider Reference Schneider2008).
$T_{w}$
). The turbulent boundary layer over the tunnel nozzle results in a relatively high-disturbance free-stream environment in comparison to that attainable in quiet hypersonic facilities (Schneider Reference Schneider2008).
The test region comprises the cylindrical afterbody and flare, respectively of diameter
 $D=75$
mm and deflection angle
$D=75$
mm and deflection angle
 $\unicode[STIX]{x1D6FF}=8^{\circ }$
; the cylindrical section and flare start at 103 mm and 212 mm from nose, i.e. with the latter corresponding to the corner location
$\unicode[STIX]{x1D6FF}=8^{\circ }$
; the cylindrical section and flare start at 103 mm and 212 mm from nose, i.e. with the latter corresponding to the corner location
 $x_{c}$
. This arrangement produces a laminar separation of length
$x_{c}$
. This arrangement produces a laminar separation of length
 $L=23$
mm, fully established within
$L=23$
mm, fully established within
 ${<}$
1 ms from the start of the 6 ms test window. The separation and reattachment locations, defined from laminar CFD at
${<}$
1 ms from the start of the 6 ms test window. The separation and reattachment locations, defined from laminar CFD at
 $C_{f}=0$
(zero skin friction coefficient), are equally spaced at
$C_{f}=0$
(zero skin friction coefficient), are equally spaced at
 $x_{S}/L=-0.5$
and
$x_{S}/L=-0.5$
and
 $x_{R}/L=0.5$
from the cylinder/flare junction (where
$x_{R}/L=0.5$
from the cylinder/flare junction (where
 $x_{c}$
is
$x_{c}$
is
 $x/L=0$
) and the roughness element is located at
$x/L=0$
) and the roughness element is located at
 $x_{k}=-1.74L$
upstream of it, with element height adjusted between runs. Further reference values related to the base flow are given in table 1.
$x_{k}=-1.74L$
upstream of it, with element height adjusted between runs. Further reference values related to the base flow are given in table 1.
Table 2. Flow conditions at roughness element location
 $x_{k}$
: Mach number at boundary layer edge
$x_{k}$
: Mach number at boundary layer edge
 $M_{ek}$
, unit Reynolds number at boundary layer edge
$M_{ek}$
, unit Reynolds number at boundary layer edge
 $Re_{ek}$
, temperature at boundary layer edge
$Re_{ek}$
, temperature at boundary layer edge
 $T_{ek}$
, undisturbed laminar heat transfer
$T_{ek}$
, undisturbed laminar heat transfer
 $q_{L}$
and boundary layer thickness, displacement thickness and momentum thickness
$q_{L}$
and boundary layer thickness, displacement thickness and momentum thickness
 $\unicode[STIX]{x1D6FF}_{k}$
,
$\unicode[STIX]{x1D6FF}_{k}$
,
 $\unicode[STIX]{x1D6FF}_{k}^{\ast }$
and
$\unicode[STIX]{x1D6FF}_{k}^{\ast }$
and
 $\unicode[STIX]{x1D703}_{k}$
. Wall temperature
$\unicode[STIX]{x1D703}_{k}$
. Wall temperature
 $T_{w}=293~\text{K}\pm 1.5\,\%$
.
$T_{w}=293~\text{K}\pm 1.5\,\%$
.
Heat transfer measurements were obtained using thin-film platinum temperature gauges, painted onto Macor machinable ceramic substrate and fitted integral with the surface of the model, with separate modules for cylinder and flare. Sensors were spaced at 1 mm pitch in the axial direction (element size
 $\unicode[STIX]{x0394}x=0.1$
mm by
$\unicode[STIX]{x0394}x=0.1$
mm by
 $\unicode[STIX]{x0394}z=2$
mm) and covered the region between
$\unicode[STIX]{x0394}z=2$
mm) and covered the region between
 $-1.26\leqslant x_{meas}/L$
 ${\leqslant}1.39$
(
${\leqslant}1.39$
(
 $z=0$
). Noting the finite sensor width, measurements are thus deemed representative of the spanwise-averaged fluctuations within
$z=0$
). Noting the finite sensor width, measurements are thus deemed representative of the spanwise-averaged fluctuations within
 $\pm 0.5l_{k}$
from wake centreline for a given axial location. The signals were amplified and low-pass filtered at 50 kHz before being digitised by a 24-bit analogue-to-digital converter at a sample rate of
$\pm 0.5l_{k}$
from wake centreline for a given axial location. The signals were amplified and low-pass filtered at 50 kHz before being digitised by a 24-bit analogue-to-digital converter at a sample rate of
 $100~\text{kS}~\text{s}^{-1}$
. The experimental error in heat transfer is
$100~\text{kS}~\text{s}^{-1}$
. The experimental error in heat transfer is
 $\pm 10\,\%$
, including a
$\pm 10\,\%$
, including a
 $\pm 5\,\%$
uncertainty in the substrate thermal properties, a
$\pm 5\,\%$
uncertainty in the substrate thermal properties, a
 $\pm 1\,\%$
uncertainty related to the thin-film thermo-resistive properties, and a
$\pm 1\,\%$
uncertainty related to the thin-film thermo-resistive properties, and a
 $\pm 4\,\%$
uncertainty regarding calibration of the gauges, signal conditioning and spatial resolution. Unsteady data is restricted by the short duration of the facility and limited to 512 data points per run (starting at 10.88 ms from tunnel start). Repeat runs were carried out for all cases to ensure repeatability and roughness height was systematically monitored to be well within
$\pm 4\,\%$
uncertainty regarding calibration of the gauges, signal conditioning and spatial resolution. Unsteady data is restricted by the short duration of the facility and limited to 512 data points per run (starting at 10.88 ms from tunnel start). Repeat runs were carried out for all cases to ensure repeatability and roughness height was systematically monitored to be well within
 $\pm 5~\unicode[STIX]{x03BC}\text{m}$
accuracy. The edge Mach and Reynolds numbers of the undisturbed laminar boundary layer at the roughness location were
$\pm 5~\unicode[STIX]{x03BC}\text{m}$
accuracy. The edge Mach and Reynolds numbers of the undisturbed laminar boundary layer at the roughness location were
 $M_{e,k}=3.44$
and
$M_{e,k}=3.44$
and
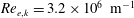 $Re_{e,k}=3.2\times 10^{6}~\text{m}^{-1}$
, and boundary layer thickness
$Re_{e,k}=3.2\times 10^{6}~\text{m}^{-1}$
, and boundary layer thickness
 $\unicode[STIX]{x1D6FF}_{k}=1.75$
mm. Other relevant values at the location of the roughness element are listed in table 2.
$\unicode[STIX]{x1D6FF}_{k}=1.75$
mm. Other relevant values at the location of the roughness element are listed in table 2.

Figure 2. Undisturbed boundary layer profiles at roughness element location: (a) temperature ratio
 $(T-T_{w})/(T_{o,e}-T_{w})$
(red) and Mach number
$(T-T_{w})/(T_{o,e}-T_{w})$
(red) and Mach number
 $M$
(green) profiles and (b) kinematic viscosity
$M$
(green) profiles and (b) kinematic viscosity
 $\unicode[STIX]{x1D708}$
(red) and shear stress
$\unicode[STIX]{x1D708}$
(red) and shear stress
 $\unicode[STIX]{x1D70F}$
(green). Laminar CFD (Fiala et al.
Reference Fiala, Hillier and Estruch-Samper2014).
$\unicode[STIX]{x1D70F}$
(green). Laminar CFD (Fiala et al.
Reference Fiala, Hillier and Estruch-Samper2014).
Profiles of the undisturbed laminar boundary layer at roughness location
 $x_{k}$
are presented in figure 2, for: the temperature ratio
$x_{k}$
are presented in figure 2, for: the temperature ratio
 $(T-T_{w})/(T_{o,e}-T_{w})$
, Mach number
$(T-T_{w})/(T_{o,e}-T_{w})$
, Mach number
 $M$
, kinematic viscosity
$M$
, kinematic viscosity
 $\unicode[STIX]{x1D708}$
and shear stress
$\unicode[STIX]{x1D708}$
and shear stress
 $\unicode[STIX]{x1D70F}$
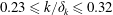
. The temperature profile in figure 2(a) exhibits a local peak characteristic of cold-wall high-speed boundary layers, in this instance at a height of
$\unicode[STIX]{x1D70F}$
. The temperature profile in figure 2(a) exhibits a local peak characteristic of cold-wall high-speed boundary layers, in this instance at a height of
 $0.23\unicode[STIX]{x1D6FF}_{k}$
from the wall (
$0.23\unicode[STIX]{x1D6FF}_{k}$
from the wall (
 $0.8\unicode[STIX]{x1D6FF}_{k}^{\ast }$
). Kinematic viscosity exhibits a similar profile given its direct dependence on temperature (figure 2
b). Complete details on the basic test flow over the blunt-cylinder body without the flare and on the numerical methodology can be found in Fiala et al. (Reference Fiala, Hillier, Mallinson and Wijensinghe2006) and Fiala et al. (Reference Fiala, Hillier and Estruch-Samper2014).
$0.8\unicode[STIX]{x1D6FF}_{k}^{\ast }$
). Kinematic viscosity exhibits a similar profile given its direct dependence on temperature (figure 2
b). Complete details on the basic test flow over the blunt-cylinder body without the flare and on the numerical methodology can be found in Fiala et al. (Reference Fiala, Hillier, Mallinson and Wijensinghe2006) and Fiala et al. (Reference Fiala, Hillier and Estruch-Samper2014).

Figure 3. Schlieren images of (a) laminar shock-wave/boundary-layer interaction with boundary layer separation and (b) fully turbulent interaction with attached boundary layer.
3 Results
As shown in the schlieren images in figure 3, the reference (undisturbed) laminar interaction is characterised by the presence of a separation and a reattachment shock while the roughness wake in the fully turbulent interaction results in a single shock attached to the corner (intrinsic to the present low-deflection ramp angle). The gradual transition from the laminar to the fully turbulent state as roughness height is increased is captured in the plots of average heat transfer in figure 4, which correspond to the diamond element cases for the complete range of heights investigated (
 $0.03\leqslant k/\unicode[STIX]{x1D6FF}_{k}\leqslant 1.71$
). The figures also include the experimental and numerical fully laminar trends for reference.
$0.03\leqslant k/\unicode[STIX]{x1D6FF}_{k}\leqslant 1.71$
). The figures also include the experimental and numerical fully laminar trends for reference.
With an element height of
 $k/\unicode[STIX]{x1D6FF}_{k}=0.03$
(figure 4
a), the mean heat transfer
$k/\unicode[STIX]{x1D6FF}_{k}=0.03$
(figure 4
a), the mean heat transfer
 $q$
along the interaction remains practically undisturbed and exhibits a reduction characteristic of laminar separation but with a slight overshoot as the element wake starts transitioning upon reaching the corner. For
$q$
along the interaction remains practically undisturbed and exhibits a reduction characteristic of laminar separation but with a slight overshoot as the element wake starts transitioning upon reaching the corner. For
 $k/\unicode[STIX]{x1D6FF}_{k}=0.06$
, 0.09 and 0.12 (figure 4
a),
$k/\unicode[STIX]{x1D6FF}_{k}=0.06$
, 0.09 and 0.12 (figure 4
a),
 $q$
overshoots progressively at a higher rate over the ramp as roughness-induced disturbances gain strength with increasing height. A similar effect is also observed for the
$q$
overshoots progressively at a higher rate over the ramp as roughness-induced disturbances gain strength with increasing height. A similar effect is also observed for the
 $k/\unicode[STIX]{x1D6FF}_{k}=0.15$
element (figure 4
b), and a subsequent increase in height to
$k/\unicode[STIX]{x1D6FF}_{k}=0.15$
element (figure 4
b), and a subsequent increase in height to
 $k/\unicode[STIX]{x1D6FF}_{k}=0.17$
then leads to disturbances gaining sufficient strength so as to alter the laminar separation upstream of the flare and rise towards the turbulent state. For the present purposes (noting the influence of the corner flow), the
$k/\unicode[STIX]{x1D6FF}_{k}=0.17$
then leads to disturbances gaining sufficient strength so as to alter the laminar separation upstream of the flare and rise towards the turbulent state. For the present purposes (noting the influence of the corner flow), the
 $k/\unicode[STIX]{x1D6FF}_{k}=0.15$
case is hence identified as the critical roughness condition. As roughness height is further increased to
$k/\unicode[STIX]{x1D6FF}_{k}=0.15$
case is hence identified as the critical roughness condition. As roughness height is further increased to
 $k/\unicode[STIX]{x1D6FF}_{k}=0.20$
and 0.23, transition onset continues to shift closer to the element. The mean level upstream of the interaction is thus gradually elevated and leads to an offset of the separation trend ahead of the corner; these effects are consistent with observations in the aforementioned numerical studies which described the mechanisms of disturbance near-wall penetration and breakdown as common features associated to the onset of transition. In Choudhari et al. (Reference Choudhari, LI, Chang and Edwards2009), a nearly monotonic decay in the amplitude of subcritical stationary streaks was also shown to amplify across the compression corner and enhance the growth of non-stationary instabilities. As per their findings, the concave streamline curvature near the corner is believed to also contribute to the reinforcement of streak amplitudes and to have a destabilising influence.
$k/\unicode[STIX]{x1D6FF}_{k}=0.20$
and 0.23, transition onset continues to shift closer to the element. The mean level upstream of the interaction is thus gradually elevated and leads to an offset of the separation trend ahead of the corner; these effects are consistent with observations in the aforementioned numerical studies which described the mechanisms of disturbance near-wall penetration and breakdown as common features associated to the onset of transition. In Choudhari et al. (Reference Choudhari, LI, Chang and Edwards2009), a nearly monotonic decay in the amplitude of subcritical stationary streaks was also shown to amplify across the compression corner and enhance the growth of non-stationary instabilities. As per their findings, the concave streamline curvature near the corner is believed to also contribute to the reinforcement of streak amplitudes and to have a destabilising influence.

Figure 4. Time-averaged axial heat transfer distributions for different diamond roughness element heights: (a)
 $k/\unicode[STIX]{x1D6FF}_{k}=0.03$
, 0.06, 0.09, 0.12; (b)
$k/\unicode[STIX]{x1D6FF}_{k}=0.03$
, 0.06, 0.09, 0.12; (b)
 $k/\unicode[STIX]{x1D6FF}_{k}=0.15$
, 0.17, 0.20, 0.23; (c)
$k/\unicode[STIX]{x1D6FF}_{k}=0.15$
, 0.17, 0.20, 0.23; (c)
 $k/\unicode[STIX]{x1D6FF}_{k}=0.26$
, 0.29, 0.32, 0.35; (d)
$k/\unicode[STIX]{x1D6FF}_{k}=0.26$
, 0.29, 0.32, 0.35; (d)
 $k/\unicode[STIX]{x1D6FF}_{k}=0.38$
, 0.41, 0.44, 0.47; (e)
$k/\unicode[STIX]{x1D6FF}_{k}=0.38$
, 0.41, 0.44, 0.47; (e)
 $k/\unicode[STIX]{x1D6FF}_{k}=0.52$
, 0.58, 0.69, 0.80; (f)
$k/\unicode[STIX]{x1D6FF}_{k}=0.52$
, 0.58, 0.69, 0.80; (f)
 $k/\unicode[STIX]{x1D6FF}_{k}=1.03$
, 1.26, 1.49, 1.71. From lower to higher
$k/\unicode[STIX]{x1D6FF}_{k}=1.03$
, 1.26, 1.49, 1.71. From lower to higher
 $k/\unicode[STIX]{x1D6FF}_{k}$
for each subfigure: grey ○, blue ♢, green △ and red ◻ . Reference fully laminar results (
$k/\unicode[STIX]{x1D6FF}_{k}$
for each subfigure: grey ○, blue ♢, green △ and red ◻ . Reference fully laminar results (
 $k/\unicode[STIX]{x1D6FF}_{k}=0$
) are indicated as black ♢ in each plot, along with the laminar CFD for the cases with and without the flare respectively as solid and dashed lines. Element location
$k/\unicode[STIX]{x1D6FF}_{k}=0$
) are indicated as black ♢ in each plot, along with the laminar CFD for the cases with and without the flare respectively as solid and dashed lines. Element location
 $x_{k}$
indicated as a small square for reference. Right axis indicates respective levels normalised by local laminar heating at roughness element location
$x_{k}$
indicated as a small square for reference. Right axis indicates respective levels normalised by local laminar heating at roughness element location
 $q/q_{L}$
(see table 2).
$q/q_{L}$
(see table 2).

Figure 5. Effect of isolated diamond roughness element height: (a) transition length from roughness trailing edge
 $x_{tr}$
as a function of
$x_{tr}$
as a function of
 $k/\unicode[STIX]{x1D6FF}_{k}$
compared with related studies in the literature and present heat transfer
$k/\unicode[STIX]{x1D6FF}_{k}$
compared with related studies in the literature and present heat transfer
 $q$
at
$q$
at
 $x/L=-0.1$
(close ahead of the corner), and (b) power spectral density
$x/L=-0.1$
(close ahead of the corner), and (b) power spectral density
 $G_{xx}$
based on heat transfer signal at
$G_{xx}$
based on heat transfer signal at
 $x/L=-1$
(freq. resolution
$x/L=-1$
(freq. resolution
 $\unicode[STIX]{x0394}f=0.78$
kHz) for cases
$\unicode[STIX]{x0394}f=0.78$
kHz) for cases
 $k/\unicode[STIX]{x1D6FF}_{k}=0$
(black),
$k/\unicode[STIX]{x1D6FF}_{k}=0$
(black),
 $k/\unicode[STIX]{x1D6FF}_{k}=0.23$
(blue),
$k/\unicode[STIX]{x1D6FF}_{k}=0.23$
(blue),
 $k/\unicode[STIX]{x1D6FF}_{k}=0.32$
(green) and
$k/\unicode[STIX]{x1D6FF}_{k}=0.32$
(green) and
 $k/\unicode[STIX]{x1D6FF}_{k}=1.0$
(red). Flow conditions in reference studies are:
$k/\unicode[STIX]{x1D6FF}_{k}=1.0$
(red). Flow conditions in reference studies are:
 $M_{\infty }=3.5$
,
$M_{\infty }=3.5$
,
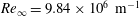 $Re_{\infty }=9.84\times 10^{6}~\text{m}^{-1}$
(CFD by Choudhari et al.
Reference Choudhari, Li, Chang, Norris and Edwards2013, flat plate) and
$Re_{\infty }=9.84\times 10^{6}~\text{m}^{-1}$
(CFD by Choudhari et al.
Reference Choudhari, Li, Chang, Norris and Edwards2013, flat plate) and
 $M_{\infty }=3.5$
,
$M_{\infty }=3.5$
,
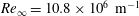 $Re_{\infty }=10.8\times 10^{6}~\text{m}^{-1}$
(experiments by Kegerise et al.
Reference Kegerise, King, Owens, Choudhari, Norris, Li and Chang2012, flat plate) both with
$Re_{\infty }=10.8\times 10^{6}~\text{m}^{-1}$
(experiments by Kegerise et al.
Reference Kegerise, King, Owens, Choudhari, Norris, Li and Chang2012, flat plate) both with
 $\unicode[STIX]{x1D6FF}_{k}=0.7\pm 0.01$
mm; and
$\unicode[STIX]{x1D6FF}_{k}=0.7\pm 0.01$
mm; and
 $M_{\infty }=6$
,
$M_{\infty }=6$
,
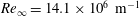 $Re_{\infty }=14.1\times 10^{6}~\text{m}^{-1}$
(experiments by Berry & Horvath Reference Berry and Horvath2008 on zero-incidence
$Re_{\infty }=14.1\times 10^{6}~\text{m}^{-1}$
(experiments by Berry & Horvath Reference Berry and Horvath2008 on zero-incidence
 $5^{\circ }$
sharp cone), with
$5^{\circ }$
sharp cone), with
 $\unicode[STIX]{x1D6FF}_{k}=0.4\pm 0.02$
mm. Dashed lines in the first figure assume extrapolation towards critical height conditions and eventual natural transition below that.
$\unicode[STIX]{x1D6FF}_{k}=0.4\pm 0.02$
mm. Dashed lines in the first figure assume extrapolation towards critical height conditions and eventual natural transition below that.
 $^{\ast }$
Noise levels in the latter study reported to fall between the indicated ‘noisy’ and ‘quiet’ thresholds.
$^{\ast }$
Noise levels in the latter study reported to fall between the indicated ‘noisy’ and ‘quiet’ thresholds.
As element height increases to
 $k/\unicode[STIX]{x1D6FF}_{k}=0.26$
, 0.29 and 0.32 (figure 4
c), the heat transfer rise across the corner becomes abrupt as the roughness wake reaches a fully turbulent state and the attached corner shock becomes established. The
$k/\unicode[STIX]{x1D6FF}_{k}=0.26$
, 0.29 and 0.32 (figure 4
c), the heat transfer rise across the corner becomes abrupt as the roughness wake reaches a fully turbulent state and the attached corner shock becomes established. The
 $k/\unicode[STIX]{x1D6FF}_{k}=0.32$
case shows early evidence of the monotonic decrease in fully turbulent heat transfer level over the flare and is identified as the effective condition. Further increases in element height, and up to
$k/\unicode[STIX]{x1D6FF}_{k}=0.32$
case shows early evidence of the monotonic decrease in fully turbulent heat transfer level over the flare and is identified as the effective condition. Further increases in element height, and up to
 $k/\unicode[STIX]{x1D6FF}_{k}\approx 0.5$
(figure 4
d), produce little change in the attached flow downstream of the corner but induce increased heating ahead of it. The heat transfer augmentation close to the element is further enhanced for heights up to the order of the boundary layer thickness
$k/\unicode[STIX]{x1D6FF}_{k}\approx 0.5$
(figure 4
d), produce little change in the attached flow downstream of the corner but induce increased heating ahead of it. The heat transfer augmentation close to the element is further enhanced for heights up to the order of the boundary layer thickness
 $0.5<k/\unicode[STIX]{x1D6FF}_{k}<1$
(figure 4
e), however, without significantly altering the downstream SBLI, which remains effectively at the turbulent attached condition. The local heating effects continue to be enhanced for taller elements (
$0.5<k/\unicode[STIX]{x1D6FF}_{k}<1$
(figure 4
e), however, without significantly altering the downstream SBLI, which remains effectively at the turbulent attached condition. The local heating effects continue to be enhanced for taller elements (
 $k/\unicode[STIX]{x1D6FF}_{k}>1$
) yet with minor influence on the downstream corner flow (figure 4
f).
$k/\unicode[STIX]{x1D6FF}_{k}>1$
) yet with minor influence on the downstream corner flow (figure 4
f).
Accordingly, in figure 5(a) the increase in roughness height is seen to lead to an upstream shift of the transition onset location
 $x_{tr}$
, defined here as distance from element trailing edge (with associated uncertainty below 5
$x_{tr}$
, defined here as distance from element trailing edge (with associated uncertainty below 5
 $\,\%$
) and to follow an inverse trend with respect to local heat transfer,
$\,\%$
) and to follow an inverse trend with respect to local heat transfer,
 $x_{tr}$
being thus deemed to correlate with
$x_{tr}$
being thus deemed to correlate with
 ${\sim}q^{-1}$
(e.g. here shown at a sample location
${\sim}q^{-1}$
(e.g. here shown at a sample location
 $x/L=-0.1$
and compared with previous studies; with reference values needed for further normalisation given in the figure caption and in tables 1 and 2). Below
$x/L=-0.1$
and compared with previous studies; with reference values needed for further normalisation given in the figure caption and in tables 1 and 2). Below
 $k/\unicode[STIX]{x1D6FF}_{k}=0.15$
,
$k/\unicode[STIX]{x1D6FF}_{k}=0.15$
,
 $x_{tr}$
is fixed at the corner due to the local destabilising effects and it is then shortened with increasing height, eventually asymptoting towards
$x_{tr}$
is fixed at the corner due to the local destabilising effects and it is then shortened with increasing height, eventually asymptoting towards
 $x_{tr}\approx 21\pm 1$
mm (
$x_{tr}\approx 21\pm 1$
mm (
 ${\sim}12\unicode[STIX]{x1D6FF}_{k}$
). The effective transition length is of a similar order as that found under ‘noisy’ (high-disturbance) environmental conditions in Kegerise et al. (Reference Kegerise, King, Owens, Choudhari, Norris, Li and Chang2012) and Choudhari et al. (Reference Choudhari, Li, Chang, Norris and Edwards2013). In their studies, the effective transition length induced by diamond elements was shown to be over 2.5 times longer under ‘quiet’ (low-noise) conditions, where the stability analysis of the element wake was based on N-factor calculations; the effect of environmental disturbance levels on
${\sim}12\unicode[STIX]{x1D6FF}_{k}$
). The effective transition length is of a similar order as that found under ‘noisy’ (high-disturbance) environmental conditions in Kegerise et al. (Reference Kegerise, King, Owens, Choudhari, Norris, Li and Chang2012) and Choudhari et al. (Reference Choudhari, Li, Chang, Norris and Edwards2013). In their studies, the effective transition length induced by diamond elements was shown to be over 2.5 times longer under ‘quiet’ (low-noise) conditions, where the stability analysis of the element wake was based on N-factor calculations; the effect of environmental disturbance levels on
 $x_{tr}$
was further found to lead to even greater differences between ‘quiet’ and ‘noisy’ conditions for shorter elements, with the breakdown of the dominant modes associated to transition onset exhibiting a strongly nonlinear dependence on roughness height. The results by Berry & Horvath (Reference Berry and Horvath2008) on a
$x_{tr}$
was further found to lead to even greater differences between ‘quiet’ and ‘noisy’ conditions for shorter elements, with the breakdown of the dominant modes associated to transition onset exhibiting a strongly nonlinear dependence on roughness height. The results by Berry & Horvath (Reference Berry and Horvath2008) on a
 $5^{\circ }$
sharp cone – in great part relying on surface heat transfer – also reported some degree of nonlinearity in transition length as a function of roughness height. Nonetheless, following an extensive parametric analysis, a substantial effective transition dataset was shown to still correlate as
$5^{\circ }$
sharp cone – in great part relying on surface heat transfer – also reported some degree of nonlinearity in transition length as a function of roughness height. Nonetheless, following an extensive parametric analysis, a substantial effective transition dataset was shown to still correlate as
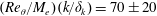 $(Re_{\unicode[STIX]{x1D703}}/M_{e})(k/\unicode[STIX]{x1D6FF}_{k})=70\pm 20$
% – so that the assumption of linear height effect could be found plausible with sufficient error margins by accounting for the more immediate effects of Reynolds number (based on displacement thickness
$(Re_{\unicode[STIX]{x1D703}}/M_{e})(k/\unicode[STIX]{x1D6FF}_{k})=70\pm 20$
% – so that the assumption of linear height effect could be found plausible with sufficient error margins by accounting for the more immediate effects of Reynolds number (based on displacement thickness
 $Re_{\unicode[STIX]{x1D703}}$
) and edge Mach number
$Re_{\unicode[STIX]{x1D703}}$
) and edge Mach number
 $M_{e}$
. It may then be noted that the different effective conditions in the reference studies, in comparison to the present case, are in part related to pertinent variations in the parameters above.
$M_{e}$
. It may then be noted that the different effective conditions in the reference studies, in comparison to the present case, are in part related to pertinent variations in the parameters above.
As a sensitive measure of practical impact, we thus discuss the effects on heat transfer. The respective power spectra in figure 5(b) (again shown for
 $q$
at
$q$
at
 $x/L=-0.1$
) exhibit a broadband distribution without clear dominant frequencies and at levels above the undisturbed laminar state. The spectra remain similar at the effective height
$x/L=-0.1$
) exhibit a broadband distribution without clear dominant frequencies and at levels above the undisturbed laminar state. The spectra remain similar at the effective height
 $k/\unicode[STIX]{x1D6FF}_{k}=0.32$
and above (e.g. here shown for
$k/\unicode[STIX]{x1D6FF}_{k}=0.32$
and above (e.g. here shown for
 $k/\unicode[STIX]{x1D6FF}_{k}=1$
) with a slight enhancement in the lower and upper frequency ranges found with
$k/\unicode[STIX]{x1D6FF}_{k}=1$
) with a slight enhancement in the lower and upper frequency ranges found with
 $k/\unicode[STIX]{x1D6FF}_{k}=0.23$
. The present bandwidth, with upper bound considered safely reliable up to at least
$k/\unicode[STIX]{x1D6FF}_{k}=0.23$
. The present bandwidth, with upper bound considered safely reliable up to at least
 $f_{max}=42$
kHz (corresponding to a Strouhal number
$f_{max}=42$
kHz (corresponding to a Strouhal number
 $S_{\unicode[STIX]{x1D6FF}}=f_{max}\unicode[STIX]{x1D6FF}_{k}/U_{e}$
of approximately 0.057, where edge velocity is
$S_{\unicode[STIX]{x1D6FF}}=f_{max}\unicode[STIX]{x1D6FF}_{k}/U_{e}$
of approximately 0.057, where edge velocity is
 $U_{e}=1295~\text{m}~\text{s}^{-1}$
), however proves insufficient to capture dominant frequencies characteristic of the transitional wake as well as to enabling a broader stability analysis for frequencies in excess of this threshold.
$U_{e}=1295~\text{m}~\text{s}^{-1}$
), however proves insufficient to capture dominant frequencies characteristic of the transitional wake as well as to enabling a broader stability analysis for frequencies in excess of this threshold.

Figure 6. Normalised standard deviation
 $\unicode[STIX]{x1D70E}_{q}/q$
contours in the (
$\unicode[STIX]{x1D70E}_{q}/q$
contours in the (
 $x,k$
)-plane for (a) diamond roughness element and (b) square roughness element, and corresponding profile over
$x,k$
)-plane for (a) diamond roughness element and (b) square roughness element, and corresponding profile over
 $k/\unicode[STIX]{x1D6FF}_{k}=0.03{-}1.71$
range for axial locations
$k/\unicode[STIX]{x1D6FF}_{k}=0.03{-}1.71$
range for axial locations
 $x/L=-1.0$
(black ○),
$x/L=-1.0$
(black ○),
 $x/L=-0.1$
(blue ♢),
$x/L=-0.1$
(blue ♢),
 $x/L=+0.1$
(green △ ),
$x/L=+0.1$
(green △ ),
 $x/L=+1.0$
(red ◻ ) respectively for (c) diamond roughness element and (d) square roughness element, with corresponding schlieren for
$x/L=+1.0$
(red ◻ ) respectively for (c) diamond roughness element and (d) square roughness element, with corresponding schlieren for
 $k/\unicode[STIX]{x1D6FF}_{k}=1$
cases. Horizontal and vertical dashed lines respectively mark effective height and
$k/\unicode[STIX]{x1D6FF}_{k}=1$
cases. Horizontal and vertical dashed lines respectively mark effective height and
 $\unicode[STIX]{x1D70E}_{q}/q=0.1$
. Schematics indicate test geometry for reference.
$\unicode[STIX]{x1D70E}_{q}/q=0.1$
. Schematics indicate test geometry for reference.
Alternatively, we thus refer to the contour maps in figure 6(a,b), which summarise the normalised standard deviation
 $\unicode[STIX]{x1D70E}_{q}/q$
over the interaction length for both the diamond and square arrangements and for the complete range of heights. The effective height,
$\unicode[STIX]{x1D70E}_{q}/q$
over the interaction length for both the diamond and square arrangements and for the complete range of heights. The effective height,
 $(k/\unicode[STIX]{x1D6FF}_{k})_{eff}=0.32$
, presents a clear threshold above which the turbulent wake remains fully attached and induces a rapid rise in heat transfer at the corner. The respective profiles in figure 6(c,d) show that
$(k/\unicode[STIX]{x1D6FF}_{k})_{eff}=0.32$
, presents a clear threshold above which the turbulent wake remains fully attached and induces a rapid rise in heat transfer at the corner. The respective profiles in figure 6(c,d) show that
 $\unicode[STIX]{x1D70E}_{q}/q$
remains below
$\unicode[STIX]{x1D70E}_{q}/q$
remains below
 ${<}0.1$
above this height for both the diamond and square cases, i.e.
${<}0.1$
above this height for both the diamond and square cases, i.e.
 $(k/\unicode[STIX]{x1D6FF}_{k})_{eff}$
is practically common to both – within the
$(k/\unicode[STIX]{x1D6FF}_{k})_{eff}$
is practically common to both – within the
 $\pm \unicode[STIX]{x0394}(k/\unicode[STIX]{x1D6FF}_{k})=0.03$
resolution. In the sample schlieren images for the respective
$\pm \unicode[STIX]{x0394}(k/\unicode[STIX]{x1D6FF}_{k})=0.03$
resolution. In the sample schlieren images for the respective
 $(k/\unicode[STIX]{x1D6FF}_{k})=1$
cases, the corner shock is seen to remain attached at the corner
$(k/\unicode[STIX]{x1D6FF}_{k})=1$
cases, the corner shock is seen to remain attached at the corner
 $x_{c}$
and two further oblique shocks are induced near the roughness element. For the diamond, the foremost shock appears attached to the element’s leading edge and the downstream shock has its origin at a location close behind the element. For the square, a local upstream separation of length
$x_{c}$
and two further oblique shocks are induced near the roughness element. For the diamond, the foremost shock appears attached to the element’s leading edge and the downstream shock has its origin at a location close behind the element. For the square, a local upstream separation of length
 ${\sim}5\unicode[STIX]{x1D6FF}_{k}$
can be seen and the downstream shock appears relatively weaker.
${\sim}5\unicode[STIX]{x1D6FF}_{k}$
can be seen and the downstream shock appears relatively weaker.

Figure 7. Normalised heat transfer
 $q/q_{L}$
contours in the (
$q/q_{L}$
contours in the (
 $x,k$
)-plane for (a) diamond roughness element and (b) square roughness element, and corresponding profile over
$x,k$
)-plane for (a) diamond roughness element and (b) square roughness element, and corresponding profile over
 $k/\unicode[STIX]{x1D6FF}_{k}=0.03$
–1.71 range for axial locations
$k/\unicode[STIX]{x1D6FF}_{k}=0.03$
–1.71 range for axial locations
 $x/L=-1.0$
(black ○),
$x/L=-1.0$
(black ○),
 $x/L=-0.1$
(blue ♢),
$x/L=-0.1$
(blue ♢),
 $x/L=+0.1$
(green △ ),
$x/L=+0.1$
(green △ ),
 $x/L=+1.0$
(red ◻ ) respectively for (c) diamond roughness element and (d) square roughness element. Regions below and exceeding
$x/L=+1.0$
(red ◻ ) respectively for (c) diamond roughness element and (d) square roughness element. Regions below and exceeding
 $q/q_{L}$
contour levels are respectively delimited with white and black lines. Horizontal dashed line marks effective height. Schematics indicate test geometry for reference.
$q/q_{L}$
contour levels are respectively delimited with white and black lines. Horizontal dashed line marks effective height. Schematics indicate test geometry for reference.
The effects of roughness height for the diamond and square arrangements are further summarised in the form of
 $q/q_{L}$
contour maps in figure 7(a,b). The heat transfer amplification close behind the element (with respect to
$q/q_{L}$
contour maps in figure 7(a,b). The heat transfer amplification close behind the element (with respect to
 $q_{L}$
) is significantly enhanced for the diamond cases (figure 7
a). In contrast, for the square configuration, the local heating effects within the region downstream of the element are relatively weaker (figure 7
b), in this instance with only a slight amplification found for elements taller than the boundary layer thickness
$q_{L}$
) is significantly enhanced for the diamond cases (figure 7
a). In contrast, for the square configuration, the local heating effects within the region downstream of the element are relatively weaker (figure 7
b), in this instance with only a slight amplification found for elements taller than the boundary layer thickness
 $k/\unicode[STIX]{x1D6FF}_{k}>1$
(cf.
$k/\unicode[STIX]{x1D6FF}_{k}>1$
(cf.
 $k/\unicode[STIX]{x1D6FF}_{k}>0.5$
for the diamond). The corresponding heat transfer profiles in figures 7(c) and 7(d) offer further insight into the effect of element height. As more clearly seen from its subsequent enhancement downstream of the interaction (
$k/\unicode[STIX]{x1D6FF}_{k}>0.5$
for the diamond). The corresponding heat transfer profiles in figures 7(c) and 7(d) offer further insight into the effect of element height. As more clearly seen from its subsequent enhancement downstream of the interaction (
 $x/L=1.0$
), an effectively linear increase in
$x/L=1.0$
), an effectively linear increase in
 $q/q_{L}$
levels with roughness height is documented in both cases below subcritical conditions (
$q/q_{L}$
levels with roughness height is documented in both cases below subcritical conditions (
 $k/\unicode[STIX]{x1D6FF}_{k}\leqslant 0.15$
). Heat transfer levels continue to increase with height between
$k/\unicode[STIX]{x1D6FF}_{k}\leqslant 0.15$
). Heat transfer levels continue to increase with height between
 $k/\unicode[STIX]{x1D6FF}_{k}=0.15$
and
$k/\unicode[STIX]{x1D6FF}_{k}=0.15$
and
 $k/\unicode[STIX]{x1D6FF}_{k}=0.23$
(see
$k/\unicode[STIX]{x1D6FF}_{k}=0.23$
(see
 $x/L=-1.0$
,
$x/L=-1.0$
,
 $-0.1$
and 0.1). For the square, the surface heat transfer is found to increase with element height and to then reverse its trend between 0.23
$-0.1$
and 0.1). For the square, the surface heat transfer is found to increase with element height and to then reverse its trend between 0.23
 ${\leqslant}k/\unicode[STIX]{x1D6FF}_{k}\leqslant 0.32$
. The peak is interpreted as indicative of a reversal in the effect of roughness height on roughness-induced disturbance levels between
${\leqslant}k/\unicode[STIX]{x1D6FF}_{k}\leqslant 0.32$
. The peak is interpreted as indicative of a reversal in the effect of roughness height on roughness-induced disturbance levels between
 $k/\unicode[STIX]{x1D6FF}_{k}=0.23$
and effective conditions (
$k/\unicode[STIX]{x1D6FF}_{k}=0.23$
and effective conditions (
 $k/\unicode[STIX]{x1D6FF}_{k}=0.32$
). The reversal is more clearly evidenced from the heat transfer trends downstream of the element (
$k/\unicode[STIX]{x1D6FF}_{k}=0.32$
). The reversal is more clearly evidenced from the heat transfer trends downstream of the element (
 $x/L=-1$
) and close ahead of the corner (
$x/L=-1$
) and close ahead of the corner (
 $x/L=-0.1$
), with heat transfer levels consistently decreasing across cases
$x/L=-0.1$
), with heat transfer levels consistently decreasing across cases
 $k/\unicode[STIX]{x1D6FF}_{k}=0.23$
, 0.26, 0.29 and 0.32. Above
$k/\unicode[STIX]{x1D6FF}_{k}=0.23$
, 0.26, 0.29 and 0.32. Above
 $k/\unicode[STIX]{x1D6FF}_{k}\geqslant 0.58$
, the flow remains insensitive to further increases in element height independently of the increasing strength in the local effects in the vicinity of tall elements. The trend reversal between 0.23
$k/\unicode[STIX]{x1D6FF}_{k}\geqslant 0.58$
, the flow remains insensitive to further increases in element height independently of the increasing strength in the local effects in the vicinity of tall elements. The trend reversal between 0.23
 ${\leqslant}k/\unicode[STIX]{x1D6FF}_{k}\leqslant 0.32$
therefore coincides with the peak at
${\leqslant}k/\unicode[STIX]{x1D6FF}_{k}\leqslant 0.32$
therefore coincides with the peak at
 $y/\unicode[STIX]{x1D6FF}_{k}=0.23$
within the incoming laminar boundary layer profile. With reference to figure 2(a,b), this range corresponds to locations within the supersonic portion of the boundary layer, where the Mach number increases from
$y/\unicode[STIX]{x1D6FF}_{k}=0.23$
within the incoming laminar boundary layer profile. With reference to figure 2(a,b), this range corresponds to locations within the supersonic portion of the boundary layer, where the Mach number increases from
 $M_{k}=1.52$
to 1.96 (
$M_{k}=1.52$
to 1.96 (
 $M_{k}/M_{e}=0.44$
to 0.57). Farther downstream over the ramp (
$M_{k}/M_{e}=0.44$
to 0.57). Farther downstream over the ramp (
 $x/L=1.0$
), the heat transfer reaches a similar level of order
$x/L=1.0$
), the heat transfer reaches a similar level of order
 ${\sim}10q_{L}$
for both configurations once the element wake has attained a fully turbulent state – where
${\sim}10q_{L}$
for both configurations once the element wake has attained a fully turbulent state – where
 $\unicode[STIX]{x1D70E}_{q}/q<0.1$
, as the heat transfer signal no longer oscillates between the base laminar and turbulent levels (figure 4), and the shock remains attached at the corner.
$\unicode[STIX]{x1D70E}_{q}/q<0.1$
, as the heat transfer signal no longer oscillates between the base laminar and turbulent levels (figure 4), and the shock remains attached at the corner.
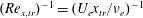
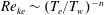
For further reference, the undisturbed laminar flow conditions at the roughness element location
 $x_{k}$
and for the different reference heights are presented in table 3. The table includes some of the commonly used reference parameters in high-speed transition studies: (i) roughness Reynolds number with all values evaluated at roughness height
$x_{k}$
and for the different reference heights are presented in table 3. The table includes some of the commonly used reference parameters in high-speed transition studies: (i) roughness Reynolds number with all values evaluated at roughness height
 $Re_{kk}=U_{k}k/\unicode[STIX]{x1D708}_{k}$
, (ii) a similar definition but with flow properties evaluated at boundary layer edge
$Re_{kk}=U_{k}k/\unicode[STIX]{x1D708}_{k}$
, (ii) a similar definition but with flow properties evaluated at boundary layer edge
 $Re_{ke}=U_{e}k/\unicode[STIX]{x1D708}_{e}$
, (iii) Reynolds number with kinematic viscosity and velocity evaluated at roughness height and with boundary layer thickness as length scale
$Re_{ke}=U_{e}k/\unicode[STIX]{x1D708}_{e}$
, (iii) Reynolds number with kinematic viscosity and velocity evaluated at roughness height and with boundary layer thickness as length scale
 $Re_{\unicode[STIX]{x1D6FF},k}=U_{k}\unicode[STIX]{x1D6FF}_{k}/\unicode[STIX]{x1D708}_{k}$
, often using displacement
$Re_{\unicode[STIX]{x1D6FF},k}=U_{k}\unicode[STIX]{x1D6FF}_{k}/\unicode[STIX]{x1D708}_{k}$
, often using displacement
 $\unicode[STIX]{x1D6FF}_{k}^{\ast }$
or momentum thickness
$\unicode[STIX]{x1D6FF}_{k}^{\ast }$
or momentum thickness
 $\unicode[STIX]{x1D703}_{k}$
as alternatives, and (iv) the Reynolds to Mach number ratio with reference conditions at roughness height,
$\unicode[STIX]{x1D703}_{k}$
as alternatives, and (iv) the Reynolds to Mach number ratio with reference conditions at roughness height,
 $Re_{\unicode[STIX]{x1D6FF},k}/M_{k}$
, where
$Re_{\unicode[STIX]{x1D6FF},k}/M_{k}$
, where
 $M_{k}=U_{k}/\sqrt{\unicode[STIX]{x1D6FE}RT_{k}}$
. Recent numerical studies have also proposed mixed roughness Reynolds number definitions with both density and viscosity evaluated at the wall instead of at roughness height,
$M_{k}=U_{k}/\sqrt{\unicode[STIX]{x1D6FE}RT_{k}}$
. Recent numerical studies have also proposed mixed roughness Reynolds number definitions with both density and viscosity evaluated at the wall instead of at roughness height,
 $\unicode[STIX]{x1D70C}_{w}U_{k}k/\unicode[STIX]{x1D707}_{w}$
(Bernardini, Pirozzoli & Orlandi Reference Bernardini, Pirozzoli and Orlandi2012). As per the review in Schneider (Reference Schneider2008), the first parameter (
$\unicode[STIX]{x1D70C}_{w}U_{k}k/\unicode[STIX]{x1D707}_{w}$
(Bernardini, Pirozzoli & Orlandi Reference Bernardini, Pirozzoli and Orlandi2012). As per the review in Schneider (Reference Schneider2008), the first parameter (
 $Re_{kk}$
) is more widely used in high-speed transition studies while
$Re_{kk}$
) is more widely used in high-speed transition studies while
 $Re_{ke}$
and
$Re_{ke}$
and
 $Re_{\unicode[STIX]{x1D6FF},k}$
, which avoid the calculation of conditions at roughness height, are also proven useful through real flight correlations (Reshotko and Tumin Reference Reshotko and Tumin2004). The complex nature of such flows and sensitivity to a wide array of variables renders these simpler parameters, and variances such as
$Re_{\unicode[STIX]{x1D6FF},k}$
, which avoid the calculation of conditions at roughness height, are also proven useful through real flight correlations (Reshotko and Tumin Reference Reshotko and Tumin2004). The complex nature of such flows and sensitivity to a wide array of variables renders these simpler parameters, and variances such as
 $Re_{\unicode[STIX]{x1D703},e}/M_{e}$
, practical for atmospheric re-entry analysis given the overwhelming effect of density variations with altitude, yet subject to limited physical interpretation (Reda Reference Reda2002; Reshotko Reference Reshotko2007).
$Re_{\unicode[STIX]{x1D703},e}/M_{e}$
, practical for atmospheric re-entry analysis given the overwhelming effect of density variations with altitude, yet subject to limited physical interpretation (Reda Reference Reda2002; Reshotko Reference Reshotko2007).
Table 3. Flow properties at reference conditions ranging from wall to boundary layer edge.

Reference to flow properties at roughness height thus appears relevant to different degrees in the characterisation of roughness-induced transition as a function of the local flow topology, and hence of roughness element geometry. As shown in the schematic in figure 8(a), the more slender geometry of diamond elements reduces the extent of local separation near the roughness element and induces enhanced spanwise gradients, in turn leading to increased local heating effects (e.g. Choudhari et al. Reference Choudhari, Li, Chang, Norris and Edwards2013). On the other hand, for square elements (figure 8 b), the local separation effects induced by the blunt geometry are relatively stronger and often result in an upstream horseshoe vortex which convects further downstream (e.g. De Tullio et al. Reference De Tullio, Paredes, Sandham and Theofilis2013), with the actual topology often being highly complex (note only some of the most distinctive features are highlighted here). While sharp obstacles such as the diamond element would be expected to induce significantly higher local vorticity due to enhanced lateral mixing, upstream separation effects for short blunt elements (e.g. square case) may exhibit strong upstream feedback (Estruch-Samper Reference Estruch-Samper2016) and be dominated by local shear effects which are bound to influence the roughness-induced transition phenomenon.

Figure 8. Characteristic flow topology for (a) diamond and (b) square roughness elements (simplified to highlight relevant features), and plots of
 $Re_{\unicode[STIX]{x1D6FF}_{k},k}=U_{k}\unicode[STIX]{x1D6FF}_{k}/\unicode[STIX]{x1D708}_{k}$
(red line) and
$Re_{\unicode[STIX]{x1D6FF}_{k},k}=U_{k}\unicode[STIX]{x1D6FF}_{k}/\unicode[STIX]{x1D708}_{k}$
(red line) and
 $(Re_{\unicode[STIX]{x1D6FF}_{k},k}/M_{k})^{-1}=(\sqrt{\unicode[STIX]{x1D6FE}RT_{k}}\unicode[STIX]{x1D6FF}_{k}/\unicode[STIX]{x1D708}_{k})^{-1}$
(green line) at roughness location compared with heat transfer
$(Re_{\unicode[STIX]{x1D6FF}_{k},k}/M_{k})^{-1}=(\sqrt{\unicode[STIX]{x1D6FE}RT_{k}}\unicode[STIX]{x1D6FF}_{k}/\unicode[STIX]{x1D708}_{k})^{-1}$
(green line) at roughness location compared with heat transfer
 $q$
at
$q$
at
 $x/L=-0.1$
(from figure 5) and
$x/L=-0.1$
(from figure 5) and
 $(Re_{x,tr})^{-1}=(U_{e}x_{tr}/\unicode[STIX]{x1D708}_{e})^{-1}$
(green square symbols), for (c) diamond and (d) square roughness elements.
$(Re_{x,tr})^{-1}=(U_{e}x_{tr}/\unicode[STIX]{x1D708}_{e})^{-1}$
(green square symbols), for (c) diamond and (d) square roughness elements.
 $Re_{x,tr}$
and
$Re_{x,tr}$
and
 $q$
are scaled for comparison purposes.
$q$
are scaled for comparison purposes.
Further evaluation of the
 $Re_{\unicode[STIX]{x1D6FF},k}$
and
$Re_{\unicode[STIX]{x1D6FF},k}$
and
 $Re_{\unicode[STIX]{x1D6FF},k}/M_{k}$
profiles in figures 8(c) and 8(d), respectively against
$Re_{\unicode[STIX]{x1D6FF},k}/M_{k}$
profiles in figures 8(c) and 8(d), respectively against
 $q-k$
profiles for the diamond and square cases (
$q-k$
profiles for the diamond and square cases (
 $x/L=-0.1$
) and corresponding transition Reynolds number
$x/L=-0.1$
) and corresponding transition Reynolds number
 $Re_{x,tr}=U_{e}x_{tr}/\unicode[STIX]{x1D708}_{e}$
, highlights the higher suitability of
$Re_{x,tr}=U_{e}x_{tr}/\unicode[STIX]{x1D708}_{e}$
, highlights the higher suitability of
 $Re_{\unicode[STIX]{x1D6FF},k}/M_{k}$
to characterise roughness-induced transition between critical and effective conditions for the square configuration, whereby local separation effects are significant. The
$Re_{\unicode[STIX]{x1D6FF},k}/M_{k}$
to characterise roughness-induced transition between critical and effective conditions for the square configuration, whereby local separation effects are significant. The
 $Re_{\unicode[STIX]{x1D6FF},k}/M_{k}$
ratio captures the coupled effect of the shear and compressibility effects at roughness height while cancelling out the velocity term, and proves to correlate directly with roughness-induced disturbance levels. Inertial terms become more dominant above the effective height, rendering
$Re_{\unicode[STIX]{x1D6FF},k}/M_{k}$
ratio captures the coupled effect of the shear and compressibility effects at roughness height while cancelling out the velocity term, and proves to correlate directly with roughness-induced disturbance levels. Inertial terms become more dominant above the effective height, rendering
 $Re_{\unicode[STIX]{x1D6FF},k}$
itself as a suitable parameter for characterisation of such flows, and hence
$Re_{\unicode[STIX]{x1D6FF},k}$
itself as a suitable parameter for characterisation of such flows, and hence
 $Re_{kk}$
through accounting for
$Re_{kk}$
through accounting for
 $k/\unicode[STIX]{x1D6FF}_{k}$
variations,
$k/\unicode[STIX]{x1D6FF}_{k}$
variations,
 $Re_{kk}=Re_{\unicode[STIX]{x1D6FF},k}(k/\unicode[STIX]{x1D6FF}_{k})$
. Results thus partly attribute the suitability of transition parameters of the type
$Re_{kk}=Re_{\unicode[STIX]{x1D6FF},k}(k/\unicode[STIX]{x1D6FF}_{k})$
. Results thus partly attribute the suitability of transition parameters of the type
 $Re_{\unicode[STIX]{x1D703},e}/M_{e}\sim (k/\unicode[STIX]{x1D6FF}_{k})$
, as developed from Hyper-X and Shuttle transition data (Berry & Horvath Reference Berry and Horvath2008, Horvath et al.
Reference Horvath, Zalameda, Wood, Berry, Schwartz, Dantowitz, Spisz and Taylor2012), to the reduced influence of inertial terms within the
$Re_{\unicode[STIX]{x1D703},e}/M_{e}\sim (k/\unicode[STIX]{x1D6FF}_{k})$
, as developed from Hyper-X and Shuttle transition data (Berry & Horvath Reference Berry and Horvath2008, Horvath et al.
Reference Horvath, Zalameda, Wood, Berry, Schwartz, Dantowitz, Spisz and Taylor2012), to the reduced influence of inertial terms within the
 $Re/M$
ratio. Instead, correlations accounting for wall temperature effects such as
$Re/M$
ratio. Instead, correlations accounting for wall temperature effects such as
 $Re_{\unicode[STIX]{x1D703},e}\sim (k/\unicode[STIX]{x1D703})^{-1}(T_{e}/T_{w})^{-n}$
in Reshotko and Tumin (Reference Reshotko and Tumin2004), or effectively
$Re_{\unicode[STIX]{x1D703},e}\sim (k/\unicode[STIX]{x1D703})^{-1}(T_{e}/T_{w})^{-n}$
in Reshotko and Tumin (Reference Reshotko and Tumin2004), or effectively
 $Re_{ke}\sim (T_{e}/T_{w})^{-n}$
, may prime inertial terms and not fully encompass some of the mechanisms influencing the transition process (e.g. shear layer strength). Prediction accuracy may therefore be potentially enhanced by carefully accounting for local roughness effects. While far from a ‘universal’ (nor practical) criterion, a roughness Reynolds number to Mach number ratio with flow properties evaluated at roughness height
$Re_{ke}\sim (T_{e}/T_{w})^{-n}$
, may prime inertial terms and not fully encompass some of the mechanisms influencing the transition process (e.g. shear layer strength). Prediction accuracy may therefore be potentially enhanced by carefully accounting for local roughness effects. While far from a ‘universal’ (nor practical) criterion, a roughness Reynolds number to Mach number ratio with flow properties evaluated at roughness height
 $Re_{\unicode[STIX]{x1D6FF},k}/M_{k}=\sqrt{\unicode[STIX]{x1D6FE}RT_{k}}\unicode[STIX]{x1D6FF}_{k}/\unicode[STIX]{x1D708}_{k}$
would be expected to enhance accuracy in the prediction of roughness-induced transition. Accounting for
$Re_{\unicode[STIX]{x1D6FF},k}/M_{k}=\sqrt{\unicode[STIX]{x1D6FE}RT_{k}}\unicode[STIX]{x1D6FF}_{k}/\unicode[STIX]{x1D708}_{k}$
would be expected to enhance accuracy in the prediction of roughness-induced transition. Accounting for
 $k/\unicode[STIX]{x1D6FF}_{k}$
variations, this can in turn be expressed as
$k/\unicode[STIX]{x1D6FF}_{k}$
variations, this can in turn be expressed as
 $Re_{kk}/M_{k}$
.
$Re_{kk}/M_{k}$
.
It is worth noting again that the local flow topology around roughness elements can be highly complex and this study limits itself to assessing the sensitivity documented at the present base flow conditions (§ 2). Such a sensitivity appears to be manifested as a result of the
 $T_{k}$
(hence
$T_{k}$
(hence
 $\unicode[STIX]{x1D708}_{k}$
) maxima in the incoming boundary layer falling between the critical and effective heights. Further understanding of the roughness-induced transition process of high-speed boundary layers could gain from the investigation of canonical roughness effects such as the square element and use numerical methods and comprehensive empirical analysis to develop deeper insights into the influence of the local (to roughness) flow effects.
$\unicode[STIX]{x1D708}_{k}$
) maxima in the incoming boundary layer falling between the critical and effective heights. Further understanding of the roughness-induced transition process of high-speed boundary layers could gain from the investigation of canonical roughness effects such as the square element and use numerical methods and comprehensive empirical analysis to develop deeper insights into the influence of the local (to roughness) flow effects.
4 Conclusions
The roughness-induced transition of high-speed boundary layers can be strongly influenced by the incoming (undisturbed) flow conditions at roughness height between critical and effective conditions, here respectively
 $(k/\unicode[STIX]{x1D6FF}_{k})_{cr}=0.15$
and
$(k/\unicode[STIX]{x1D6FF}_{k})_{cr}=0.15$
and
 $(k/\unicode[STIX]{x1D6FF}_{k})_{eff}=0.32$
. As a simple means to account for compressibility and viscosity effects, a roughness Reynolds number to Mach number ratio with flow properties evaluated at roughness height
$(k/\unicode[STIX]{x1D6FF}_{k})_{eff}=0.32$
. As a simple means to account for compressibility and viscosity effects, a roughness Reynolds number to Mach number ratio with flow properties evaluated at roughness height
 $Re_{kk}/M_{k}=\sqrt{\unicode[STIX]{x1D6FE}RT_{k}}k/\unicode[STIX]{x1D708}_{k}$
serves as a good indicator of the disturbance levels in the transitional wake of the element – here interpreted based on the heat flux perturbation with respect to that in undisturbed flow. The study highlights the reduction in disturbance levels with increasing height for square elements within the range
$Re_{kk}/M_{k}=\sqrt{\unicode[STIX]{x1D6FE}RT_{k}}k/\unicode[STIX]{x1D708}_{k}$
serves as a good indicator of the disturbance levels in the transitional wake of the element – here interpreted based on the heat flux perturbation with respect to that in undisturbed flow. The study highlights the reduction in disturbance levels with increasing height for square elements within the range
 $0.23\leqslant k/\unicode[STIX]{x1D6FF}_{k}\leqslant 0.32$
(whereby
$0.23\leqslant k/\unicode[STIX]{x1D6FF}_{k}\leqslant 0.32$
(whereby
 $\text{d}\unicode[STIX]{x1D708}_{k}/\text{d}y<0$
), as attributed to the dominant influence of the local separated shear layer dynamics. For effective conditions, and across
$\text{d}\unicode[STIX]{x1D708}_{k}/\text{d}y<0$
), as attributed to the dominant influence of the local separated shear layer dynamics. For effective conditions, and across
 $k/\unicode[STIX]{x1D6FF}_{k}\geqslant 0.32$
, the transition process switches to a ‘bypass’ mechanism with strong local heating near the element and mostly dependent on
$k/\unicode[STIX]{x1D6FF}_{k}\geqslant 0.32$
, the transition process switches to a ‘bypass’ mechanism with strong local heating near the element and mostly dependent on
 $Re_{kk}$
given the increased sensitivity to inertial forces.
$Re_{kk}$
given the increased sensitivity to inertial forces.
Acknowledgement
The support of the Engineering and Physical Sciences Research Council (EPSRC, grant EP/H020853/1) is gratefully acknowledged.


