


1 Introduction
Evaporation of sessile droplets consisting of a solid component and a volatile liquid is a topic with significant research interest. Understanding the film profile that results following complete evaporation is important in coating technologies, for example in paint or the distribution of active ingredients on plant leaves and/or weeds (Basi, Hunsche & Noga Reference Basi, Hunsche and Noga2013). There are a significant number of biological applications: for example, deposit profiles can be used to identify diseases of the blood (Brutin et al. Reference Brutin, Sobac, Loquet and Sampol2011), and DNA microarrays (Goldmann & Gonzalez Reference Goldmann and Gonzalez2000; Angenendt Reference Angenendt2005; Heim et al. Reference Heim, Preuss, Gerstmayer, Bosio and Blossey2005; Deng et al. Reference Deng, Zhu, Kienlen and Guo2006; Dijskman & Pierik Reference Dijskman and Pierik2008; Pierik et al. Reference Pierik, Boamfa, van Zelst, Clout, Stapert, Dijskman, Broer and Wimberger-Friedl2012) can be used for disease diagnostics. The fabrication of electronic devices and circuits on the micro- and nanoscales (Sirringhaus et al. Reference Sirringhaus, Kawase, Friend, Shimoda, Inbasekaran, Wu and Woo2000; Kim et al. Reference Kim, Jeong, Park and Moon2006; Sekitani et al. Reference Sekitani, Noguchi, Zschieschang, Klauk and Someya2008; Ahn et al. Reference Ahn, Duoss, Motala, Guo, Park, Xiong, Yoon, Nuzzo, Rogers and Lewis2009; Naqshbandi et al. Reference Naqshbandi, Canning, Gibson, Nash and Crossley2012) can be achieved through droplet evaporation. Other technologies that use inkjet printing, such as polymer-organic light-emitting diode displays (P-OLEDs), rely heavily on the dynamics of droplet drying (de Gans, Duineveld & Schubert Reference de Gans, Duineveld and Schubert2004; de Gans & Schubert Reference de Gans and Schubert2004; Dijskman et al. Reference Dijskman, Duineveld, Hack, Pierik, Rensen, Rubingh, Schram and Vernhout2007; van Dam & Kuerten Reference van Dam and Kuerten2008); this is the motivation for this research.
P-OLED displays boast several operational advantages over pre-existing technology, such as liquid crystal displays (LCDs), including improved viewing angles and the potential for curved and/or flexible screens. These stem from P-OLEDs being an emissive technology, in which light is emitted as a function of the electrical operation. There is no need for a backlight or a series of filters.
Such displays are manufactured by printing droplets containing the conducting polymer, followed by drying. Understanding the shape of the final light-emitting polymer profile is crucial for P-OLED applications. Specifically, we are interested in how the ink dispersion properties can be tailored to alter the film shape.
It is common to observe an undulating film profile, following complete evaporation of the volatile liquid. More material is deposited towards the droplets’ external boundaries than in the centre. This phenomenon is termed the coffee-ring effect (Deegan et al. Reference Deegan, Bakajin, Dupont, Huber, Nagel and Witten1997, Reference Deegan, Bakajin, Dupont, Huber, Nagel and Witten2000; Deegan Reference Deegan2000; Gelderblom Reference Gelderblom2013). It occurs when the contact line is pinned. Either surface roughness on the substrate or adsorption of the solid material can cause the pinning. The liquid evaporated towards the edge of the droplet is replenished by an outward capillary flow that acts to ensure that the droplet surface maintains an equilibrium shape. The outward capillary flow convects the solid towards the edge, where it is deposited as a ring. For P-OLED displays the current has a strong dependence on film thickness if the device is driven at a constant voltage. Thin areas may lead to hotspots as a result of the non-uniform thickness and emission profile.
Formation of coffee rings has been the topic of considerable research; for reviews, refer to Routh (Reference Routh2013) and Larson (Reference Larson2014). It is sufficient here to say that there are broadly two methodologies for preventing coffee-ring formation. Either the pinning is prevented or the outward capillary flow is hindered. An example of the former is electrowetting (Eral et al. Reference Eral, Mampallil Augustine, Duits and Mugele2011), in which the droplet boundaries are oscillated by the introduction of an alternating current. An example of the latter is the introduction of a surfactant (Basi et al. Reference Basi, Hunsche and Noga2013) to cause an inward Marangoni flow counteracting the outward capillary flow. Other techniques include changing particle shape (Vermant Reference Vermant2011; Yunker et al. Reference Yunker, Still, Lohr and Yodh2011; Dugyala & Basavaraj Reference Dugyala and Basavaraj2014) to increase the diffusion coefficient of the solid material, carefully choosing an electric field to control film shape (Wray et al. Reference Wray, Papageorgiou, Craster, Sefiane and Matar2014) and changing the pH to alter the Derjaguin–Landau–Verwey–Overbeek (DLVO) interactions (Bhardwaj et al. Reference Bhardwaj, Fang, Somasundaran and Attinger2010; Dugyala & Basavaraj Reference Dugyala and Basavaraj2014) so as to cause a strong attraction between the solid material and the substrate. None of these methods is ideal for P-OLED applications, where the droplet shape is set and additional additives are not permissible.
Another method, which could potentially be applied to mitigate coffee-ring formation, is the use of binary or multicomponent liquid inks (Bright et al.
Reference Bright, Carter, Cacheiro and Lyon2010; Wu et al.
Reference Wu, Eliyahu, Liu and Hu2012; Kölpin et al.
Reference Kölpin, Wegeneer, Teuber, Polster, Frey and Roosen2013). This has the benefit that no additional material would need to be added to the final film – the improvement would be achieved by the ink formulation itself. The method has been shown experimentally by many authors to give flatter films (de Gans & Schubert Reference de Gans and Schubert2004; Tekin, de Gans & Schubert Reference Tekin, de Gans and Schubert2004; Park & Moon Reference Park and Moon2006; Kölpin et al.
Reference Kölpin, Wegeneer, Teuber, Polster, Frey and Roosen2013; Teichler, Perelaer & Schubert Reference Teichler, Perelaer and Schubert2013); for example, Teichler et al. (Reference Teichler, Perelaer and Schubert2013) have shown that a large difference in volatilities improves film shape. However, the majority of research has been conducted for thick droplets. It has been postulated that the mechanism driving this improvement is a solvent-induced Marangoni circulation (de Gans & Schubert Reference de Gans and Schubert2004; Park & Moon Reference Park and Moon2006; Yamaue, Jung & Doi Reference Yamaue, Jung and Doi2006). A liquid composition gradient can exist within the droplet and hence a surface tension gradient will exist along the droplet. From consideration of the Young–Laplace equation (
 $p=-{\it\gamma}{\it\kappa}$
, where
$p=-{\it\gamma}{\it\kappa}$
, where
 $p$
is the fluid pressure,
$p$
is the fluid pressure,
 ${\it\gamma}$
is the surface tension and
${\it\gamma}$
is the surface tension and
 ${\it\kappa}$
is the curvature), one might expect a surface flow from areas of low surface tension to areas of high surface tension when the curvature of the droplet is positive. The circulation mechanism, however, is not relevant for our application, in which the droplets are thin enough that there are no depthwise gradients in composition. Many authors report that an improvement in film shape is gained if the more volatile liquid has a higher surface tension (Kim et al.
Reference Kim, Jeong, Park and Moon2006; Park & Moon Reference Park and Moon2006; Chow et al.
Reference Chow, Herrmann, Barton, Raguse and Wieczorek2009; Talbot, Berson & Bain Reference Talbot, Berson and Bain2012; Yang et al.
Reference Yang, Liu, Zhang, Liu and Nie2012), but some authors have observed the opposite (de Gans & Schubert Reference de Gans and Schubert2004; Karabasheva, Baluschev & Graf Reference Karabasheva, Baluschev and Graf2006; Yamaue et al.
Reference Yamaue, Jung and Doi2006). This suggests that the solvent-induced Marangoni circulation is not always the dominant mechanism. As pointed out by Kaneda et al. (Reference Kaneda, Hyakuta, Takao, Ishizuka and Fukai2008), the direction of Marangoni circulation could depend on whether or not the droplet is pinned. Babatunde et al. (Reference Babatunde, Hong, Makaso and Fukai2013) suggest that the reason for the improvement in shape in many of the given examples could be due to depinning rather than Marangoni circulation. It has also been observed that solute-induced Marangoni circulation can influence the final deposit shape but this cannot alone account for the removal of coffee-ring formation (Babatunde et al.
Reference Babatunde, Hong, Makaso and Fukai2013). With the exception of Yamaue et al. (Reference Yamaue, Jung and Doi2006), we are not aware of any other attempts to model the evaporation dynamics and resulting final film profile for binary liquid droplets. Yamaue et al. (Reference Yamaue, Jung and Doi2006) consider a thick droplet of anisole/ethyl acetate and extend the model of Hu & Larson (Reference Hu and Larson2002, Reference Hu and Larson2005a
,Reference Hu and Larson
b
, Reference Hu and Larson2006) to predict the optimal mixing ratio of solvent.
${\it\kappa}$
is the curvature), one might expect a surface flow from areas of low surface tension to areas of high surface tension when the curvature of the droplet is positive. The circulation mechanism, however, is not relevant for our application, in which the droplets are thin enough that there are no depthwise gradients in composition. Many authors report that an improvement in film shape is gained if the more volatile liquid has a higher surface tension (Kim et al.
Reference Kim, Jeong, Park and Moon2006; Park & Moon Reference Park and Moon2006; Chow et al.
Reference Chow, Herrmann, Barton, Raguse and Wieczorek2009; Talbot, Berson & Bain Reference Talbot, Berson and Bain2012; Yang et al.
Reference Yang, Liu, Zhang, Liu and Nie2012), but some authors have observed the opposite (de Gans & Schubert Reference de Gans and Schubert2004; Karabasheva, Baluschev & Graf Reference Karabasheva, Baluschev and Graf2006; Yamaue et al.
Reference Yamaue, Jung and Doi2006). This suggests that the solvent-induced Marangoni circulation is not always the dominant mechanism. As pointed out by Kaneda et al. (Reference Kaneda, Hyakuta, Takao, Ishizuka and Fukai2008), the direction of Marangoni circulation could depend on whether or not the droplet is pinned. Babatunde et al. (Reference Babatunde, Hong, Makaso and Fukai2013) suggest that the reason for the improvement in shape in many of the given examples could be due to depinning rather than Marangoni circulation. It has also been observed that solute-induced Marangoni circulation can influence the final deposit shape but this cannot alone account for the removal of coffee-ring formation (Babatunde et al.
Reference Babatunde, Hong, Makaso and Fukai2013). With the exception of Yamaue et al. (Reference Yamaue, Jung and Doi2006), we are not aware of any other attempts to model the evaporation dynamics and resulting final film profile for binary liquid droplets. Yamaue et al. (Reference Yamaue, Jung and Doi2006) consider a thick droplet of anisole/ethyl acetate and extend the model of Hu & Larson (Reference Hu and Larson2002, Reference Hu and Larson2005a
,Reference Hu and Larson
b
, Reference Hu and Larson2006) to predict the optimal mixing ratio of solvent.
As noted by previous authors (Babatunde et al. Reference Babatunde, Hong, Makaso and Fukai2013), there is a need to model the evaporation of binary liquid droplets. Flow instabilities can form in binary liquid droplets, as mentioned by Kaneda et al. (Reference Kaneda, Hyakuta, Takao, Ishizuka and Fukai2008) and Sefiane, David & Shanahan (Reference Sefiane, David and Shanahan2008), amongst others. This possibility adds a level of complexity to the work required. In this paper, we build on previous thin-film lubrication models (Routh & Russel Reference Routh and Russel1998; Salamanca et al. Reference Salamanca, Ciampi, Faux, Glover, Mcdonald, Routh, Peters, Satguru and Keddie2001; Ozawa, Nishitani & Doi Reference Ozawa, Nishitani and Doi2005; Tarasevich, Vodolazskaya & Bondarenko Reference Tarasevich, Vodolazskaya and Bondarenko2013; Wray et al. Reference Wray, Papageorgiou, Craster, Sefiane and Matar2014; Eales et al. Reference Eales, Dartnell, Goddard and Routh2015a ,Reference Eales, Dartnell, Goddard and Routh b ; Eales & Routh Reference Eales and Routh2016) and extend the analysis to ideal, binary liquids containing polymer.
During drying, the solids fraction increases due to evaporation of the volatile liquid. When the solids content is sufficiently large, consolidated regions can form. In the case of polymer, a gel typically forms. The position of the liquid/gel front that results is tracked continuously. In order to determine whether the numerical solutions make sense, we perform white-light interferometry experiments on the residues of inkjetted droplets.
Much debate remains with regard to the evaporative flux distribution across the surface of a droplet. It was shown by Fischer (Reference Fischer2002) that the evaporative flux distribution can alter internal flows and in turn the final film profile. For small, pure liquid droplets, with stagnant surroundings, an enhancement in the evaporation rate towards the edge of the droplets is expected. This is because the mass transfer limitation is diffusion of vapour away from the droplet surface. This is not the case for large, pure liquid droplets in a well ventilated atmosphere, where a spatially uniform evaporative flux profile is expected. Through digital holographic interferometry experiments, it has been shown that the profile differs markedly from vapour diffusion models (Dahaeck, Rednikov & Colinet Reference Dahaeck, Rednikov and Colinet2014). To our knowledge this is the first attempt at modelling the evaporation dynamics of a binary liquid droplet containing polymer, in the thin-film, lubrication regime. For that reason, we wish to keep the model as simple as possible, to delineate the important mechanisms pertinent to selection of liquids. The evaporative flux distribution is taken as spatially uniform for each individual liquid, with any spatial variation resulting solely from liquid compositional variations. The present model could be extended to include spatially varying evaporation if necessary.
Since there is the possibility of an instability occurring in the droplet height, within the thin droplets, we use a linear stability analysis to predict its onset. This analysis has previously been used for thin films, for example by Yeo, Craster & Matar (Reference Yeo, Craster and Matar2003), in which the stability of a flat film on a heated substrate is predicted. Our work considers the stability of a binary liquid droplet. The geometry can result in a significant liquid compositional gradient within the droplet. The presence of polymer and diffusion are ignored for this analysis, since they are both likely to have a stabilising effect.
The aim of this paper is to discover the important parameters controlling the final film shape for inkjetted binary liquid droplets containing light-emitting polymer. We hope that this research will provide an insight into selection of the liquid components in order to mitigate coffee-ring formation.
2 Mathematical model
Consider a droplet consisting of a suspension of a single, solid material (e.g. polymer) in a perfectly miscible, binary mixture of volatile liquid components. Component
 $1$
is defined as the more volatile liquid (volumetric evaporation rate per unit area
$1$
is defined as the more volatile liquid (volumetric evaporation rate per unit area
 ${E_{1}}^{\star }$
, density
${E_{1}}^{\star }$
, density
 ${{\it\rho}_{1}}^{\star }$
, viscosity
${{\it\rho}_{1}}^{\star }$
, viscosity
 ${{\it\mu}_{1}}^{\star }$
, surface tension
${{\it\mu}_{1}}^{\star }$
, surface tension
 ${{\it\gamma}_{1}}^{\star }$
) and component 2 as the less volatile liquid (volumetric evaporation rate per unit area
${{\it\gamma}_{1}}^{\star }$
) and component 2 as the less volatile liquid (volumetric evaporation rate per unit area
 ${E_{2}}^{\star }$
, density
${E_{2}}^{\star }$
, density
 ${{\it\rho}_{2}}^{\star }$
, viscosity
${{\it\rho}_{2}}^{\star }$
, viscosity
 ${{\it\mu}_{2}}^{\star }$
, surface tension
${{\it\mu}_{2}}^{\star }$
, surface tension
 ${{\it\gamma}_{2}}^{\star }$
). Properties marked with
${{\it\gamma}_{2}}^{\star }$
). Properties marked with
 $^{\star }$
are for the pure liquid. The solid material is initially uniformly distributed with volume fraction
$^{\star }$
are for the pure liquid. The solid material is initially uniformly distributed with volume fraction
 ${\it\phi}_{0}$
.
${\it\phi}_{0}$
.
2.1 Assumptions and mixture properties
For the binary liquid, we consider an ideal mixture. Non-ideal, partially miscible systems are not treated in this work, but it is possible to extend the theory if necessary. In addition, it is assumed that the surrounding atmosphere is an ideal gas. These assumptions enable the use of Raoult’s law, such that the vapour pressure of a liquid component is the product of that component’s vapour pressure when pure and its liquid-phase mole fraction. The total vapour pressure of the liquid phase,
 $p_{v}$
, is hence
$p_{v}$
, is hence
 $$\begin{eqnarray}p_{v}={p_{1}}^{\star }x_{1}+{p_{2}}^{\star }(1-x_{1}),\end{eqnarray}$$
where
 $x_{1}$
is the liquid-phase mole fraction of component
$x_{1}$
is the liquid-phase mole fraction of component
 $1$
on a solid-free basis, and
$1$
on a solid-free basis, and
 ${p_{1}}^{\star }$
and
${p_{1}}^{\star }$
and
 ${p_{2}}^{\star }$
are the vapour pressures of each, pure, liquid.
${p_{2}}^{\star }$
are the vapour pressures of each, pure, liquid.
Assuming that the concentrations of the volatile components in the surrounding atmosphere are zero and the system is well ventilated, the evaporation rates for the pure liquid of each component are given by
 $$\begin{eqnarray}\displaystyle & \displaystyle {E_{1}}^{\star }={k_{1}}^{\star }{p_{1}}^{\star }, & \displaystyle\end{eqnarray}$$
 $$\begin{eqnarray}\displaystyle & \displaystyle {E_{2}}^{\star }={k_{2}}^{\star }{p_{2}}^{\star }, & \displaystyle\end{eqnarray}$$
 ${k_{i}}^{\star }$
is the mass transfer coefficient for the transfer of pure liquid
${k_{i}}^{\star }$
is the mass transfer coefficient for the transfer of pure liquid
 $i$
to the vapour phase.
$i$
to the vapour phase.
By applying Raoult’s law, the total liquid evaporation rate,
 $E$
, is
$E$
, is
 $$\begin{eqnarray}E={E_{1}}^{\star }x_{1}+{E_{2}}^{\star }(1-x_{1}).\end{eqnarray}$$
For the viscosity of the mixture, a simple linear relation is adopted between the viscosities of the two liquids. It should be noted that the viscosity does increase with solids content; however, as we will discuss later, the flow within the droplet is dominated by surface tension effects. Later, we will show that the nature of this expression is unimportant, since surface tension effects dominate the flow profile.
 $$\begin{eqnarray}{\it\mu}={{\it\mu}_{1}}^{\star }x_{1}+{{\it\mu}_{2}}^{\star }(1-x_{1}).\end{eqnarray}$$
To fit the surface tension of the binary liquid mixture as a function of liquid composition, one might crudely consider a linear relation. In order for the surface energy of the droplet to be minimised, however, there is a preferential partition of the liquid with lower surface tension to the droplet surface (Hildebrand & Scott Reference Hildebrand and Scott1964; Schmidt, Randall & Clever Reference Schmidt, Randall and Clever1966; Suri & Ramakrishna Reference Suri and Ramakrishna1968; Escobedo & Ali Mansoori Reference Escobedo and Ali Mansoori1998). For this reason and following Hildebrand & Scott (Reference Hildebrand and Scott1964) and Suri & Ramakrishna (Reference Suri and Ramakrishna1968), the surface tension is fitted using
 $$\begin{eqnarray}{\it\gamma}={{\it\gamma}_{1}}^{\star }x_{1}+{{\it\gamma}_{2}}^{\star }(1-x_{1})\pm \frac{A}{2R_{g}T}({{\it\gamma}_{1}}^{\star }-{{\it\gamma}_{2}}^{\star })x_{1}(1-x_{1}),\end{eqnarray}$$
where
 $A$
is the surface occupancy of the molecules (
$A$
is the surface occupancy of the molecules (
 $\text{cm}^{2}~\text{mol}^{-1}$
) and is approximately the same for each component if the mixture is ideal,
$\text{cm}^{2}~\text{mol}^{-1}$
) and is approximately the same for each component if the mixture is ideal,
 $R_{g}$
is the universal gas constant and
$R_{g}$
is the universal gas constant and
 $T$
is the temperature in kelvin. The
$T$
is the temperature in kelvin. The
 $\pm$
term is used to ensure that the surface tension is always reduced compared to the linear relation. Note that the expression above does not include any impact of solids on surface tension. By performing experiments using inks containing different concentrations of light-emitting polymer, we did not observe a notable influence on surface tension.
$\pm$
term is used to ensure that the surface tension is always reduced compared to the linear relation. Note that the expression above does not include any impact of solids on surface tension. By performing experiments using inks containing different concentrations of light-emitting polymer, we did not observe a notable influence on surface tension.
2.2 Scaling terms and simplifications
Due to either surface inhomogeneities or adsorption of the solid material to the substrate, the three-phase contact line is assumed to be pinned. The model considers an axisymmetric droplet, in a cylindrical coordinate system (radius
 $r$
, height
$r$
, height
 $h$
, azimuth
$h$
, azimuth
 ${\it\theta}$
), such that velocity and gradients in the azimuthal direction are negligible (
${\it\theta}$
), such that velocity and gradients in the azimuthal direction are negligible (
 $v_{{\it\theta}}=0,\partial /\partial {\it\theta}=0$
). As can be seen in figure 1, the horizontal length scale is the droplet radius,
$v_{{\it\theta}}=0,\partial /\partial {\it\theta}=0$
). As can be seen in figure 1, the horizontal length scale is the droplet radius,
 $R$
, and the vertical length scale is the initial droplet height,
$R$
, and the vertical length scale is the initial droplet height,
 $H$
. An extension to droplets with a non-circular cross-section, as in van Dam & Kuerten (Reference van Dam and Kuerten2008), could be an interesting topic for future work on P-OLED displays.
$H$
. An extension to droplets with a non-circular cross-section, as in van Dam & Kuerten (Reference van Dam and Kuerten2008), could be an interesting topic for future work on P-OLED displays.

Figure 1. Sketch of a droplet residing on a flat substrate.
Scaling is arbitrarily performed on the basis of the less volatile liquid, as outlined in table 1.
Table 1. Scaling terms used to cast non-dimensional properties. A
 $^{\star }$
denotes saturated parameter values.
$^{\star }$
denotes saturated parameter values.

Typically,
 $R$
is about
$R$
is about
 $125~{\rm\mu}\text{m}$
. The Bond number,
$125~{\rm\mu}\text{m}$
. The Bond number,
 $Bo$
, can be used to compare the relative magnitudes of gravity and surface tension on the droplet. It is found that typical values for the Bond number are very small, and consequently surface tension dominates at this length scale. Gravitational sagging of the droplet interface can hence be neglected.
$Bo$
, can be used to compare the relative magnitudes of gravity and surface tension on the droplet. It is found that typical values for the Bond number are very small, and consequently surface tension dominates at this length scale. Gravitational sagging of the droplet interface can hence be neglected.
 $$\begin{eqnarray}Bo=\frac{{{\it\rho}_{2}}^{\star }gR^{2}}{{{\it\gamma}_{2}}^{\star }}\sim 10^{-3},\end{eqnarray}$$
where
 $g$
is the acceleration due to gravity. The liquid density (
$g$
is the acceleration due to gravity. The liquid density (
 ${{\it\rho}_{2}}^{\star }=1084~\text{kg}~\text{m}^{-3}$
) (Garcia et al.
Reference Garcia, Miranda, Leal, Ortega and Matos1991) and air–liquid surface tension (
${{\it\rho}_{2}}^{\star }=1084~\text{kg}~\text{m}^{-3}$
) (Garcia et al.
Reference Garcia, Miranda, Leal, Ortega and Matos1991) and air–liquid surface tension (
 ${{\it\gamma}_{2}}^{\star }=3.8\times 10^{-2}~\text{N}~\text{m}^{-1}$
) (Wohlfarth Reference Wohlfarth and Lechner2008) are for methyl benzoate at 1 atm and
${{\it\gamma}_{2}}^{\star }=3.8\times 10^{-2}~\text{N}~\text{m}^{-1}$
) (Wohlfarth Reference Wohlfarth and Lechner2008) are for methyl benzoate at 1 atm and
 $20\,^{\circ }\text{C}$
.
$20\,^{\circ }\text{C}$
.
The Reynolds number,
 $Re$
, is very small. This enables simplification of the governing equations, by the creeping-flow assumption, in which inertial effects are neglected. Furthermore, we consider thin films, for which the lubrication approximation (
$Re$
, is very small. This enables simplification of the governing equations, by the creeping-flow assumption, in which inertial effects are neglected. Furthermore, we consider thin films, for which the lubrication approximation (
 $Re\,H^{2}/R^{2}\ll 1$
) holds.
$Re\,H^{2}/R^{2}\ll 1$
) holds.
 $$\begin{eqnarray}Re=\frac{{{\it\rho}_{2}}^{\star }{E_{2}}^{\star }R}{{{\it\mu}_{2}}^{\star }}\sim 10^{-7}.\end{eqnarray}$$
The evaporative flux per unit area (
 ${E_{2}}^{\star }=2.0\times 10^{-9}~\text{m}^{3}~\text{m}^{-2}~\text{s}^{-1}$
) was measured by the mass loss from a petri dish containing pure methyl benzoate at
${E_{2}}^{\star }=2.0\times 10^{-9}~\text{m}^{3}~\text{m}^{-2}~\text{s}^{-1}$
) was measured by the mass loss from a petri dish containing pure methyl benzoate at
 $20\,^{\circ }\text{C}$
. The viscosity (
$20\,^{\circ }\text{C}$
. The viscosity (
 ${{\it\mu}_{2}}^{\star }=1.8\times 10^{-3}~\text{N}~\text{s}~\text{m}^{-2}$
) (Garcia et al.
Reference Garcia, Miranda, Leal, Ortega and Matos1991) is again for methyl benzoate at 1 atm and
${{\it\mu}_{2}}^{\star }=1.8\times 10^{-3}~\text{N}~\text{s}~\text{m}^{-2}$
) (Garcia et al.
Reference Garcia, Miranda, Leal, Ortega and Matos1991) is again for methyl benzoate at 1 atm and
 $20\,^{\circ }\text{C}$
.
$20\,^{\circ }\text{C}$
.
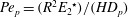
The strength of diffusion in the horizontal direction will be a function not only of particle size but also of shape. We account for the relative strength of diffusion by using the Péclet number,
 $Pe_{p}$
, which is the ratio of the rates of convection and diffusion. Generally the diffusion is weak. As solids content increases, so the viscosity increases. This results in a smaller diffusion coefficient and a larger Péclet number. In our numerical solutions we will use the base case
$Pe_{p}$
, which is the ratio of the rates of convection and diffusion. Generally the diffusion is weak. As solids content increases, so the viscosity increases. This results in a smaller diffusion coefficient and a larger Péclet number. In our numerical solutions we will use the base case
 $Pe_{p}\rightarrow \infty$
, but we will handle a few cases of finite
$Pe_{p}\rightarrow \infty$
, but we will handle a few cases of finite
 $Pe_{p}$
to investigate weak diffusion.
$Pe_{p}$
to investigate weak diffusion.
 $$\begin{eqnarray}Pe_{p}=\frac{R^{2}{E_{2}}^{\star }}{HD_{p}}\approx 3,\end{eqnarray}$$
where
 $D_{p}$
is the Stokes–Einstein diffusion coefficient for the solid material in the liquid medium (
$D_{p}$
is the Stokes–Einstein diffusion coefficient for the solid material in the liquid medium (
 $1.2\times 10^{-12}~\text{m}^{2}~\text{s}^{-1}$
for a dilute suspension of rigid, 100 nm spheres) and a typical value for
$1.2\times 10^{-12}~\text{m}^{2}~\text{s}^{-1}$
for a dilute suspension of rigid, 100 nm spheres) and a typical value for
 $H$
is
$H$
is
 ${\sim}10~{\rm\mu}\text{m}$
. We treat the solid as a suspension of non-interacting spheres. Note that for polymer chains the validity of the rigid-sphere assumption depends on the quality of the solvent. This could provide a topic for future research.
${\sim}10~{\rm\mu}\text{m}$
. We treat the solid as a suspension of non-interacting spheres. Note that for polymer chains the validity of the rigid-sphere assumption depends on the quality of the solvent. This could provide a topic for future research.
For the liquid–liquid diffusion, we use the liquid–liquid Péclet number,
 $Pe_{ll}$
.
$Pe_{ll}$
.
 $$\begin{eqnarray}Pe_{ll}=\frac{R^{2}{E_{2}}^{\star }}{HD_{ll}}\sim 10^{-3}.\end{eqnarray}$$
The diffusion coefficient of the ‘solute’ liquid,
 $1$
, through the ‘solvent’ liquid,
$1$
, through the ‘solvent’ liquid,
 $2$
, is
$2$
, is
 $D_{ll}$
. A typical order of magnitude for liquids is
$D_{ll}$
. A typical order of magnitude for liquids is
 $10^{-9}~\text{m}^{2}~\text{s}^{-1}$
. For the numerical solutions we initially examine the case without diffusion (
$10^{-9}~\text{m}^{2}~\text{s}^{-1}$
. For the numerical solutions we initially examine the case without diffusion (
 $Pe_{ll}\rightarrow \infty$
) in order to understand what would be expected to happen if there were no liquid–liquid diffusion. We then move on to consider finite
$Pe_{ll}\rightarrow \infty$
) in order to understand what would be expected to happen if there were no liquid–liquid diffusion. We then move on to consider finite
 $Pe_{ll}$
. Section 4.2 is devoted to the treatment of liquid–liquid diffusion and its significance.
$Pe_{ll}$
. Section 4.2 is devoted to the treatment of liquid–liquid diffusion and its significance.
The relative importance of viscous and surface tension forces is governed by the magnitude of the capillary number,
 $Ca$
. In the derivation of the governing equations, which follows in § 2.3, it is shown that the capillary number is
$Ca$
. In the derivation of the governing equations, which follows in § 2.3, it is shown that the capillary number is
 $$\begin{eqnarray}Ca=\frac{3{{\it\mu}_{2}}^{\star }R^{4}{E_{2}}^{\star }}{{{\it\gamma}_{2}}^{\star }H^{4}}\sim 10^{-5}.\end{eqnarray}$$
It is found under most conditions that surface tension effects dominate viscous ones. Even with an increase in viscosity of several orders of magnitude, due to increased solids content, the viscosity has no impact on film shape. Hence, all numerical solutions provided in this work will consider the limit of small
 $Ca$
. For the simulations, the limit of small capillary number is taken to be
$Ca$
. For the simulations, the limit of small capillary number is taken to be
 $Ca=10^{-3}$
; this ensures that surface tension dominates whilst achieving an acceptable simulation time. Previous works (Fischer Reference Fischer2002; Eales et al.
Reference Eales, Dartnell, Goddard and Routh2015a
) have shown that coffee-ring formation would be avoided if the capillary number could be made large.
$Ca=10^{-3}$
; this ensures that surface tension dominates whilst achieving an acceptable simulation time. Previous works (Fischer Reference Fischer2002; Eales et al.
Reference Eales, Dartnell, Goddard and Routh2015a
) have shown that coffee-ring formation would be avoided if the capillary number could be made large.
As the volatile liquid mixture evaporates, the volume fraction of the solid component,
 ${\it\phi}$
, increases from an initial value of typically 1 % or less. Due to packing or gelling, a maximum value,
${\it\phi}$
, increases from an initial value of typically 1 % or less. Due to packing or gelling, a maximum value,
 ${\it\phi}_{max}$
, will eventually be reached. It is assumed that
${\it\phi}_{max}$
, will eventually be reached. It is assumed that
 ${\it\phi}_{max}$
is the same for both liquids. The viscosity of the dispersion will increase with increasing solid volume fraction. The expression we use to account for this, following Krieger & Dougherty (Reference Krieger and Dougherty1959), is
${\it\phi}_{max}$
is the same for both liquids. The viscosity of the dispersion will increase with increasing solid volume fraction. The expression we use to account for this, following Krieger & Dougherty (Reference Krieger and Dougherty1959), is
 $$\begin{eqnarray}\frac{{\it\mu}}{{\it\mu}_{0}}=\left(1-\frac{{\it\phi}}{{\it\phi}_{max}}\right)^{-n}.\end{eqnarray}$$
Note that if polymer solutions are considered, a more specific, alternative relationship would be required. However, due to the very small capillary number, this viscosity correction term generally has no impact on the final film shape.
It is assumed that the presence of the solid material does not alter the surface tension significantly. Thus, the solutal Marangoni effect is neglected but it is possible to extend this work to account for it if required.
It has been argued in previous works (Ozawa et al.
Reference Ozawa, Nishitani and Doi2005; Tarasevich et al.
Reference Tarasevich, Vodolazskaya and Bondarenko2013) that evaporation will be completely suppressed when the volume fraction reaches
 ${\it\phi}_{max}$
. If this were the case, we would expect the final deposit to be wet. In other words, a fraction (
${\it\phi}_{max}$
. If this were the case, we would expect the final deposit to be wet. In other words, a fraction (
 $1-{\it\phi}_{max}$
) of the final film volume would still contain liquid. In practice this is not observed, meaning that evaporation, whilst significantly hindered, cannot be completely suppressed. This is accounted for by using a hindrance fraction,
$1-{\it\phi}_{max}$
) of the final film volume would still contain liquid. In practice this is not observed, meaning that evaporation, whilst significantly hindered, cannot be completely suppressed. This is accounted for by using a hindrance fraction,
 $f_{h}$
, such that the evaporation in close-packed/gelled regions is hindered in the following manner. In regions where
$f_{h}$
, such that the evaporation in close-packed/gelled regions is hindered in the following manner. In regions where
 ${\it\phi}={\it\phi}_{max}$
:
${\it\phi}={\it\phi}_{max}$
:
 $$\begin{eqnarray}E_{h}(r)=(1-f_{h})E(r),\end{eqnarray}$$
where
 $0\leqslant f_{h}<1$
,
$0\leqslant f_{h}<1$
,
 $E_{h}$
is the evaporation rate in the close-packed/gelled region and
$E_{h}$
is the evaporation rate in the close-packed/gelled region and
 $E$
is the evaporation rate if there were no hindrance to evaporation. In the base case, the hindrance fraction,
$E$
is the evaporation rate if there were no hindrance to evaporation. In the base case, the hindrance fraction,
 $f_{h}$
, is chosen to be constant at 0.95.
$f_{h}$
, is chosen to be constant at 0.95.
Since the purpose of this work is to predict trends and provide guidance in selection of binary liquid inks for inkjet printing applications, we will not concern ourselves greatly with the subtleties of edge-enhanced evaporation profiles.
 ${E_{1}}^{\star }$
and
${E_{1}}^{\star }$
and
 ${E_{2}}^{\star }$
are assumed to be spatially uniform. The evaporation rate,
${E_{2}}^{\star }$
are assumed to be spatially uniform. The evaporation rate,
 $E$
, is taken to be a function of position and time, solely because
$E$
, is taken to be a function of position and time, solely because
 $x_{1}$
is a function of position.
$x_{1}$
is a function of position.
 $$\begin{eqnarray}E(r)={E_{1}}^{\star }x_{1}(r)+{E_{2}}^{\star }(1-x_{1}(r)).\end{eqnarray}$$
2.3 Derivation of the governing equations
For pure liquid droplets, the governing equations for droplet height and volume fraction of solid material have been derived by Routh & Russel (Reference Routh and Russel1998), Salamanca et al. (Reference Salamanca, Ciampi, Faux, Glover, Mcdonald, Routh, Peters, Satguru and Keddie2001), Ozawa et al. (Reference Ozawa, Nishitani and Doi2005), van Dam & Kuerten (Reference van Dam and Kuerten2008), Tarasevich et al. (Reference Tarasevich, Vodolazskaya and Bondarenko2013), Wray et al. (Reference Wray, Papageorgiou, Craster, Sefiane and Matar2014), Eales (Reference Eales2015) and Eales et al. (Reference Eales, Dartnell, Goddard and Routh2015a ,Reference Eales, Dartnell, Goddard and Routh b ). Here, we extend the work to binary liquid mixtures. In addition, we derive the governing equation for the liquid composition and allow for evaporation hindrance upon gelation.
Starting with the incompressible, axisymmetric, steady-state Navier–Stokes equations, the non-dimensionalisation can be performed using the scalings outlined in table 1. Applying the lubrication assumption, we find that for the thin film there is negligible depthwise gradient in pressure. The horizontal velocity and the surface pressure gradient are related by
 $$\begin{eqnarray}\frac{\text{d}\bar{p}}{\text{d}\bar{r}}=\bar{{\it\mu}}\frac{\partial ^{2}\bar{v_{r}}}{\partial \bar{z}^{2}},\end{eqnarray}$$
where
 $\bar{{\it\mu}}$
is the non-dimensional viscosity, neglecting the influence of polymer, given by
$\bar{{\it\mu}}$
is the non-dimensional viscosity, neglecting the influence of polymer, given by
 $$\begin{eqnarray}\bar{{\it\mu}}=x_{1}\frac{{{\it\mu}_{1}}^{\star }}{{{\it\mu}_{2}}^{\star }}+(1-x_{1}).\end{eqnarray}$$
An expression for the horizontal velocity can be determined by integrating (2.15) twice, with respect to the vertical coordinate. The no-slip boundary condition is used at the substrate (
 $\bar{z}=0,\bar{v_{r}}=0$
) and the tangential stress at the droplet surface must be equal to the surface tension gradient, following equation (2.17). Note that the nonlinear term in (2.6) is neglected in this balance. This is because an order-of-magnitude analysis conducted using a typical value for the surface occupancy of molecules,
$\bar{z}=0,\bar{v_{r}}=0$
) and the tangential stress at the droplet surface must be equal to the surface tension gradient, following equation (2.17). Note that the nonlinear term in (2.6) is neglected in this balance. This is because an order-of-magnitude analysis conducted using a typical value for the surface occupancy of molecules,
 $A$
, from Suri & Ramakrishna (Reference Suri and Ramakrishna1968) shows that the nonlinear contribution is of negligible magnitude:
$A$
, from Suri & Ramakrishna (Reference Suri and Ramakrishna1968) shows that the nonlinear contribution is of negligible magnitude:
 $$\begin{eqnarray}\displaystyle \left.\bar{{\it\mu}}\frac{\partial \bar{v_{r}}}{\partial \bar{z}}\right|_{\bar{z}=\bar{h}}=\frac{{{\it\gamma}_{2}}^{\star }H^{2}}{{{\it\mu}_{2}}^{\star }R^{2}{E_{2}}^{\star }}\left(\frac{{{\it\gamma}_{1}}^{\star }}{{{\it\gamma}_{2}}^{\star }}-1\right)\left.\frac{\partial x_{1}}{\partial \bar{r}}\right|_{\bar{z}=\bar{h}}, & & \displaystyle\end{eqnarray}$$
 $$\begin{eqnarray}\displaystyle \bar{v_{r}}=\left(\frac{\bar{z}^{2}-2\bar{h}\bar{z}}{2\bar{{\it\mu}}}\right)\frac{\text{d}\bar{p}}{\text{d}\bar{r}}+\frac{1}{\bar{{\it\mu}}}\frac{R^{2}}{H^{2}}\left(\frac{{{\it\gamma}_{1}}^{\star }}{{{\it\gamma}_{2}}^{\star }}-1\right)\bar{z}\left.\frac{\partial x_{1}}{\partial \bar{r}}\right|_{\bar{z}=\bar{h}}. & & \displaystyle\end{eqnarray}$$
The pressure gradient is found by differentiating the Young–Laplace equation (
 $p=-{\it\gamma}{\it\kappa}$
), where
$p=-{\it\gamma}{\it\kappa}$
), where
 ${\it\kappa}$
is the mean curvature of the droplet surface. A standard expression for
${\it\kappa}$
is the mean curvature of the droplet surface. A standard expression for
 ${\it\kappa}$
can be derived using differential geometry. Within the lubrication approximation, the pressure is
${\it\kappa}$
can be derived using differential geometry. Within the lubrication approximation, the pressure is
 $$\begin{eqnarray}\bar{p}=-\frac{{{\it\gamma}_{2}}^{\star }H^{4}}{{{\it\mu}_{2}}^{\star }R^{4}{E_{2}}^{\star }}\bar{{\it\gamma}}\left(\frac{\partial ^{2}\bar{h}}{\partial \bar{r}^{2}}+\frac{1}{\bar{r}}\frac{\partial \bar{h}}{\partial \bar{r}}\right),\end{eqnarray}$$
where
 $\bar{{\it\gamma}}$
is the non-dimensional surface tension at the air–liquid interface, given by
$\bar{{\it\gamma}}$
is the non-dimensional surface tension at the air–liquid interface, given by
 $$\begin{eqnarray}\bar{{\it\gamma}}=\frac{{{\it\gamma}_{1}}^{\star }}{{{\it\gamma}_{2}}^{\star }}x_{1}+(1-x_{1})\pm \frac{A}{2RT}\left(\frac{{{\it\gamma}_{1}}^{\star }}{{{\it\gamma}_{2}}^{\star }}-1\right)x_{1}(1-x_{1}).\end{eqnarray}$$
Subsequent differentiation yields the pressure gradient as
 $$\begin{eqnarray}\frac{\text{d}\bar{p}}{\text{d}\bar{r}}=-\frac{{{\it\gamma}_{2}}^{\star }H^{4}}{{{\it\mu}_{2}}^{\star }R^{4}{E_{2}}^{\star }}\frac{\partial }{\partial \bar{r}}\left[\bar{{\it\gamma}}\left(\frac{\partial ^{2}\bar{h}}{\partial \bar{r}^{2}}+\frac{1}{\bar{r}}\frac{\partial \bar{h}}{\partial \bar{r}}\right)\right].\end{eqnarray}$$
Hence, using (2.18), the horizontal velocity is
 $$\begin{eqnarray}\displaystyle \bar{v_{r}}=\frac{{{\it\gamma}_{2}}^{\star }H^{4}}{2{{\it\mu}_{2}}^{\star }R^{4}{E_{2}}^{\star }}\frac{1}{\bar{{\it\mu}}}\left[(2\bar{h}\bar{z}-\bar{z}^{2})\frac{\partial }{\partial \bar{r}}\left[\bar{{\it\gamma}}\left(\frac{\partial ^{2}\bar{h}}{\partial \bar{r}^{2}}+\frac{1}{\bar{r}}\frac{\partial \bar{h}}{\partial \bar{r}}\right)\right]+2\frac{R^{2}}{H^{2}}\left(\frac{{{\it\gamma}_{1}}^{\star }}{{{\it\gamma}_{2}}^{\star }}-1\right)\bar{z}\left.\frac{\partial x_{1}}{\partial \bar{r}}\right|_{\bar{z}=\bar{h}}\right]. & & \displaystyle\end{eqnarray}$$
In the lubrication regime, we are interested in the horizontal flow within the droplet and ignore depthwise gradients. It is convenient to consider the vertically averaged horizontal velocity:
 $$\begin{eqnarray}\displaystyle \tilde{\bar{v_{r}}}=\frac{1}{\bar{h}}\int _{\bar{z}=0}^{\bar{z}=\bar{h}}\bar{v_{r}}\,\text{d}\bar{r}=\frac{\displaystyle \bar{h}^{2}\frac{\partial }{\partial \bar{r}}\left[\bar{{\it\gamma}}\left(\frac{\partial ^{2}\bar{h}}{\partial \bar{r}^{2}}+\frac{1}{\bar{r}}\frac{\partial \bar{h}}{\partial \bar{r}}\right)\right]+\frac{3R^{2}}{2H^{2}}\left(\frac{{{\it\gamma}_{1}}^{\star }}{{{\it\gamma}_{2}}^{\star }}-1\right)\bar{h}\left.\frac{\partial x_{1}}{\partial \bar{r}}\right|_{\bar{z}=\bar{h}}}{Ca\,\bar{{\it\mu}}}, & & \displaystyle\end{eqnarray}$$
where
 $$\begin{eqnarray}\displaystyle Ca=\frac{3{{\it\mu}_{2}}^{\star }R^{4}E_{2}^{\star }}{{{\it\gamma}_{2}}^{\star }H^{4}}. & & \displaystyle\end{eqnarray}$$
By examining the boundary condition at the droplet surface, defined in (2.17), two limits for the vertically averaged horizontal velocity can be considered, as follows.
Velocity limit 1:
 $\bar{{\it\mu}}$
and
$\bar{{\it\mu}}$
and
 $\partial \bar{v_{r}}/\partial \bar{z}|_{\bar{z}=\bar{h}}$
are of order unity.
$\partial \bar{v_{r}}/\partial \bar{z}|_{\bar{z}=\bar{h}}$
are of order unity.
In this limit, the air–liquid interface has approximately zero shear stress. This is because a strong surface flow rapidly alters the surface composition to ensure there is no gradient in surface tension. This is a localised effect and the liquid composition can still vary in the bulk liquid below the surface.
 $$\begin{eqnarray}\displaystyle \left.\frac{\partial x_{1}}{\partial \bar{r}}\right|_{\bar{z}=\bar{h}}\sim \frac{{{\it\mu}_{2}}^{\star }R^{2}{E_{2}}^{\star }}{{{\it\gamma}_{2}}^{\star }H^{2}}\approx 10^{-8}, & & \displaystyle\end{eqnarray}$$
 $$\begin{eqnarray}\displaystyle \tilde{\bar{v_{r}}}\approx \frac{\displaystyle \bar{h}^{2}\frac{\partial }{\partial \bar{r}}\left[\bar{{\it\gamma}}\left(\frac{\partial ^{2}\bar{h}}{\partial \bar{r}^{2}}+\frac{1}{\bar{r}}\frac{\partial \bar{h}}{\partial \bar{r}}\right)\right]}{Ca\,\bar{{\it\mu}}}. & & \displaystyle\end{eqnarray}$$
 $\partial x_{1}/\partial \bar{r}|_{\bar{z}=\bar{h}}$
is of order unity.
$\partial x_{1}/\partial \bar{r}|_{\bar{z}=\bar{h}}$
is of order unity.
In this limit, the vertical gradient in horizontal velocity is very large at the air–liquid interface. The curvature-induced capillary flow is negligible compared to the Marangoni flow.
 $$\begin{eqnarray}\displaystyle \left.\frac{\partial \bar{v_{r}}}{\partial \bar{z}}\right|_{\bar{z}=\bar{h}}\sim \frac{{{\it\gamma}_{2}}^{\star }H^{2}}{{{\it\mu}_{2}}^{\star }R^{2}{E_{2}}^{\star }}\approx 10^{8}, & & \displaystyle\end{eqnarray}$$
 $$\begin{eqnarray}\displaystyle \tilde{\bar{v_{r}}}\approx \frac{\displaystyle \frac{3R^{2}}{2H^{2}}\left(\frac{{{\it\gamma}_{1}}^{\star }}{{{\it\gamma}_{2}}^{\star }}-1\right)\bar{h}\left.\frac{\partial x_{1}}{\partial \bar{r}}\right|_{\bar{z}=\bar{h}}}{Ca\,\bar{{\it\mu}}}. & & \displaystyle\end{eqnarray}$$
Now that the horizontal velocity has been determined, the governing equation for the droplet height can be derived using a material balance, yielding a partial differential equation for the droplet height as a function of horizontal position and time:
 $$\begin{eqnarray}\frac{\partial \bar{h}}{\partial \bar{t}}=-\bar{E}(\bar{r})-\frac{1}{\bar{r}}\frac{\partial }{\partial \bar{r}}(\bar{r}\bar{h}\tilde{\bar{v_{r}}}),\end{eqnarray}$$
where
 $\bar{E}(\bar{r})=x_{1}({E_{1}}^{\star }/{E_{2}}^{\star })+(1-x_{1})$
. There are two contributions to the change in height. The first is a decrease due to evaporation of the volatile liquid. The second term relates to flow driven by surface tension.
$\bar{E}(\bar{r})=x_{1}({E_{1}}^{\star }/{E_{2}}^{\star })+(1-x_{1})$
. There are two contributions to the change in height. The first is a decrease due to evaporation of the volatile liquid. The second term relates to flow driven by surface tension.
The solid volume fraction,
 ${\it\phi}$
, can be similarly derived to follow from
${\it\phi}$
, can be similarly derived to follow from
 $$\begin{eqnarray}\frac{\partial {\it\phi}}{\partial \bar{t}}=\frac{{\it\phi}\bar{E}(\bar{r})}{\bar{h}}-\tilde{\bar{v_{r}}}\frac{\partial {\it\phi}}{\partial \bar{r}}+\frac{{Pe_{p}}^{-1}}{\bar{r}\bar{h}}\frac{\partial }{\partial \bar{r}}\left(\bar{r}\bar{h}\frac{\partial {\it\phi}}{\partial \bar{r}}\right),\end{eqnarray}$$
where the Péclet number,
 $Pe_{p}$
, is defined as
$Pe_{p}$
, is defined as
 $Pe_{p}=(R^{2}{E_{2}}^{\star })/(HD_{p})$
.
$Pe_{p}=(R^{2}{E_{2}}^{\star })/(HD_{p})$
.
There are three contributions to the change in solid volume fraction: an increase due to evaporation of the volatile liquid, a decrease due to convection from regions of smaller volume fraction and a spatially variable diffusion.
A means to track the evolving liquid composition is also necessary. On a solid-free basis, one obtains
 $$\begin{eqnarray}\displaystyle \frac{\partial x_{1}}{\partial \bar{t}}=\frac{x_{1}(\bar{E^{\prime }}(\bar{r})+\bar{D_{p}}(\bar{r}))}{\bar{h}(1-{\it\phi})}-\tilde{\bar{v_{r}}}\frac{\partial x_{1}}{\partial \bar{r}}+\frac{{Pe_{ll}}^{-1}}{\bar{r}\bar{h}(1-{\it\phi})}\frac{\partial }{\partial \bar{r}}\left[\bar{r}\bar{h}(1-{\it\phi})\frac{\partial x_{1}}{\partial \bar{r}}\right], & & \displaystyle\end{eqnarray}$$
where
 $$\begin{eqnarray}\bar{E^{\prime }}(\bar{r})=\left[(x_{1}-1)\frac{{E_{1}}^{\star }}{{E_{2}}^{\star }}+(1-x_{1})\right]\quad \text{and}\quad \bar{D_{p}}(\bar{r})=\frac{{Pe_{p}}^{-1}}{\bar{r}}\frac{\partial }{\partial \bar{r}}\left(\bar{r}\bar{h}\frac{\partial {\it\phi}}{\partial \bar{r}}\right).\end{eqnarray}$$
There are three contributions to the liquid compositional change. The first is a decrease in mole fraction of component 1, due to evaporation of component 1 and the increase in solid volume fraction. The second is an increase due to convection from areas of larger concentration. The third is a spatially variable, liquid–liquid diffusion contribution.
2.4 Boundary and initial conditions
The governing equation for height is a fourth-order partial differential equation. Four boundary conditions are hence required. The edge of the droplet has zero height and the horizontal velocity at this point is zero, to ensure that the droplet remains pinned. The system is symmetrical at the central boundary
 $(\partial \bar{h}/\partial \bar{r}|_{\bar{r}=0},\partial {\it\phi}/\partial \bar{r}|_{\bar{r}=0},\partial x_{1}/\partial \bar{r}|_{\bar{r}=0}=0)$
and there is zero flux across the centreline.
$(\partial \bar{h}/\partial \bar{r}|_{\bar{r}=0},\partial {\it\phi}/\partial \bar{r}|_{\bar{r}=0},\partial x_{1}/\partial \bar{r}|_{\bar{r}=0}=0)$
and there is zero flux across the centreline.
As the volatile liquid evaporates, the volume fraction of solid material increases. This is most marked towards the edge of the droplet where the height is smallest. Soon, a close-packed or gelled region forms at the periphery, when
 ${\it\phi}={\it\phi}_{max}$
. The innermost position of this region is termed the liquid/gel front, since its position changes with time. In the gelled region, the mole fraction of the liquid components may still change, provided evaporation occurs, but the height and solid volume fraction are fixed. The governing equations for height and solid volume fraction derived in § 2.3 are only applicable for the liquid domain, between the centre and the liquid/gel front. When this situation arises, the outer boundary conditions need to be changed. In this scenario the height is fixed at the location of the liquid/gel front,
${\it\phi}={\it\phi}_{max}$
. The innermost position of this region is termed the liquid/gel front, since its position changes with time. In the gelled region, the mole fraction of the liquid components may still change, provided evaporation occurs, but the height and solid volume fraction are fixed. The governing equations for height and solid volume fraction derived in § 2.3 are only applicable for the liquid domain, between the centre and the liquid/gel front. When this situation arises, the outer boundary conditions need to be changed. In this scenario the height is fixed at the location of the liquid/gel front,
 $\bar{r}_{f}$
, and the horizontal velocity is found by equating the flux through the liquid/gel front with the liquid evaporated from within the gelled region as shown in figure 2. For close-packed solids this assumption is very good. We note that shrinkage will occur for polymer gels, and the inflow of liquid from the liquid domain might be insufficient to ensure that the height is fixed in the gelled region. However, our present work focuses more on the final, rather than intermediary, film profile. Therefore, for our purposes, whether a polymer gel would start to shrink immediately, or after the entire droplet has gelled, would not be important.
$\bar{r}_{f}$
, and the horizontal velocity is found by equating the flux through the liquid/gel front with the liquid evaporated from within the gelled region as shown in figure 2. For close-packed solids this assumption is very good. We note that shrinkage will occur for polymer gels, and the inflow of liquid from the liquid domain might be insufficient to ensure that the height is fixed in the gelled region. However, our present work focuses more on the final, rather than intermediary, film profile. Therefore, for our purposes, whether a polymer gel would start to shrink immediately, or after the entire droplet has gelled, would not be important.

Figure 2. Sketch of the balance used to find the horizontal velocity at the position of the liquid/gel front. The flux into the gelled region is matched to the total evaporation rate from the gelled region.
This is a volumetric average and hence there is no need to include a term for the rate of front progression,
 $\text{d}\bar{r}_{f}/\text{d}\bar{t}$
. The integral in the following equation can be numerically evaluated at each time step:
$\text{d}\bar{r}_{f}/\text{d}\bar{t}$
. The integral in the following equation can be numerically evaluated at each time step:
 $$\begin{eqnarray}\bar{\tilde{v_{r}}}|_{\bar{r}=\bar{r}_{f}}=\frac{(1-f_{h})\displaystyle \int _{\bar{r}_{f}}^{1}\bar{r}\bar{E}(\bar{r})}{\bar{r}_{f}\bar{h}_{f}}.\end{eqnarray}$$
The partial differential equation for the liquid composition (2.31) does not hold in the gelled region. It was previously assumed that volume fraction and height were functions of time and horizontal position. Instead the equation for the liquid composition in the gelled region becomes
 $$\begin{eqnarray}\frac{\partial x_{1}}{\partial \bar{t}}=\frac{x_{1}\bar{E^{\prime }}(\bar{r})}{\bar{h}(1-{\it\phi}_{max})}-\tilde{\bar{v_{r}}}\frac{\partial x_{1}}{\partial \bar{r}}+\frac{{Pe_{ll}}^{-1}}{\bar{r}\bar{h}}\frac{\partial }{\partial \bar{r}}\left(\bar{r}\bar{h}\frac{\partial x_{1}}{\partial \bar{r}}\right).\end{eqnarray}$$
The notable difference, compared to (2.31), is that there is no contribution from the change in polymer volume fraction.
Initially, the droplet is assumed to have a spherical cap shape,
 $\bar{h}=1-\bar{r}^{2}$
, and homogeneous distribution of solid material, at volume fraction
$\bar{h}=1-\bar{r}^{2}$
, and homogeneous distribution of solid material, at volume fraction
 ${\it\phi}_{0}$
. The liquid is initially homogeneously distributed, with mole fraction ratio
${\it\phi}_{0}$
. The liquid is initially homogeneously distributed, with mole fraction ratio
 ${x_{1}}_{0}$
:
${x_{1}}_{0}$
:
 $(1-{x_{1}}_{0})$
.
$(1-{x_{1}}_{0})$
.
2.5 Numerical implementation
A mixed scheme is chosen to solve the governing equation for height. Provided the time step is sufficiently small, the height change will be slower than changes to the spatial derivatives of height. This approximation enables the partial differential equation, (2.29), to be linearised. This is then solved using Newton’s method. An implicit formulation is used for the solid volume fraction and the mole fraction of liquid component 1.
2.6 Groups to examine
The numerical solutions in this paper will consider the relative volatility of the two liquid components, their initial mixing ratio, viscosity ratio and surface tension ratio, as well as the magnitude of the solid and liquid–liquid Péclet numbers.
3 Experimental details
The experiments use a flat, indium tin oxide (ITO) substrate. This consists of a 150 nm layer of conductive ITO atop a 7 mm slide of glass. The substrates were bathed in acetone, followed by isopropanol, to pre-wash and remove any hydrocarbon residues and dust. A Litrex 80 l inkjet printer was used to jet droplets of various formulations onto each substrate. The inks consist of a volatile liquid, or mixture of volatile liquids, and a polyfluorene, light-emitting polymer (LEP). The printer reports the jetting velocity, volume of the jetted droplet and the angle at which the ink leaves the inkjet head. The associated errors are also known.
Following jetting, the substrates were placed on a hot plate, held at
 $80\,^{\circ }\text{C}$
. At this temperature, the polymer diffusion becomes negligible (
$80\,^{\circ }\text{C}$
. At this temperature, the polymer diffusion becomes negligible (
 $Pe_{p}\sim 10^{2}$
) and the liquid–liquid diffusion in the liquid region (
$Pe_{p}\sim 10^{2}$
) and the liquid–liquid diffusion in the liquid region (
 $Pe_{ll}\sim 10^{-1}$
) is less dominant than at lower temperatures. In addition, the liquid–liquid diffusion will be hindered at the edge of the droplets due to polymer gelation.
$Pe_{ll}\sim 10^{-1}$
) is less dominant than at lower temperatures. In addition, the liquid–liquid diffusion will be hindered at the edge of the droplets due to polymer gelation.
Once the evaporation of the volatile liquid(s) was complete, a Zygo white-light interferometer was used to measure the final height profiles. The interferometer is capable of non-invasive measurements of height in the range 1 nm to
 $10\,000~{\rm\mu}\text{m}$
.
$10\,000~{\rm\mu}\text{m}$
.
We assume that the maximal volume fraction of polymer is only a weak function of the liquid composition and can therefore be taken as fixed at 0.080, as for a typical light-emitting polymer with
 $\text{MW}=10^{5}$
, in methyl benzoate (Eales et al.
Reference Eales, Dartnell, Goddard and Routh2015a
). Table 2 shows the properties of the inks used in the experiments.
$\text{MW}=10^{5}$
, in methyl benzoate (Eales et al.
Reference Eales, Dartnell, Goddard and Routh2015a
). Table 2 shows the properties of the inks used in the experiments.
Table 2. The constituents of each ink. For the liquids, the abbreviations are MB
 $=$
methyl benzoate, AN
$=$
methyl benzoate, AN
 $=$
anisole, OX
$=$
anisole, OX
 $=$
o-xylene and PB
$=$
o-xylene and PB
 $=$
pentyl benzene. The evaporation rates were measured by mass loss from a petri dish at room temperature. The surface tension ratios are calculated from measurements tabulated by Jasper (Reference Jasper1972) at
$=$
pentyl benzene. The evaporation rates were measured by mass loss from a petri dish at room temperature. The surface tension ratios are calculated from measurements tabulated by Jasper (Reference Jasper1972) at
 $80\,^{\circ }\text{C}$
.
$80\,^{\circ }\text{C}$
.

For droplets pinned at the edge, the final base width is
 $2R$
. Assuming an initial shape of a spherical cap, the initial droplet height,
$2R$
. Assuming an initial shape of a spherical cap, the initial droplet height,
 $H$
, can be estimated from the initial volume of the droplet:
$H$
, can be estimated from the initial volume of the droplet:
 $$\begin{eqnarray}H\sim \frac{2V}{{\rm\pi}R^{2}},\end{eqnarray}$$
where
 $V$
is the initial droplet volume and
$V$
is the initial droplet volume and
 $H$
and
$H$
and
 $R$
are the vertical and horizontal length scales of the jetted droplet. These enable the dimensional, experimental measurements of
$R$
are the vertical and horizontal length scales of the jetted droplet. These enable the dimensional, experimental measurements of
 $h$
as a function of
$h$
as a function of
 $r$
to be cast into dimensionless form, for direct comparison with other ink formulations. Note that for conciseness we do not report the
$r$
to be cast into dimensionless form, for direct comparison with other ink formulations. Note that for conciseness we do not report the
 $H$
and
$H$
and
 $R$
values for each experiment, but in all cases the droplets are thin since
$R$
values for each experiment, but in all cases the droplets are thin since
 $H^{2}/R^{2}\ll 1$
. The final dried height of the film can be determined from the plots shown later in § 5 by computing
$H^{2}/R^{2}\ll 1$
. The final dried height of the film can be determined from the plots shown later in § 5 by computing
 $H\bar{h}$
.
$H\bar{h}$
.
Evaporation from the region containing the gelled polymer causes the polymer gel to shrink. In the experiments, we say that the final volume fraction of polymer, following complete evaporation of all liquid, is
 ${\it\phi}={\it\phi}_{f}$
. For the numerical results, the height at the position of consideration is fixed when the polymer volume fraction reaches the gelation point,
${\it\phi}={\it\phi}_{f}$
. For the numerical results, the height at the position of consideration is fixed when the polymer volume fraction reaches the gelation point,
 ${\it\phi}={\it\phi}_{max}$
. It does not take into account the shrinkage of the gel (
${\it\phi}={\it\phi}_{max}$
. It does not take into account the shrinkage of the gel (
 ${\it\phi}_{f}\neq {\it\phi}_{max}$
). To enable comparison, the experimental height is plotted as
${\it\phi}_{f}\neq {\it\phi}_{max}$
). To enable comparison, the experimental height is plotted as
 ${\it\phi}_{f}\bar{h}/{\it\phi}_{max}$
against
${\it\phi}_{f}\bar{h}/{\it\phi}_{max}$
against
 $\bar{r}$
. To determine the final polymer volume fraction in each experiment, we match the polymer quantity obtained from integration of the experimental profiles to the initial polymer quantity:
$\bar{r}$
. To determine the final polymer volume fraction in each experiment, we match the polymer quantity obtained from integration of the experimental profiles to the initial polymer quantity:
 $$\begin{eqnarray}{\it\phi}_{f}=\frac{V{\it\phi}_{0}}{0.5\displaystyle \int _{-R}^{R}2{\rm\pi}rh\,\text{d}r}.\end{eqnarray}$$
4 Numerical results and interpretation
For conciseness, the results shown in §§ 4.1–4.6 are for the first horizontal velocity limit, explained in § 2.3. This corresponds to the condition of zero shear stress on the droplet surface. Comparative results are shown for the second horizontal velocity limit, a dominant Marangoni flow, in § 4.7.
4.1 Relative volatility
To examine the influence of the relative volatilities of the liquid components, the viscosity and surface tension ratios are set to unity. In addition, the convection-dominated regime is initially considered, so that both the polymer and liquid–liquid Péclet numbers tend to infinity. The final film shape is shown in figure 3 as a function of relative volatility. It should be noted that the case of
 ${E_{1}}^{\star }/{E_{2}}^{\star }=1$
is equivalent to a single-liquid system.
${E_{1}}^{\star }/{E_{2}}^{\star }=1$
is equivalent to a single-liquid system.

Figure 3. Numerical results for the final film shape as a function of the relative volatility. The results are shown for
 $Ca=10^{-3}$
,
$Ca=10^{-3}$
,
 ${\it\phi}_{0}=0.032$
,
${\it\phi}_{0}=0.032$
,
 ${\it\phi}_{max}=0.080$
,
${\it\phi}_{max}=0.080$
,
 $f_{h}=0.95$
,
$f_{h}=0.95$
,
 ${{\it\mu}_{1}}^{\star }/{{\it\mu}_{2}}^{\star }=1$
,
${{\it\mu}_{1}}^{\star }/{{\it\mu}_{2}}^{\star }=1$
,
 ${{\it\gamma}_{1}}^{\star }/{{\it\gamma}_{2}}^{\star }=1$
,
${{\it\gamma}_{1}}^{\star }/{{\it\gamma}_{2}}^{\star }=1$
,
 ${x_{1}}_{0}=0.5$
,
${x_{1}}_{0}=0.5$
,
 $Pe_{p}\rightarrow \infty$
and
$Pe_{p}\rightarrow \infty$
and
 $Pe_{ll}\rightarrow \infty$
.
$Pe_{ll}\rightarrow \infty$
.
The coffee-ring effect is hindered when the relative volatility is increased. The peak ring height, at the edge, is reduced and more material is deposited centrally. Soon after evaporation commences, the composition within the droplet depends on the horizontal position. This can be understood by examining the denominator in (2.31). At the edge of the droplet, the height of the droplet is very small, therefore the change in composition, due to the different evaporation rates of the two liquid components, is largest at this point. The edge becomes rich in the less volatile liquid and depleted in the more volatile liquid. Hence, the evaporation rate is smaller at the edge and larger at the centre when compared to a single-liquid system. The effect, therefore, is a reduction in the strength of the outward capillary flow required to maintain an equilibrium, spherical cap shape. Thus, less polymer is transported towards the contact line and less coffee-ring formation is observed. With increasing relative volatility, the less volatile-rich region becomes less confined to the periphery, as can be seen in figure 4. This reduces the coffee-ring effect further.

Figure 4. The liquid composition profile after a dimensionless time
 $\bar{t}=0.01$
. The results are shown for
$\bar{t}=0.01$
. The results are shown for
 $Ca=10^{-3}$
,
$Ca=10^{-3}$
,
 ${\it\phi}_{0}=0.032$
,
${\it\phi}_{0}=0.032$
,
 ${\it\phi}_{max}=0.080$
,
${\it\phi}_{max}=0.080$
,
 $f_{h}=0.95$
,
$f_{h}=0.95$
,
 ${{\it\mu}_{1}}^{\star }/{{\it\mu}_{2}}^{\star }=1$
,
${{\it\mu}_{1}}^{\star }/{{\it\mu}_{2}}^{\star }=1$
,
 ${{\it\gamma}_{1}}^{\star }/{{\it\gamma}_{2}}^{\star }=1$
,
${{\it\gamma}_{1}}^{\star }/{{\it\gamma}_{2}}^{\star }=1$
,
 ${x_{1}}_{0}=0.5$
,
${x_{1}}_{0}=0.5$
,
 $Pe_{p}\rightarrow \infty$
and
$Pe_{p}\rightarrow \infty$
and
 $Pe_{ll}\rightarrow \infty$
.
$Pe_{ll}\rightarrow \infty$
.
As a measure of the extent of the coffee-ring effect, we consider the ratio of the peak height of the deposited ring to the final height at the centre of the dried film. Figure 5 shows this measure as a function of the relative volatility. It shows that the coffee-ring effect is reduced when the relative volatility is increased. There are, however, diminishing returns at higher values of
 ${E_{1}}^{\star }/{E_{2}}^{\star }$
.
${E_{1}}^{\star }/{E_{2}}^{\star }$
.

Figure 5. The ratio of the peak height of the deposited ring to the final central height, as a function of the relative volatility. The results are shown for
 $Ca=10^{-3}$
,
$Ca=10^{-3}$
,
 ${\it\phi}_{0}=0.032$
,
${\it\phi}_{0}=0.032$
,
 ${\it\phi}_{max}=0.080$
,
${\it\phi}_{max}=0.080$
,
 $f_{h}=0.95$
,
$f_{h}=0.95$
,
 ${{\it\mu}_{1}}^{\star }/{{\it\mu}_{2}}^{\star }=1$
,
${{\it\mu}_{1}}^{\star }/{{\it\mu}_{2}}^{\star }=1$
,
 ${{\it\gamma}_{1}}^{\star }/{{\it\gamma}_{2}}^{\star }=1$
,
${{\it\gamma}_{1}}^{\star }/{{\it\gamma}_{2}}^{\star }=1$
,
 ${x_{1}}_{0}=0.5$
,
${x_{1}}_{0}=0.5$
,
 $Pe_{p}\rightarrow \infty$
and
$Pe_{p}\rightarrow \infty$
and
 $Pe_{ll}\rightarrow \infty$
.
$Pe_{ll}\rightarrow \infty$
.
Depending on the desired final film shape, the relative volatility of the two liquids can be optimised. For example, if one wishes to achieve as flat a film as possible, there will be an optimal relative volatility. Figure 3 suggests that this would be at a relative volatility of greater than
 $10$
. If it was desired to obtain a deposit in the shape of a spherical cap, a much larger relative volatility would be appropriate.
$10$
. If it was desired to obtain a deposit in the shape of a spherical cap, a much larger relative volatility would be appropriate.
4.2 Liquid–liquid Péclet number
In figure 6, the film shape resulting from droplets with a variety of liquid–liquid Péclet numbers can be seen. At infinite Péclet number, diffusion is negligible. The mechanism outlined in § 4.1 occurs and the coffee-ring effect is reduced when compared to a single-liquid system or a system in which the liquid volatilities are matched. In the presence of weak liquid–liquid diffusion, i.e.
 $Pe_{ll}=10^{1}$
, liquid material is redistributed within the droplet. The result is that the less volatile-rich region at the edge diminishes, due to the increased presence of the more volatile liquid. Subsequently, there will be a larger evaporation rate near the edge than in the
$Pe_{ll}=10^{1}$
, liquid material is redistributed within the droplet. The result is that the less volatile-rich region at the edge diminishes, due to the increased presence of the more volatile liquid. Subsequently, there will be a larger evaporation rate near the edge than in the
 $Pe_{ll}\rightarrow \infty$
case. It will take less time for the polymer to reach the gelation volume fraction and so there is less time for the outward capillary flow to convect polymer before the height is fixed by polymer gelation. The coffee-ring effect is further reduced, albeit only slightly.
$Pe_{ll}\rightarrow \infty$
case. It will take less time for the polymer to reach the gelation volume fraction and so there is less time for the outward capillary flow to convect polymer before the height is fixed by polymer gelation. The coffee-ring effect is further reduced, albeit only slightly.

Figure 6. Final film shape as a function of the liquid–liquid Péclet number. The results are shown for
 $Ca=10^{-3}$
,
$Ca=10^{-3}$
,
 ${\it\phi}_{0}=0.032$
,
${\it\phi}_{0}=0.032$
,
 ${\it\phi}_{max}=0.080$
,
${\it\phi}_{max}=0.080$
,
 $f_{h}=0.95$
,
$f_{h}=0.95$
,
 ${E_{1}}^{\star }/{E_{2}}^{\star }=10$
,
${E_{1}}^{\star }/{E_{2}}^{\star }=10$
,
 ${{\it\mu}_{1}}^{\star }/{{\it\mu}_{2}}^{\star }=1$
,
${{\it\mu}_{1}}^{\star }/{{\it\mu}_{2}}^{\star }=1$
,
 ${{\it\gamma}_{1}}^{\star }/{{\it\gamma}_{2}}^{\star }=1$
,
${{\it\gamma}_{1}}^{\star }/{{\it\gamma}_{2}}^{\star }=1$
,
 ${x_{1}}_{0}=0.5$
and
${x_{1}}_{0}=0.5$
and
 $Pe_{p}\rightarrow \infty$
.
$Pe_{p}\rightarrow \infty$
.
The optimal improvement in film shape is achieved at approximately
 $Pe_{ll}=1$
. Below this, diffusion dominates and causes equilibration in liquid composition throughout the droplet. This removes the mechanism for the improvement in film shape by ensuring a spatially uniform evaporation profile across the droplet surface. At
$Pe_{ll}=1$
. Below this, diffusion dominates and causes equilibration in liquid composition throughout the droplet. This removes the mechanism for the improvement in film shape by ensuring a spatially uniform evaporation profile across the droplet surface. At
 $Pe_{ll}=0$
, the system essentially behaves like a single-liquid system but with an evaporation rate that is initially the midpoint of
$Pe_{ll}=0$
, the system essentially behaves like a single-liquid system but with an evaporation rate that is initially the midpoint of
 ${E_{1}}^{\star }$
and
${E_{1}}^{\star }$
and
 ${E_{2}}^{\star }$
, and gradually decreases with time, as the mole fraction of more volatile liquid decreases.
${E_{2}}^{\star }$
, and gradually decreases with time, as the mole fraction of more volatile liquid decreases.
4.3 Initial liquid composition
The influence of initial liquid composition on final film shape is considered, for a system in which the viscosities and surface tensions of the two liquid components are matched. The trend with surface tension ratio is discussed later in § 4.5. It should be noted that the initial liquid composition has an influence on this trend also. In figure 7, the final shape is shown for a variety of initial mixtures, with a relative volatility of 10 and for a polymer content
 ${\it\phi}_{0}=0.032$
and
${\it\phi}_{0}=0.032$
and
 ${\it\phi}_{max}=0.080$
.
${\it\phi}_{max}=0.080$
.

Figure 7. Final film shape as a function of the initial mole fraction of liquid 1. The results are shown for
 $Ca=10^{-3}$
,
$Ca=10^{-3}$
,
 ${\it\phi}_{0}=0.032$
,
${\it\phi}_{0}=0.032$
,
 ${\it\phi}_{max}=0.080$
,
${\it\phi}_{max}=0.080$
,
 $f_{h}=0.95$
,
$f_{h}=0.95$
,
 ${E_{1}}^{\star }/{E_{2}}^{\star }=10$
,
${E_{1}}^{\star }/{E_{2}}^{\star }=10$
,
 ${{\it\mu}_{1}}^{\star }/{{\it\mu}_{2}}^{\star }=1$
,
${{\it\mu}_{1}}^{\star }/{{\it\mu}_{2}}^{\star }=1$
,
 ${{\it\gamma}_{1}}^{\star }/{{\it\gamma}_{2}}^{\star }=1$
,
${{\it\gamma}_{1}}^{\star }/{{\it\gamma}_{2}}^{\star }=1$
,
 $Pe_{p}\rightarrow \infty$
and
$Pe_{p}\rightarrow \infty$
and
 $Pe_{ll}\rightarrow \infty$
.
$Pe_{ll}\rightarrow \infty$
.
At a fixed relative volatility and polymer content, there is an optimal initial mixing ratio that gives rise to the most improvement in film shape. In figure 8, the ratio of peak ring height to final central height is plotted as a function of the initial mole fraction of the more volatile liquid. When the initial mole fraction is
 $0$
or
$0$
or
 $1$
the system is essentially a single-liquid problem and no improvement in film shape due to the relative volatility mechanism occurs. In this example, the optimal initial composition is
$1$
the system is essentially a single-liquid problem and no improvement in film shape due to the relative volatility mechanism occurs. In this example, the optimal initial composition is
 ${x_{1}}_{opt}=0.48$
for a relative volatility of 10 and
${x_{1}}_{opt}=0.48$
for a relative volatility of 10 and
 ${x_{1}}_{opt}=0.54$
for a relative volatility of 20.
${x_{1}}_{opt}=0.54$
for a relative volatility of 20.

Figure 8. The ratio of the peak height of the deposited ring to the final central height, as a function of the initial mole fraction of liquid 1 and the relative volatility. The results are shown for
 $Ca=10^{-3}$
,
$Ca=10^{-3}$
,
 ${\it\phi}_{0}=0.032$
,
${\it\phi}_{0}=0.032$
,
 ${\it\phi}_{max}=0.080$
,
${\it\phi}_{max}=0.080$
,
 $f_{h}=0.95$
,
$f_{h}=0.95$
,
 ${{\it\mu}_{1}}^{\star }/{{\it\mu}_{2}}^{\star }=1$
,
${{\it\mu}_{1}}^{\star }/{{\it\mu}_{2}}^{\star }=1$
,
 ${{\it\gamma}_{1}}^{\star }/{{\it\gamma}_{2}}^{\star }=1$
,
${{\it\gamma}_{1}}^{\star }/{{\it\gamma}_{2}}^{\star }=1$
,
 $Pe_{p}\rightarrow \infty$
and
$Pe_{p}\rightarrow \infty$
and
 $Pe_{ll}\rightarrow \infty$
.
$Pe_{ll}\rightarrow \infty$
.
The initial and maximum volume fractions of the polymer are also important. In figure 9, the final shape is shown as a function of the initial liquid composition, at a much smaller polymer volume fraction ratio,
 ${\it\phi}_{0}/{\it\phi}_{max}$
, with
${\it\phi}_{0}/{\it\phi}_{max}$
, with
 ${\it\phi}_{0}=0.0032$
and
${\it\phi}_{0}=0.0032$
and
 ${\it\phi}_{max}=0.1600$
. The evaporation suppression factor for these simulations,
${\it\phi}_{max}=0.1600$
. The evaporation suppression factor for these simulations,
 $f_{h}$
, is set to unity, in order to avoid a complication concerning polymer volume fraction to be discussed later, in § 4.7. As the polymer volume fraction ratio is decreased, the optimal initial mole fraction of the more volatile component increases. For smaller polymer contents, a larger
$f_{h}$
, is set to unity, in order to avoid a complication concerning polymer volume fraction to be discussed later, in § 4.7. As the polymer volume fraction ratio is decreased, the optimal initial mole fraction of the more volatile component increases. For smaller polymer contents, a larger
 ${x_{1}}_{0}$
causes polymer gelation to occur much sooner. There is hence less time for the outward capillary flow to drive coffee-ring formation before the height becomes fixed.
${x_{1}}_{0}$
causes polymer gelation to occur much sooner. There is hence less time for the outward capillary flow to drive coffee-ring formation before the height becomes fixed.

Figure 9. Final film shape as a function of the initial mole fraction of liquid 1. The results are shown for
 $Ca=10^{-3}$
,
$Ca=10^{-3}$
,
 ${\it\phi}_{0}=0.0032$
,
${\it\phi}_{0}=0.0032$
,
 ${\it\phi}_{max}=0.160$
,
${\it\phi}_{max}=0.160$
,
 $f_{h}=0.95$
,
$f_{h}=0.95$
,
 ${E_{1}}^{\star }/{E_{2}}^{\star }=10$
,
${E_{1}}^{\star }/{E_{2}}^{\star }=10$
,
 ${{\it\mu}_{1}}^{\star }/{{\it\mu}_{2}}^{\star }=1$
,
${{\it\mu}_{1}}^{\star }/{{\it\mu}_{2}}^{\star }=1$
,
 ${{\it\gamma}_{1}}^{\star }/{{\it\gamma}_{2}}^{\star }=1$
,
${{\it\gamma}_{1}}^{\star }/{{\it\gamma}_{2}}^{\star }=1$
,
 $Pe_{p}\rightarrow \infty$
and
$Pe_{p}\rightarrow \infty$
and
 $Pe_{ll}\rightarrow \infty$
.
$Pe_{ll}\rightarrow \infty$
.
4.4 Viscosity ratio
As discussed in § 2.2, the capillary number is small: surface tension dominates over viscous effects. For this reason, the viscosity ratio is unimportant. It does alter the horizontal velocity slightly, but it does not alter the magnitude of the horizontal velocity and so the resultant effect on film shape is marginal. Figure 10 shows the film shape for various values of the viscosity ratio, which results in an appreciable change to the final film only when it is very large, i.e. the viscosity of the more volatile component is three orders of magnitude larger than the viscosity of the less volatile liquid. This is because the more volatile-rich central region has a reduced mobility, so the outward capillary flow is hindered. Situations with such a large differential in liquid viscosity are probably physically unreasonable.

Figure 10. Final film shape as a function of the viscosity ratio. The results are shown for
 $Ca=10^{-3}$
,
$Ca=10^{-3}$
,
 ${\it\phi}_{0}=0.032$
,
${\it\phi}_{0}=0.032$
,
 ${\it\phi}_{max}=0.080$
,
${\it\phi}_{max}=0.080$
,
 $f_{h}=0.95$
,
$f_{h}=0.95$
,
 ${E_{1}}^{\star }/{E_{2}}^{\star }=10$
,
${E_{1}}^{\star }/{E_{2}}^{\star }=10$
,
 ${{\it\gamma}_{1}}^{\star }/{{\it\gamma}_{2}}^{\star }=1$
,
${{\it\gamma}_{1}}^{\star }/{{\it\gamma}_{2}}^{\star }=1$
,
 ${x_{1}}_{0}=0.5$
,
${x_{1}}_{0}=0.5$
,
 $Pe_{p}\rightarrow \infty$
and
$Pe_{p}\rightarrow \infty$
and
 $Pe_{ll}\rightarrow \infty$
.
$Pe_{ll}\rightarrow \infty$
.
4.5 Surface tension ratio
By using typical values for the surface occupancy of molecules in (2.6), quoted by Suri & Ramakrishna (Reference Suri and Ramakrishna1968), we observe no appreciable difference in predicted film shape between using a linear fit and the nonlinear model of equation (2.6) for the surface tension of the binary liquid mixture.
There are two different situations. Either the more volatile liquid has a higher surface tension than the less volatile liquid,
 ${\it\gamma}_{1}/{\it\gamma}_{2}>1$
, or it has a lower surface tension,
${\it\gamma}_{1}/{\it\gamma}_{2}>1$
, or it has a lower surface tension,
 ${\it\gamma}_{1}/{\it\gamma}_{2}<1$
. As can be seen in figure 11, there is little difference in film shape in the latter case. When the more volatile liquid has a higher surface tension, however, we observe some interesting phenomena. There is a rapid decrease in height towards the centre of the droplet and a large increase in height towards the periphery. This leads to a crash in the code, which cannot track the height of the droplet accurately. It is believed that the reason for this is an instability in the height caused by the compositional and resulting surface tension gradients within the droplet driving a large internal flow. This will be investigated further in § 6.
${\it\gamma}_{1}/{\it\gamma}_{2}<1$
. As can be seen in figure 11, there is little difference in film shape in the latter case. When the more volatile liquid has a higher surface tension, however, we observe some interesting phenomena. There is a rapid decrease in height towards the centre of the droplet and a large increase in height towards the periphery. This leads to a crash in the code, which cannot track the height of the droplet accurately. It is believed that the reason for this is an instability in the height caused by the compositional and resulting surface tension gradients within the droplet driving a large internal flow. This will be investigated further in § 6.

Figure 11. Final film shape as a function of the surface tension ratio. The results are shown for
 $Ca=10^{-3}$
,
$Ca=10^{-3}$
,
 ${\it\phi}_{0}=0.032$
,
${\it\phi}_{0}=0.032$
,
 ${\it\phi}_{max}=0.080$
,
${\it\phi}_{max}=0.080$
,
 $f_{h}=0.95$
,
$f_{h}=0.95$
,
 ${E_{1}}^{\star }/{E_{2}}^{\star }=10$
,
${E_{1}}^{\star }/{E_{2}}^{\star }=10$
,
 ${{\it\mu}_{1}}^{\star }/{{\it\mu}_{2}}^{\star }=1$
,
${{\it\mu}_{1}}^{\star }/{{\it\mu}_{2}}^{\star }=1$
,
 ${x_{1}}_{0}=0.5$
,
${x_{1}}_{0}=0.5$
,
 $Pe_{p}\rightarrow \infty$
and
$Pe_{p}\rightarrow \infty$
and
 $Pe_{ll}\rightarrow \infty$
.
$Pe_{ll}\rightarrow \infty$
.
4.6 Solid Péclet number
The results shown up to this point consider the case of infinite polymer Péclet number. We extend this to consider weak diffusion. When the Péclet number decreases, diffusion of the polymer becomes more appreciable, and there is inward diffusion of polymer, down the gradient in polymer volume fraction. This results in a decrease in the coffee-ring effect. Less material is deposited towards the edge and more is deposited centrally. Figure 12 shows the final film shape as a function of the polymer Péclet number.

Figure 12. Final film shape as a function of the polymer Péclet number. The results are shown for
 $Ca=10^{-3}$
,
$Ca=10^{-3}$
,
 ${\it\phi}_{0}=0.032$
,
${\it\phi}_{0}=0.032$
,
 ${\it\phi}_{max}=0.080$
,
${\it\phi}_{max}=0.080$
,
 $f_{h}=0.95$
,
$f_{h}=0.95$
,
 ${E_{1}}^{\star }/{E_{2}}^{\star }=10$
,
${E_{1}}^{\star }/{E_{2}}^{\star }=10$
,
 ${{\it\mu}_{1}}^{\star }/{{\it\mu}_{2}}^{\star }=1$
,
${{\it\mu}_{1}}^{\star }/{{\it\mu}_{2}}^{\star }=1$
,
 ${{\it\gamma}_{1}}^{\star }/{{\it\gamma}_{2}}^{\star }=1$
,
${{\it\gamma}_{1}}^{\star }/{{\it\gamma}_{2}}^{\star }=1$
,
 ${x_{1}}_{0}=0.5$
and
${x_{1}}_{0}=0.5$
and
 $Pe_{ll}\rightarrow \infty$
.
$Pe_{ll}\rightarrow \infty$
.
4.7 Comparison of the two horizontal velocity limits
The results in §§ 4.1–4.6 consider only the first horizontal velocity limit, stated in (2.26). It is important to consider what happens if the horizontal velocity is closer to the second limit, given in (2.28). In any situation, the actual horizontal velocity will be between these two extremes.
The final film shape is shown in figure 13 for a typical scenario with surface tension ratio
 ${{\it\gamma}_{1}}^{\star }/{{\it\gamma}_{2}}^{\star }<1$
.
${{\it\gamma}_{1}}^{\star }/{{\it\gamma}_{2}}^{\star }<1$
.

Figure 13. Final film shape for the two limits of horizontal velocity. The results are shown for
 $Ca=10^{-3}$
,
$Ca=10^{-3}$
,
 ${\it\phi}_{0}=0.032$
,
${\it\phi}_{0}=0.032$
,
 ${\it\phi}_{max}=0.080$
,
${\it\phi}_{max}=0.080$
,
 $f_{h}=1.0$
,
$f_{h}=1.0$
,
 ${E_{1}}^{\star }/{E_{2}}^{\star }=10$
,
${E_{1}}^{\star }/{E_{2}}^{\star }=10$
,
 ${{\it\mu}_{1}}^{\star }/{{\it\mu}_{2}}^{\star }=1$
,
${{\it\mu}_{1}}^{\star }/{{\it\mu}_{2}}^{\star }=1$
,
 ${{\it\gamma}_{1}}^{\star }/{{\it\gamma}_{2}}^{\star }=0.9$
,
${{\it\gamma}_{1}}^{\star }/{{\it\gamma}_{2}}^{\star }=0.9$
,
 ${x_{1}}_{0}=0.5$
,
${x_{1}}_{0}=0.5$
,
 $Pe_{p}\rightarrow \infty$
and
$Pe_{p}\rightarrow \infty$
and
 $Pe_{ll}\rightarrow \infty$
.
$Pe_{ll}\rightarrow \infty$
.
In the second horizontal velocity limit, a strong outward Marangoni flow convects solid to the edge and results in an enhanced coffee-ring formation.
It is important to note that a numerical solution is also not possible for the second horizontal velocity limit, when the surface tension ratio
 ${{\it\gamma}_{1}}^{\star }/{{\it\gamma}_{2}}^{\star }>1$
. It is thought that this is due to the onset of an instability and will be examined further in the linear stability analysis of § 6. We note that prior to the crash in the code, the solids fraction falls dramatically near the edge. This could be consistent with a strong inward Marangoni flow and associated depinning of the contact line, resulting in a deposit only at the droplet centre, as widely reported in the literature, one example being Babatunde et al. (Reference Babatunde, Hong, Makaso and Fukai2013).
${{\it\gamma}_{1}}^{\star }/{{\it\gamma}_{2}}^{\star }>1$
. It is thought that this is due to the onset of an instability and will be examined further in the linear stability analysis of § 6. We note that prior to the crash in the code, the solids fraction falls dramatically near the edge. This could be consistent with a strong inward Marangoni flow and associated depinning of the contact line, resulting in a deposit only at the droplet centre, as widely reported in the literature, one example being Babatunde et al. (Reference Babatunde, Hong, Makaso and Fukai2013).
5 Experimental results and discussion
5.1 Initial liquid composition
Figure 14 shows the film shape resulting from inks A–E. The initial composition appears to have a subtle effect. This is because liquid–liquid diffusion is significant and the tendency is to equilibrate the liquid composition within the droplet, thus removing or at least reducing the extent of the relative volatility mechanism proposed in § 4.1. Previous works, for example Fischer (Reference Fischer2002) and Eales et al. (Reference Eales, Dartnell, Goddard and Routh2015a
), have shown that coffee-ring formation is accentuated by edge-enhanced evaporation. Despite the capillary number being small in both cases, the evaporation rate profiles across droplets of methyl benzoate and anisole could be different. This could explain the repeatable difference in the final shapes for methyl benzoate and anisole, shown in figure 14. It should be noted that the error bars are not shown in figure 14, for clarity, but the experimental error is
 $\pm 10\,\%$
by height and cannot explain the trend.
$\pm 10\,\%$
by height and cannot explain the trend.

Figure 14. Experimental results for the final film profile from anisole/methyl benzoate inks A–E, as a function of the initial mole fraction of anisole. The properties of inks A–E can be found in table 2.
5.2 Relative volatility
The plots in figure 15 represent the final film profiles for inks A, C and F. There appears to be an improvement in film shape as the relative volatility is increased. Less material is deposited at the edge and more is deposited at the centre. The extent of coffee-ring formation is reduced. As the relative volatility is increased, we expect there to be a larger differential in evaporation rate between the centre and edge.

Figure 15. Experimental results for the final film profile as a function of the relative volatility. The inks shown are A, C and F. The properties of these inks can be found in table 2.
This agrees with the work of Teichler et al. (Reference Teichler, Perelaer and Schubert2013), who found that the surface roughness of films decreases when the difference in liquid boiling points is increased.
It was previously argued that the capillary number is very small, such that surface tension effects dominate. This was true for the majority of droplets under consideration. In the case of ink F, however, the droplet wetted the ITO much better and the capillary number was of order
 $10^{-1}$
. Whilst surface tension effects are still important, this could make a small contribution to the improvement in shape observed in figure 15, as predicted by our previous work (Eales et al.
Reference Eales, Dartnell, Goddard and Routh2015a
).
$10^{-1}$
. Whilst surface tension effects are still important, this could make a small contribution to the improvement in shape observed in figure 15, as predicted by our previous work (Eales et al.
Reference Eales, Dartnell, Goddard and Routh2015a
).

Figure 16. Experimental results for the final film profile as a function of the surface tension ratio. The inset shows the white-light interferometer data for the anisole/pentyl benzene droplet (ink H). A primary coffee ring was observed, with a satellite at a seemingly random orientation. The inks shown are G and H. The properties of these inks can be found in table 2.
5.3 Surface tension ratio
In figure 16, the final film shape is shown for the anisole/methyl benzoate mixture of ink G and for the anisole/pentyl benzene mixture of ink H. For the former, the surface tension ratio
 ${{\it\gamma}_{1}}^{\star }/{{\it\gamma}_{2}}^{\star }=0.93$
at
${{\it\gamma}_{1}}^{\star }/{{\it\gamma}_{2}}^{\star }=0.93$
at
 $80\,^{\circ }\text{C}$
and the resultant film shape is similar to those previously observed. For the latter, however, the surface tension ratio,
$80\,^{\circ }\text{C}$
and the resultant film shape is similar to those previously observed. For the latter, however, the surface tension ratio,
 ${{\it\gamma}_{1}}^{\star }/{{\it\gamma}_{2}}^{\star }$
, is
${{\it\gamma}_{1}}^{\star }/{{\it\gamma}_{2}}^{\star }$
, is
 $1.19$
and an extreme coffee-ring formation results. There is minimal material deposited centrally within the droplet and a region of intense deposition at the periphery. These results were repeatable. This would appear to be consistent with the dynamics of the numerical solution under these conditions (see figure 11). Interestingly, the cross-section for
$1.19$
and an extreme coffee-ring formation results. There is minimal material deposited centrally within the droplet and a region of intense deposition at the periphery. These results were repeatable. This would appear to be consistent with the dynamics of the numerical solution under these conditions (see figure 11). Interestingly, the cross-section for
 ${{\it\gamma}_{1}}^{\star }/{{\it\gamma}_{2}}^{\star }=1.19$
in figure 16 shows a larger coffee-ring height on one side and a smaller one on the other, with what appears to be a satellite coffee ring (see the cross-section of the final film profile shown in the inset at the top right of figure 16). Looking at the 3D deposit, this occurred repeatably but at a seemingly random orientation. The secondary crescent-shaped ring of much smaller height suggests that there is an overspill of the droplet, beyond the original confines of the edge. The instability and the associated strong outward flow are a possible cause of this phenomenon. Henceforth we will say that an instability has occurred if we observe a satellite coffee ring.
${{\it\gamma}_{1}}^{\star }/{{\it\gamma}_{2}}^{\star }=1.19$
in figure 16 shows a larger coffee-ring height on one side and a smaller one on the other, with what appears to be a satellite coffee ring (see the cross-section of the final film profile shown in the inset at the top right of figure 16). Looking at the 3D deposit, this occurred repeatably but at a seemingly random orientation. The secondary crescent-shaped ring of much smaller height suggests that there is an overspill of the droplet, beyond the original confines of the edge. The instability and the associated strong outward flow are a possible cause of this phenomenon. Henceforth we will say that an instability has occurred if we observe a satellite coffee ring.
6 A linear stability analysis of the lubrication model
6.1 Description and methodology
We wish to determine any situations in which the ink droplets, printed onto our substrates, will have an instability in the height, due to the growth of perturbations. In the eventuality that they become unstable, it is desired to understand the mechanism driving the growth of perturbations. The presence of polymer is ignored, as are the polymer and liquid–liquid diffusion, because these are likely to have a stabilising effect. A detailed analysis of how to avoid instabilities may include these also, but this falls beyond the scope of the present work. The linear stability analysis is performed on (2.29) and (2.31), using base states
 $\bar{h}_{b}$
and
$\bar{h}_{b}$
and
 $\bar{x}_{1,b}$
and small perturbation terms
$\bar{x}_{1,b}$
and small perturbation terms
 $\hat{\bar{h}}$
and
$\hat{\bar{h}}$
and
 $\hat{\bar{x}}_{1}$
, such that
$\hat{\bar{x}}_{1}$
, such that
 $$\begin{eqnarray}\displaystyle & \displaystyle \bar{h}=\bar{h}_{b}+\hat{\bar{h}}\text{e}^{(\text{i}k\bar{r}+{\it\omega}\bar{t})}, & \displaystyle\end{eqnarray}$$
 $$\begin{eqnarray}\displaystyle & \displaystyle \bar{x}_{1}=\bar{x}_{1,b}+\hat{\bar{x}}_{1}\text{e}^{(\text{i}k\bar{r}+{\it\omega}\bar{t})}. & \displaystyle\end{eqnarray}$$
In (6.1) and (6.2),
 $k$
is the wavenumber and
$k$
is the wavenumber and
 ${\it\omega}$
is the growth rate. To determine the stability, it is necessary to determine the sign of
${\it\omega}$
is the growth rate. To determine the stability, it is necessary to determine the sign of
 ${\it\omega}$
. Expressions can be found for each of the terms in the partial differential equations (2.29) and (2.31), ignoring all nonlinear perturbation terms. The expressions resulting from consideration of the real part of the perturbation terms alone can be summarised as
${\it\omega}$
. Expressions can be found for each of the terms in the partial differential equations (2.29) and (2.31), ignoring all nonlinear perturbation terms. The expressions resulting from consideration of the real part of the perturbation terms alone can be summarised as
 $$\begin{eqnarray}{\it\omega}\left(\begin{array}{@{}c@{}}\hat{\bar{h}}\\ \hat{\bar{x}}_{1}\end{array}\!\!\right)=\left(\begin{array}{@{}cc@{}}\unicode[STIX]{x1D608}_{11} & \unicode[STIX]{x1D608}_{12}\\ \unicode[STIX]{x1D608}_{21} & \unicode[STIX]{x1D608}_{22}\end{array}\right)\left(\begin{array}{@{}c@{}}\hat{\bar{h}}\\ \hat{\bar{x}}_{1}\end{array}\!\!\right),\end{eqnarray}$$
where the matrix coefficients
 $\unicode[STIX]{x1D608}_{ij}$
represent the coefficient of growth for perturbation
$\unicode[STIX]{x1D608}_{ij}$
represent the coefficient of growth for perturbation
 $i$
with respect to the introduced perturbation
$i$
with respect to the introduced perturbation
 $j$
. For conciseness, the full form of these matrix coefficients is reported in supporting information available at http://dx.doi.org/10.1017/jfm.2016.163. Generally, the coefficients
$j$
. For conciseness, the full form of these matrix coefficients is reported in supporting information available at http://dx.doi.org/10.1017/jfm.2016.163. Generally, the coefficients
 $\unicode[STIX]{x1D608}_{ij}$
are functions of
$\unicode[STIX]{x1D608}_{ij}$
are functions of
 $Ca$
,
$Ca$
,
 $k$
,
$k$
,
 $\bar{r}$
,
$\bar{r}$
,
 $({E_{1}}^{\star }/{E_{2}}^{\star }-1)$
,
$({E_{1}}^{\star }/{E_{2}}^{\star }-1)$
,
 $({{\it\gamma}_{1}}^{\star }/{{\it\gamma}_{2}}^{\star }-1)$
,
$({{\it\gamma}_{1}}^{\star }/{{\it\gamma}_{2}}^{\star }-1)$
,
 $\bar{x}_{1,0}$
,
$\bar{x}_{1,0}$
,
 $\bar{h}(\bar{r})$
and
$\bar{h}(\bar{r})$
and
 $\bar{x}_{1}(\bar{r})$
.
$\bar{x}_{1}(\bar{r})$
.
Equation (6.3) is solved for
 ${\it\omega}$
. Two solutions are obtained and the system will be unstable if either solution is positive, at any physically realisable wavenumber,
${\it\omega}$
. Two solutions are obtained and the system will be unstable if either solution is positive, at any physically realisable wavenumber,
 $k$
.
$k$
.
It is known that the height at the edge of the droplet is zero. Hence, only discrete values of
 $k=(m{\rm\pi})/2$
are physically meaningful for the system, where
$k=(m{\rm\pi})/2$
are physically meaningful for the system, where
 $m$
is a positive integer.
$m$
is a positive integer.
6.2 Solution methodology
In practice, the capillary number is small. The base case is therefore taken to be
 $Ca=10^{-3}$
throughout this analysis. We consider the situation soon after evaporation has commenced. The droplet has a spherical cap shape
$Ca=10^{-3}$
throughout this analysis. We consider the situation soon after evaporation has commenced. The droplet has a spherical cap shape
 $\bar{h}=1-\bar{r}^{2}$
. For any
$\bar{h}=1-\bar{r}^{2}$
. For any
 ${x_{1}}_{0}$
, the liquid composition profile
${x_{1}}_{0}$
, the liquid composition profile
 $\bar{x}_{1}(\bar{r})$
is taken from the numerical solution after one time step (with
$\bar{x}_{1}(\bar{r})$
is taken from the numerical solution after one time step (with
 ${\rm\Delta}\bar{t}=10^{-3}$
).
${\rm\Delta}\bar{t}=10^{-3}$
).
As the wavenumber
 $k$
gets larger, the solutions for
$k$
gets larger, the solutions for
 ${\it\omega}$
tend to a steady-state value. For this reason, we solve for only the first
${\it\omega}$
tend to a steady-state value. For this reason, we solve for only the first
 $50$
discrete values of
$50$
discrete values of
 $k$
.
$k$
.
For any given parameter values the resulting
 ${\it\omega}$
as a function of
${\it\omega}$
as a function of
 $k$
is plotted at various radial positions,
$k$
is plotted at various radial positions,
 $r$
. Any positive value for
$r$
. Any positive value for
 ${\it\omega}$
indicates an instability, and hence a global stability locus can be generated as a function of
${\it\omega}$
indicates an instability, and hence a global stability locus can be generated as a function of
 ${{\it\gamma}_{1}}^{\star }/{{\it\gamma}_{2}}^{\star }$
,
${{\it\gamma}_{1}}^{\star }/{{\it\gamma}_{2}}^{\star }$
,
 ${E_{1}}^{\star }/{E_{2}}^{\star }$
and
${E_{1}}^{\star }/{E_{2}}^{\star }$
and
 ${x_{1}}_{0}$
.
${x_{1}}_{0}$
.
6.3 Results and interpretation
For conciseness, the results shown in §§ 6.3.1–6.3.5 and discussed below consider the first horizontal velocity limit, outlined in § 2.3 and (2.26). This corresponds to the condition of zero shear stress on the free surface. Comparative results are shown in § 6.3.6 for the second limit (2.28), a dominant Marangoni flow.
One solution for
 ${\it\omega}$
is always negative. Hence, only the one solution for
${\it\omega}$
is always negative. Hence, only the one solution for
 ${\it\omega}$
, termed
${\it\omega}$
, termed
 ${\it\omega}_{2}$
, is shown in subsequent figures. The stability results for the binary liquid droplets depend on the position under consideration,
${\it\omega}_{2}$
, is shown in subsequent figures. The stability results for the binary liquid droplets depend on the position under consideration,
 $\bar{r}$
, the surface tension ratio,
$\bar{r}$
, the surface tension ratio,
 ${{\it\gamma}_{1}}^{\star }/{{\it\gamma}_{2}}^{\star }$
, the initial mole fraction of the more volatile liquid,
${{\it\gamma}_{1}}^{\star }/{{\it\gamma}_{2}}^{\star }$
, the initial mole fraction of the more volatile liquid,
 ${x_{1}}_{0}$
, and the relative volatility,
${x_{1}}_{0}$
, and the relative volatility,
 ${E_{1}}^{\star }/{E_{2}}^{\star }$
. When considering the global stability, the situation under consideration is only stable if it is stable at every location within the droplet. For this reason, the linear stability calculations must be repeated many times.
${E_{1}}^{\star }/{E_{2}}^{\star }$
. When considering the global stability, the situation under consideration is only stable if it is stable at every location within the droplet. For this reason, the linear stability calculations must be repeated many times.
6.3.1 Trend with position within the droplet
The stability results are highly sensitive to the chosen position within the droplet. For a fixed initial mole fraction of the more volatile component, relative volatility and surface tension ratio, there is a critical
 $\bar{r}$
that is most likely to give rise to an instability. This critical position is a function of the surface tension ratio. Figure 17 shows the stability results as a function of position for the case of
$\bar{r}$
that is most likely to give rise to an instability. This critical position is a function of the surface tension ratio. Figure 17 shows the stability results as a function of position for the case of
 ${{\it\gamma}_{1}}^{\star }/{{\it\gamma}_{2}}^{\star }=0.5$
.
${{\it\gamma}_{1}}^{\star }/{{\it\gamma}_{2}}^{\star }=0.5$
.

Figure 17. Stability results as a function of the position within the droplet. The results are shown for
 $Ca=10^{-3}$
,
$Ca=10^{-3}$
,
 ${E_{1}}^{\star }/{E_{2}}^{\star }=10$
,
${E_{1}}^{\star }/{E_{2}}^{\star }=10$
,
 ${{\it\gamma}_{1}}^{\star }/{{\it\gamma}_{2}}^{\star }=0.5$
and
${{\it\gamma}_{1}}^{\star }/{{\it\gamma}_{2}}^{\star }=0.5$
and
 ${x_{1}}_{0}=0.5$
.
${x_{1}}_{0}=0.5$
.
When the surface tension ratio
 ${{\it\gamma}_{1}}^{\star }/{{\it\gamma}_{2}}^{\star }<1$
, the critical position is typically towards the edge of the droplet, at approximately
${{\it\gamma}_{1}}^{\star }/{{\it\gamma}_{2}}^{\star }<1$
, the critical position is typically towards the edge of the droplet, at approximately
 $\bar{r}=0.99$
. When
$\bar{r}=0.99$
. When
 ${{\it\gamma}_{1}}^{\star }/{{\it\gamma}_{2}}^{\star }>1$
, the critical position is further towards the centre of the droplet, at approximately
${{\it\gamma}_{1}}^{\star }/{{\it\gamma}_{2}}^{\star }>1$
, the critical position is further towards the centre of the droplet, at approximately
 $\bar{r}=0.1$
.
$\bar{r}=0.1$
.
6.3.2 Trend with surface tension ratio
The stability results are generally a strong function of the surface tension ratio. Figure 18 shows the trend with surface tension ratio for the scenario
 $\bar{r}=0.5$
,
$\bar{r}=0.5$
,
 ${x_{1}}_{0}=0.5$
,
${x_{1}}_{0}=0.5$
,
 ${E_{1}}^{\star }/{E_{2}}^{\star }=10$
. Under these conditions, an instability will arise if the surface tension of the more volatile component is larger than the surface tension of the less volatile component (i.e.
${E_{1}}^{\star }/{E_{2}}^{\star }=10$
. Under these conditions, an instability will arise if the surface tension of the more volatile component is larger than the surface tension of the less volatile component (i.e.
 ${{\it\gamma}_{1}}^{\star }/{{\it\gamma}_{2}}^{\star }>1$
). Conversely, the situation is stable if the surface tension of the more volatile component is either directly matched to or less than the surface tension of the less volatile component (i.e.
${{\it\gamma}_{1}}^{\star }/{{\it\gamma}_{2}}^{\star }>1$
). Conversely, the situation is stable if the surface tension of the more volatile component is either directly matched to or less than the surface tension of the less volatile component (i.e.
 ${{\it\gamma}_{1}}^{\star }/{{\it\gamma}_{2}}^{\star }\leqslant 1$
). This behaviour, however, is by no means universal, since it depends on the values of
${{\it\gamma}_{1}}^{\star }/{{\it\gamma}_{2}}^{\star }\leqslant 1$
). This behaviour, however, is by no means universal, since it depends on the values of
 $\bar{r}$
,
$\bar{r}$
,
 ${x_{1}}_{0}$
and
${x_{1}}_{0}$
and
 ${E_{1}}^{\star }/{E_{2}}^{\star }$
.
${E_{1}}^{\star }/{E_{2}}^{\star }$
.

Figure 18. Stability results as a function of the surface tension ratio. The results are shown for
 $Ca=10^{-3}$
,
$Ca=10^{-3}$
,
 $\bar{r}=0.5$
,
$\bar{r}=0.5$
,
 ${E_{1}}^{\star }/{E_{2}}^{\star }=10$
and
${E_{1}}^{\star }/{E_{2}}^{\star }=10$
and
 ${x_{1}}_{0}=0.5$
.
${x_{1}}_{0}=0.5$
.
6.3.3 Trend with initial liquid composition
The plot in figure 19 shows the stability results for different
 ${x_{1}}_{0}$
when the surface tension ratio is less than 1, and the plot in figure 20 shows those for when it is greater than 1.
${x_{1}}_{0}$
when the surface tension ratio is less than 1, and the plot in figure 20 shows those for when it is greater than 1.

Figure 19. Stability results as a function of the initial mole fraction of liquid 1. The results are shown for
 $Ca=10^{-3}$
,
$Ca=10^{-3}$
,
 $\bar{r}=0.5$
,
$\bar{r}=0.5$
,
 ${E_{1}}^{\star }/{E_{2}}^{\star }=10$
and
${E_{1}}^{\star }/{E_{2}}^{\star }=10$
and
 ${{\it\gamma}_{1}}^{\star }/{{\it\gamma}_{2}}^{\star }=0.5$
.
${{\it\gamma}_{1}}^{\star }/{{\it\gamma}_{2}}^{\star }=0.5$
.

Figure 20. Stability results as a function of the initial mole fraction of liquid 1. The results are shown for
 $Ca=10^{-3}$
,
$Ca=10^{-3}$
,
 $\bar{r}=0.5$
,
$\bar{r}=0.5$
,
 ${E_{1}}^{\star }/{E_{2}}^{\star }=10$
and
${E_{1}}^{\star }/{E_{2}}^{\star }=10$
and
 ${{\it\gamma}_{1}}^{\star }/{{\it\gamma}_{2}}^{\star }=1.5$
.
${{\it\gamma}_{1}}^{\star }/{{\it\gamma}_{2}}^{\star }=1.5$
.
It should be noted that the previously stable case of
 ${{\it\gamma}_{1}}^{\star }/{{\it\gamma}_{2}}^{\star }<1$
can become unstable if
${{\it\gamma}_{1}}^{\star }/{{\it\gamma}_{2}}^{\star }<1$
can become unstable if
 ${x_{1}}_{0}$
is sufficiently large. Furthermore, the previously unstable case of
${x_{1}}_{0}$
is sufficiently large. Furthermore, the previously unstable case of
 ${{\it\gamma}_{1}}^{\star }/{{\it\gamma}_{2}}^{\star }>1$
can become stable if
${{\it\gamma}_{1}}^{\star }/{{\it\gamma}_{2}}^{\star }>1$
can become stable if
 ${x_{1}}_{0}$
is small enough.
${x_{1}}_{0}$
is small enough.
In the general case, if
 ${x_{1}}_{0}$
is larger, the scenario under consideration is more likely to be unstable.
${x_{1}}_{0}$
is larger, the scenario under consideration is more likely to be unstable.
6.3.4 Trend with relative volatility
The trend with relative volatility is shown in figure 21 for a surface tension ratio of
 ${{\it\gamma}_{1}}^{\star }/{{\it\gamma}_{2}}^{\star }=0.5$
.
${{\it\gamma}_{1}}^{\star }/{{\it\gamma}_{2}}^{\star }=0.5$
.

Figure 21. Stability results as a function of the relative volatility. The results are shown for
 $Ca=10^{-3}$
,
$Ca=10^{-3}$
,
 $\bar{r}=0.5$
and
$\bar{r}=0.5$
and
 ${{\it\gamma}_{1}}^{\star }/{{\it\gamma}_{2}}^{\star }=0.5$
.
${{\it\gamma}_{1}}^{\star }/{{\it\gamma}_{2}}^{\star }=0.5$
.
In the general case, if the relative volatility is increased, binary liquid droplets are increasingly likely to be stable. This effect is more pronounced for
 ${{\it\gamma}_{1}}^{\star }/{{\it\gamma}_{2}}^{\star }<1$
.
${{\it\gamma}_{1}}^{\star }/{{\it\gamma}_{2}}^{\star }<1$
.
6.3.5 The global stability locus
The global stability locus is presented in figure 22. The stabilities of inks B, C, D, F, H and I from the experiments are superimposed for comparison. The global stability locus represents the prediction for the stability of a binary liquid droplet, with the three key properties
 ${E_{1}}^{\star }/{E_{2}}^{\star }$
,
${E_{1}}^{\star }/{E_{2}}^{\star }$
,
 ${{\it\gamma}_{1}}^{\star }/{{\it\gamma}_{2}}^{\star }$
and
${{\it\gamma}_{1}}^{\star }/{{\it\gamma}_{2}}^{\star }$
and
 ${x_{1}}_{0}$
. It takes into account the spatial dependence of the stability. Only scenarios that are stable at every location within the droplet are marked as stable. The region below each of the loci is the ‘stable’ region. The region above each of the loci is the ‘unstable’ region.
${x_{1}}_{0}$
. It takes into account the spatial dependence of the stability. Only scenarios that are stable at every location within the droplet are marked as stable. The region below each of the loci is the ‘stable’ region. The region above each of the loci is the ‘unstable’ region.

Figure 22. Global stability locus after a time
 $\bar{t}=10^{-3}$
and for a capillary number
$\bar{t}=10^{-3}$
and for a capillary number
 $Ca=10^{-3}$
. The results are shown as a function of the relative volatility, surface tension ratio and the initial mole fraction of liquid 1 and for the first horizontal velocity limit, defined in § 2.3, equation (2.26). The experimental results are superimposed for inks B, C, D, F, H and I. The contradictory evidence is highlighted and enclosed within a dashed circle.
$Ca=10^{-3}$
. The results are shown as a function of the relative volatility, surface tension ratio and the initial mole fraction of liquid 1 and for the first horizontal velocity limit, defined in § 2.3, equation (2.26). The experimental results are superimposed for inks B, C, D, F, H and I. The contradictory evidence is highlighted and enclosed within a dashed circle.
It should be noted that the analysis has been performed at one specific moment in time,
 $\bar{t}=10^{-3}$
. Even the stable situations shown could become unstable at a later time, when the profiles of height
$\bar{t}=10^{-3}$
. Even the stable situations shown could become unstable at a later time, when the profiles of height
 $\bar{h}(\bar{r})$
and composition
$\bar{h}(\bar{r})$
and composition
 $x_{1}(\bar{r})$
are different. Consequently, it could be expected that many more situations are unstable. That said, the analysis does not account for diffusion or the presence of polymer; both of these will have a stabilising effect.
$x_{1}(\bar{r})$
are different. Consequently, it could be expected that many more situations are unstable. That said, the analysis does not account for diffusion or the presence of polymer; both of these will have a stabilising effect.
-
(i) The instability is caused by a difference in surface tension along the droplet surface. The volatility difference of the two liquids sets up a composition gradient within the droplet, with the edge becoming rich in the less volatile liquid. This composition gradient results in an associated surface tension gradient along the droplet surface. From (2.23), it is clear that the horizontal velocity depends not only on the surface tension at that location but also on the surface tension gradient. The large surface tension gradient causes a large velocity and associated rapid change in height. This large change in height causes a further change to the composition and so also to the difference in surface tension. The mechanism accentuates as time proceeds.
-
(ii) For larger initial mole fractions of the more volatile component,
 ${x_{1}}_{0}$
, the
$x_{1}(\bar{r})$
profile is sharper, with a large drop to
$x_{1}=0$
at the edge. The composition gradient and associated surface tension gradient are larger. Hence, the onset of an instability becomes more likely.
${x_{1}}_{0}$
, the
$x_{1}(\bar{r})$
profile is sharper, with a large drop to
$x_{1}=0$
at the edge. The composition gradient and associated surface tension gradient are larger. Hence, the onset of an instability becomes more likely. -
(iii) For larger relative volatilities, the
$x_{1}(\bar{r})$
profile is not as sharp (see figure 4). The less volatile-rich region is more diffuse and less confined to the periphery. The composition gradient is reduced and so the onset of an instability is less likely.


Figure 22 suggests that a surface tension ratio less than unity is just as likely to cause an instability as a surface tension ratio greater than unity. When polymer is introduced, however, there is likely to be some deviation from this behaviour. In § 6.3.1, it was noted that an instability is most likely to arise at
 $\bar{r}\simeq 0.99$
for a surface tension ratio less than unity. In a system containing polymer, the growth of a perturbation would be arrested at this location, due to gelation of the polymer. This could explain why inks C and D, circled in figure 22, were observed to dry stably. When the surface tension ratio is greater than unity, it was noted in § 6.3.1 that the instability is most likely to arise at
$\bar{r}\simeq 0.99$
for a surface tension ratio less than unity. In a system containing polymer, the growth of a perturbation would be arrested at this location, due to gelation of the polymer. This could explain why inks C and D, circled in figure 22, were observed to dry stably. When the surface tension ratio is greater than unity, it was noted in § 6.3.1 that the instability is most likely to arise at
 $\bar{r}\simeq 0.1$
. At this location, polymer gelation is unable to arrest the instability and so perturbations will continue to grow. The global stability locus is valid for time
$\bar{r}\simeq 0.1$
. At this location, polymer gelation is unable to arrest the instability and so perturbations will continue to grow. The global stability locus is valid for time
 $\bar{t}=10^{-3}$
. As time proceeds many more situations are likely to become unstable, due to the change in liquid composition gradients. This could explain why ink I was observed to be unstable.
$\bar{t}=10^{-3}$
. As time proceeds many more situations are likely to become unstable, due to the change in liquid composition gradients. This could explain why ink I was observed to be unstable.
6.3.6 Comparison with the second horizontal velocity limit
The linear stability analysis can also be performed for the second horizontal velocity limit, defined by (2.28) in § 2.3. The matrix coefficients in (6.3) are different and are provided in the supplementary information. The global stability locus is presented in figure 23. The stabilities of inks B, C, D, F, H and I from the experiments are superimposed for comparison.

Figure 23. Global stability locus after a time
 $\bar{t}=10^{-3}$
and for a capillary number
$\bar{t}=10^{-3}$
and for a capillary number
 $Ca=10^{-3}$
. The results are shown as a function of the relative volatility, surface tension ratio and the initial mole fraction of liquid 1 and for the second horizontal velocity limit, defined by (2.28) in § 2.3. The experimental results are superimposed for inks B, C, D, F, H and I.
$Ca=10^{-3}$
. The results are shown as a function of the relative volatility, surface tension ratio and the initial mole fraction of liquid 1 and for the second horizontal velocity limit, defined by (2.28) in § 2.3. The experimental results are superimposed for inks B, C, D, F, H and I.
The system is unconditionally unstable when the surface tension ratio is greater than unity. By contrast, the system is stable when the surface tension ratio is less than unity, unless the initial mole fraction of the more volatile liquid is very large. There are no inconsistencies between the stability locus shown in figure 23 and the observations of the experiments for inks B, C, D, F, H and I.
7 Proposed mechanism for the propagation of the instability
Whilst the actual magnitude of the horizontal velocity will be between that of the first and second limits ((2.26) and (2.28) in § 2.3), it is fair to say that the experimental results displayed in § 5 reflect the results for the numerical simulations of the first limit. Therefore, only this limit will be considered from now on. This first horizontal velocity limit corresponds to a condition of zero shear stress on the droplet surface. A Marangoni flow will act to momentarily ensure that the surface composition is spatially uniform. The liquid composition can still vary instantaneously and also in the liquid region below the surface. This will depend on the height at each location within the droplet, the relative volatility of the liquids, the previous liquid composition and the local strength of the horizontal velocity.
The linear stability analysis of § 6 was conducted a time
 $\bar{t}=10^{-3}$
after the commencement of evaporation. Thus the influence of the liquid composition gradient could be considered. However, it is not possible to use the linear stability analysis to track the evolution of the instability with time. It can only indicate whether or not an instability will be initiated at early times. Once perturbations have grown to such an extent that they are no longer very small, it is no longer a good approximation to ignore higher order perturbation terms. The transience of the system is complicated by the evolution of the base state, as well as the perturbation component. Additionally, the perturbations can move laterally, as indicated by a complex solution for
$\bar{t}=10^{-3}$
after the commencement of evaporation. Thus the influence of the liquid composition gradient could be considered. However, it is not possible to use the linear stability analysis to track the evolution of the instability with time. It can only indicate whether or not an instability will be initiated at early times. Once perturbations have grown to such an extent that they are no longer very small, it is no longer a good approximation to ignore higher order perturbation terms. The transience of the system is complicated by the evolution of the base state, as well as the perturbation component. Additionally, the perturbations can move laterally, as indicated by a complex solution for
 ${\it\omega}$
.
${\it\omega}$
.
Instead we use a flow direction argument to explain the build-up and sharpening of the coffee-ring shape at the edge of the droplet, when the surface tension ratio is greater than unity (see figures 11 and 16). Flow occurs from regions of high pressure to regions of low pressure – in other words, in the direction that the horizontal pressure gradient is negative.
Differentiating the Young–Laplace equation results in the following equation:
 $$\begin{eqnarray}\frac{\text{d}p}{\text{d}r}=-{\it\gamma}\frac{\text{d}{\it\kappa}}{\text{d}r}-{\it\kappa}\frac{\text{d}{\it\gamma}}{\text{d}r}.\end{eqnarray}$$
Initially the droplet has positive curvature and
 $\text{d}{\it\kappa}/\text{d}r>0$
. Hence, when the surface tension ratio is less than unity,
$\text{d}{\it\kappa}/\text{d}r>0$
. Hence, when the surface tension ratio is less than unity,
 $\text{d}{\it\gamma}/\text{d}r>0$
and so the velocity is outward at all locations. Typically, we do not see an instability in this situation, unless the initial mole fraction of the more volatile liquid is very large.
$\text{d}{\it\gamma}/\text{d}r>0$
and so the velocity is outward at all locations. Typically, we do not see an instability in this situation, unless the initial mole fraction of the more volatile liquid is very large.
When the surface tension ratio is greater than unity,
 $\text{d}{\it\gamma}/\text{d}r<0$
. This leads to a competition between the two terms in (7.1) for control of the flow direction. To determine which term dominates and at which location, we define the term
$\text{d}{\it\gamma}/\text{d}r<0$
. This leads to a competition between the two terms in (7.1) for control of the flow direction. To determine which term dominates and at which location, we define the term
 ${\it\chi}$
as
${\it\chi}$
as
 $$\begin{eqnarray}{\it\chi}=\frac{{\it\gamma}\displaystyle \frac{\text{d}{\it\kappa}}{\text{d}r}}{{\it\kappa}\displaystyle \frac{\text{d}{\it\gamma}}{\text{d}r}}.\end{eqnarray}$$
If
 ${\it\chi}>1$
the flow direction will be outward; if
${\it\chi}>1$
the flow direction will be outward; if
 ${\it\chi}<1$
the flow direction will be inward.
${\it\chi}<1$
the flow direction will be inward.
At the edge
 $|\text{d}{\it\gamma}/\text{d}r|$
is very large and so
$|\text{d}{\it\gamma}/\text{d}r|$
is very large and so
 ${\it\chi}<1$
and the flow is inward. Elsewhere,
${\it\chi}<1$
and the flow is inward. Elsewhere,
 $\text{d}{\it\kappa}/\text{d}r$
dominates and the flow is outward. This suggests there will be a pile-up of material at the location where the flow direction switches. This behaviour will continue to be exhibited as time proceeds.
$\text{d}{\it\kappa}/\text{d}r$
dominates and the flow is outward. This suggests there will be a pile-up of material at the location where the flow direction switches. This behaviour will continue to be exhibited as time proceeds.
Soon after, a coffee-ring-shaped surface profile arises. There is a region of negative curvature from the centre, up to the horizontal location of the ring peak. The region outward from the ring peak, up to the edge of the droplet, still has positive curvature. In terms of liquid composition, there are three regions. At the centre and at the edge, the liquid is rich in the less volatile liquid, due to small height. The region of negative curvature on the inward edge of the ring will have less depletion of the more volatile liquid. The flow directions can be determined by considering the group
 ${\it\chi}$
at each location. It is found that the coffee-ring-style surface shape sharpens and does not self-correct.
${\it\chi}$
at each location. It is found that the coffee-ring-style surface shape sharpens and does not self-correct.
8 Conclusion
A model based on lubrication theory has been used to predict the height, polymer volume fraction and evolution of liquid composition with time for thin, binary liquid droplets. The parameters controlling the final film shape have been studied. In addition, a linear stability analysis was conducted, to predict the parameter values that may give rise to an instability at early times.
The instability occurs due to the difference in surface tension across the droplet surface. The instability is most likely to occur when the mole fraction of the more volatile liquid is large, since this gives rise to a sharper gradient in liquid composition, when the liquids have differing volatility. If the surface tension of the more volatile liquid is less than that of the less volatile liquid, the critical position at which an instability would occur is close to the edge. In polymer-laden droplets, this instability would be arrested by gelation of the polymer. If the opposite difference in surface tension existed, the instability would begin towards the centre of the droplet. The polymer could not stabilise the system at this location. We have consistently observed a rapid change in height and an extreme coffee-ring formation, in this eventuality, for both the numerical solution and experimental results. A more comprehensive and detailed picture of the instability could be achieved by a stability analysis that accounts for polymer, diffusional effects and temporal variation, but this falls outside the scope of the present study.
Under standard conditions, the liquid–liquid diffusion dominates convection. If there were no reduction in liquid–liquid diffusion caused by polymer gelation, we would expect there to be minimal change to the film profile, no matter what relative volatility and mixing ratio were chosen. When the temperature is increased, convection is no longer insignificant. Under these conditions, we have observed, both numerically and experimentally, a reduction in the extent of coffee-ring formation when the relative volatility of the two liquid components is increased. The reason is that the differential evaporation rate initialises a composition differential within the droplet, with a less volatile-rich region at the periphery of the droplets and a more volatile central region. If the liquid–liquid diffusion is not completely dominant, the composition gradient is not completely equilibrated. The evaporation rate therefore becomes larger towards the centre of the droplet when compared to a droplet containing only one liquid. The outward capillary flow driving coffee-ring formation is thus reduced.
Acknowledgements
This research has been funded by the Engineering and Physical Sciences Research Council, UK and CASE studentship funding from Cambridge Display Technology Ltd, UK. We thank Dr M. Dowling of Cambridge Display Technology Ltd for help with the experimental set-up.
Supplementary material
Supplementary material is available at http://dx.doi.org/10.1017/jfm.2016.163.


