


Introduction
Until fairly recently, conodonts, a group of marine animals extinct since the end of the Triassic, were only known in the fossil record from their numerous and diverse mineralized elements. However, two major events in the second half of the twentieth century allowed a much better understanding of what conodonts really looked like. First, the recognition by several researchers (e.g., Bergström and Sweet Reference Bergström and Sweet1966; Sweet and Donoghue Reference Sweet and Donoghue2001 and references therein) of the multielement nature of the conodont feeding apparatus allowed for better taxonomic definitions, as well as a first hint at the real skeletal morphology of conodonts. Second, the discovery of relatively complete conodont fossils, including soft tissue, provided the necessary evidence to assess their overall anatomy (eel shaped with V-shaped myomeres, a caudal fin and large eyes, the mineralized elements being located in the mouth; Aldridge et al. Reference Aldridge, Briggs, Smith, Clarkson and Clark1993) and, therefore, their putative general ecology (possibly predatory, small-sized active swimmers). Simultaneously, these new data allowed the recognition of conodonts as one of the earliest groups of fossil vertebrates, making their skeletal elements valuable as an independent evolutionary experiment of tooth-like structures within the vertebrate group (e.g., Sansom et al. Reference Sansom, Smith, Armstrong and Smith1992).
Since then, knowledge on the biology, development, and ecology of conodonts has been increasing steadily. However, because complete specimens still remain very rare, the vast majority of these advances are based on the tooth-like mineralized elements. Notably, knowledge of element growth and microstructure has been greatly expanded (in particular since the advent of synchrotron scans; e.g., Donoghue and Purnell Reference Donoghue and Purnell1999a; Murdock et al. Reference Murdock, Dong, Repetski, Marone, Stampanoni and Donoghue2013; Mazza and Martínez-Pérez Reference Mazza and Martínez-Pérez2016; see also Shirley et al. [Reference Shirley, Grohganz, Bestmann and Jarochowska2018], who used backscattered electron microscopy), and research has demonstrated the continuous growth of elements, which were not shed but repaired throughout the life of individuals. Also, the literature regarding functional aspects related either to the whole apparatus or more specifically to the occlusal patterns of P1 elements has accumulated rapidly (e.g., Purnell and Donoghue Reference Purnell and Donoghue1997; Donoghue and Purnell Reference Donoghue and Purnell1999a, Reference Donoghue and Purnell1999b; Donoghue Reference Donoghue2001; Goudemand et al. Reference Goudemand, Orchard, Urdy, Bucher and Tafforeau2011; Jones et al. Reference Jones, Evans, Siu, Rayfield and Donoghue2012; Martínez-Pérez et al. Reference Martínez-Pérez, Plasencia, Jones, Kolar-Jurkovšek, Sha, Botella and Donoghue2014, Reference Martínez-Pérez, Rayfield, Botella and Donoghue2016). These studies have shown that the anterior part of the conodont apparatus (i.e., M and S elements) was probably used to grab prey, while the posterior elements (i.e., P elements) were used to break down food. Based on the occlusal mechanics of P1 elements of different conodont taxa, authors have shown a variety of functional outputs (Donoghue and Purnell Reference Donoghue and Purnell1999b; Jones et al. Reference Jones, Evans, Siu, Rayfield and Donoghue2012; Martínez-Pérez et al. Reference Martínez-Pérez, Plasencia, Jones, Kolar-Jurkovšek, Sha, Botella and Donoghue2014 and references therein; Suttner et al. Reference Suttner, Kido and Briguglio2018). Despite this diversity, Martínez-Pérez and colleagues (Reference Martínez-Pérez, Rayfield, Botella and Donoghue2016) have hypothesized that the independent evolution of a platform-like morphology in P1 elements in several groups of conodonts was likely linked to similar mechanical constraints, which could suggest convergent adaptation to similar ecological niches. This hypothesis is not entirely new, as Sweet (Reference Sweet1988) had already proposed that repeated platform evolution had an important adaptive significance.
Although the exploration of function of conodont apparatus entails promising results in terms of dietary ecology, knowledge regarding the trophic niche of conodonts remains scarce. Direct evidence for conodonts being preyed upon is available for various groups: the coelacanths (Zatoń et al. Reference Zatoń, Broda, Qvarnström, Niedźwiedzki and Ahlberg2017), actinopterygian fishes (Nicoll Reference Nicoll1977; Choo et al. Reference Choo, Long and Trinajstic2009), and chondrichthyans (Williams Reference Williams and Boucot1990; Zatoń and Rakociński Reference Zatoń and Rakociński2014), as well as other more enigmatic animals (Typhloesus wellsi; Conway Morris Reference Conway Morris1990). On the other hand, not much is known about the trophic level of conodonts themselves, and although an active predatory lifestyle has been inferred in some taxa from the presence of microwear on the elements (e.g., Purnell Reference Purnell1995, Reference Purnell and Ahlberg2001; Donoghue and Purnell Reference Donoghue and Purnell1999b), the type of prey conodonts may have consumed remains unclear. Active suspension-feeding and scavenging lifestyles have also been proposed (e.g., Nicoll Reference Nicoll and Aldridge1987, Reference Nicoll1995; Purnell Reference Purnell1994 and references therein). The quantitative analyses of microwear on P1 elements suggest that overall conodont ecology and diet were diverse (Purnell and Jones Reference Purnell and Jones2012).
Although direct assessment of conodont diet would rely mostly on finding fossils with their stomach contents preserved, trophic level can be assessed using proxies such as calcium isotopes ratio or strontium content (e.g., Martin et al. Reference Martin, Tacail, Adnet, Girard and Balter2015; Shirley et al. Reference Shirley, Grohganz, Bestmann and Jarochowska2018). However, a more directly accessible and less invasive proxy is size, which is known to sometimes be positively related to trophic level, in particular in marine ecosystems (e.g., Cohen et al. Reference Cohen, Pimm, Yodzis and Saldaña1993; Jennings et al. Reference Jennings, Pinnegar, Polunin and Boon2001; Karpouzi and Stergiou Reference Karpouzi and Stergiou2003; Romanuk et al. Reference Romanuk, Hayward and Hutchings2011). In their wide-ranging study, Romanuk and colleagues (Reference Romanuk, Hayward and Hutchings2011) included hagfishes and lampreys, which are probably the closest living relatives of conodonts phylogenetically and also arguably their closest equivalent in terms of morphology (Janvier Reference Janvier2015; Donoghue and Rücklin Reference Donoghue and Rücklin2016; Miyashita et al. Reference Miyashita, Coates, Farrar, Larson, Manning, Wogelius and Currie2019). Romanuk et al. (Reference Romanuk, Hayward and Hutchings2011) showed that the relationship between body size and trophic level in Myxiniformes (i.e., hagfishes) is nonsignificant, while it is significantly positive in Petromyzontiformes (i.e., lampreys). They further found that the positive relationship between size and trophic level is more frequently significant in orders containing species with smaller-sized individuals on average. Considering that conodonts are generally small sized and closely related to lampreys and hagfishes, size may be a valuable proxy for assessing their trophic level. Body size is obviously not available for the vast majority of conodont taxa, which are known only from their mineralized elements. However, due to their continuous growth, the size of these elements (more specifically the length of P1 elements) can be used, and has been used, as a general size indicator in several studies (Luo et al. Reference Luo, Lai, Shi, Jiang, Yin, Xie, Tong, Zhang, He and Wignall2008; Schaal et al. Reference Schaal, Clapham, Rego, Wang and Payne2016; Leu et al. Reference Leu, Bucher and Goudemand2018; Shirley et al. Reference Shirley, Grohganz, Bestmann and Jarochowska2018; Zhang et al. Reference Zhang, Sun, Wignall, Fu, Li, Wang and Lai2018). It should, however, be noted that the relationships between food-processing organ size, body size, and prey size are not always positive, and therefore, the assumptions we make here may not always hold true. Notably, the complexity of food webs (i.e., the number of existing trophic levels) is a major limiting factor to the size–trophic level correlation, and including extremely large taxa, which are often primary consumers, can also reverse the expected positive trend. Tucker and Rogers (Reference Tucker and Rogers2014) show a nice example of this in marine mammals. Although the very large taxa bias should not represent a problem for conodonts, the complexity of food webs through their evolutionary history probably varied and is unaccounted for in the present study.
Because P1 morphology, specifically the evolution of platforms, has been suggested to represent adaptation to changes in conodont dietary ecology (Sweet Reference Sweet1988; Martínez-Pérez et al. Reference Martínez-Pérez, Rayfield, Botella and Donoghue2016) and because changes in trophic level are supposedly reflected in changes in size (e.g., Romanuk et al. Reference Romanuk, Hayward and Hutchings2011), we herein investigate whether P1 element size is related to the presence or absence of a platform at the intergeneric level. Our working hypothesis is the existence of a positive relationship between element size and the presence of a platform, as an increase in size is likely associated with an increase in the mechanical stresses applied on elements during feeding (Wainwright Reference Wainwright1988), and these increased stresses could have induced the evolution of platforms, as suggested in Martínez-Pérez et al. (Reference Martínez-Pérez, Rayfield, Botella and Donoghue2016). To test this relationship in a phylogenetic context, we base our analyses on the summary tree of Donoghue and colleagues (Reference Donoghue, Purnell, Aldridge and Zhang2008), which includes several platform and non-platform taxa of various sizes. Using this framework, we aim at identifying a phylogenetic signal in both size and platform presence/absence and testing their correlation while accounting for phylogenetic effects. If the independent evolution of platform P1 elements in several taxa is indeed related to an increase in trophic level (possibly through common changes in mechanical demands), we expect a positive correlation between size and platform presence, with low phylogenetic signal in both characters due to convergence.
Materials and Methods
Sample and Measurements
Our sample of taxa was based on the phylogeny of Donoghue et al. (Reference Donoghue, Purnell, Aldridge and Zhang2008), which includes mostly genera and a few species. For any genus, one to seven species were included. From a collection of 1075 journal articles, 65 were selected that contained appropriate images of these taxa (Supplementary Table 1). Out of the 61 taxa that were present in the tree of Donoghue et al. (Reference Donoghue, Purnell, Aldridge and Zhang2008), 59 were included in all analyses in this study, excluding Erika and Hibbardella, for which no suitable images were found for assessing size. Because we follow the nomenclature of Donoghue et al. (Reference Donoghue, Purnell, Aldridge and Zhang2008), some taxonomic changes have not been used in our study, but should be acknowledged by the readers. Notably, Ozarkodina excavata has been moved to the Wurmiella genus (Murphy et al. Reference Murphy, Valenzuela-Ríos and Carls2004), Gamachignathus is now replaced by Birksfeldia (senior synonym; Bergström and Ferretti Reference Bergström and Ferretti2015), and Icriodella is now often reported as a senior synonym of Notiodella (the former is used in our study; Bergström and Ferretti Reference Bergström and Ferretti2015), although this could not be resolved by cladistic analyses (Miller et al. Reference Miller, Heward, Mossoni and Sansom2018).
For each taxon, the length of P1 elements was measured in oral and/or lateral view directly from the illustrated plates (Fig. 1) using the GIMP software measuring tool and then scaled using either the provided scale bar or the magnification indicated in the legend. Element length was chosen over other measurements, because it can be obtained from published plates and because width, or the product of length times width, is directly dependent on platform presence (Fig. 1). In total, 199 measurements were performed, with one to eight individual measurements for each taxon (median N = 3). Presence or absence of platform was based on the character states coded in the matrix of Donoghue et al. (Reference Donoghue, Purnell, Aldridge and Zhang2008), with two modifications: Hadrodontina was originally coded as having a platform, but we coded it as without a platform, and Kockelella was coded as without a platform, but we coded it as with a platform (Supplementary Table 1).
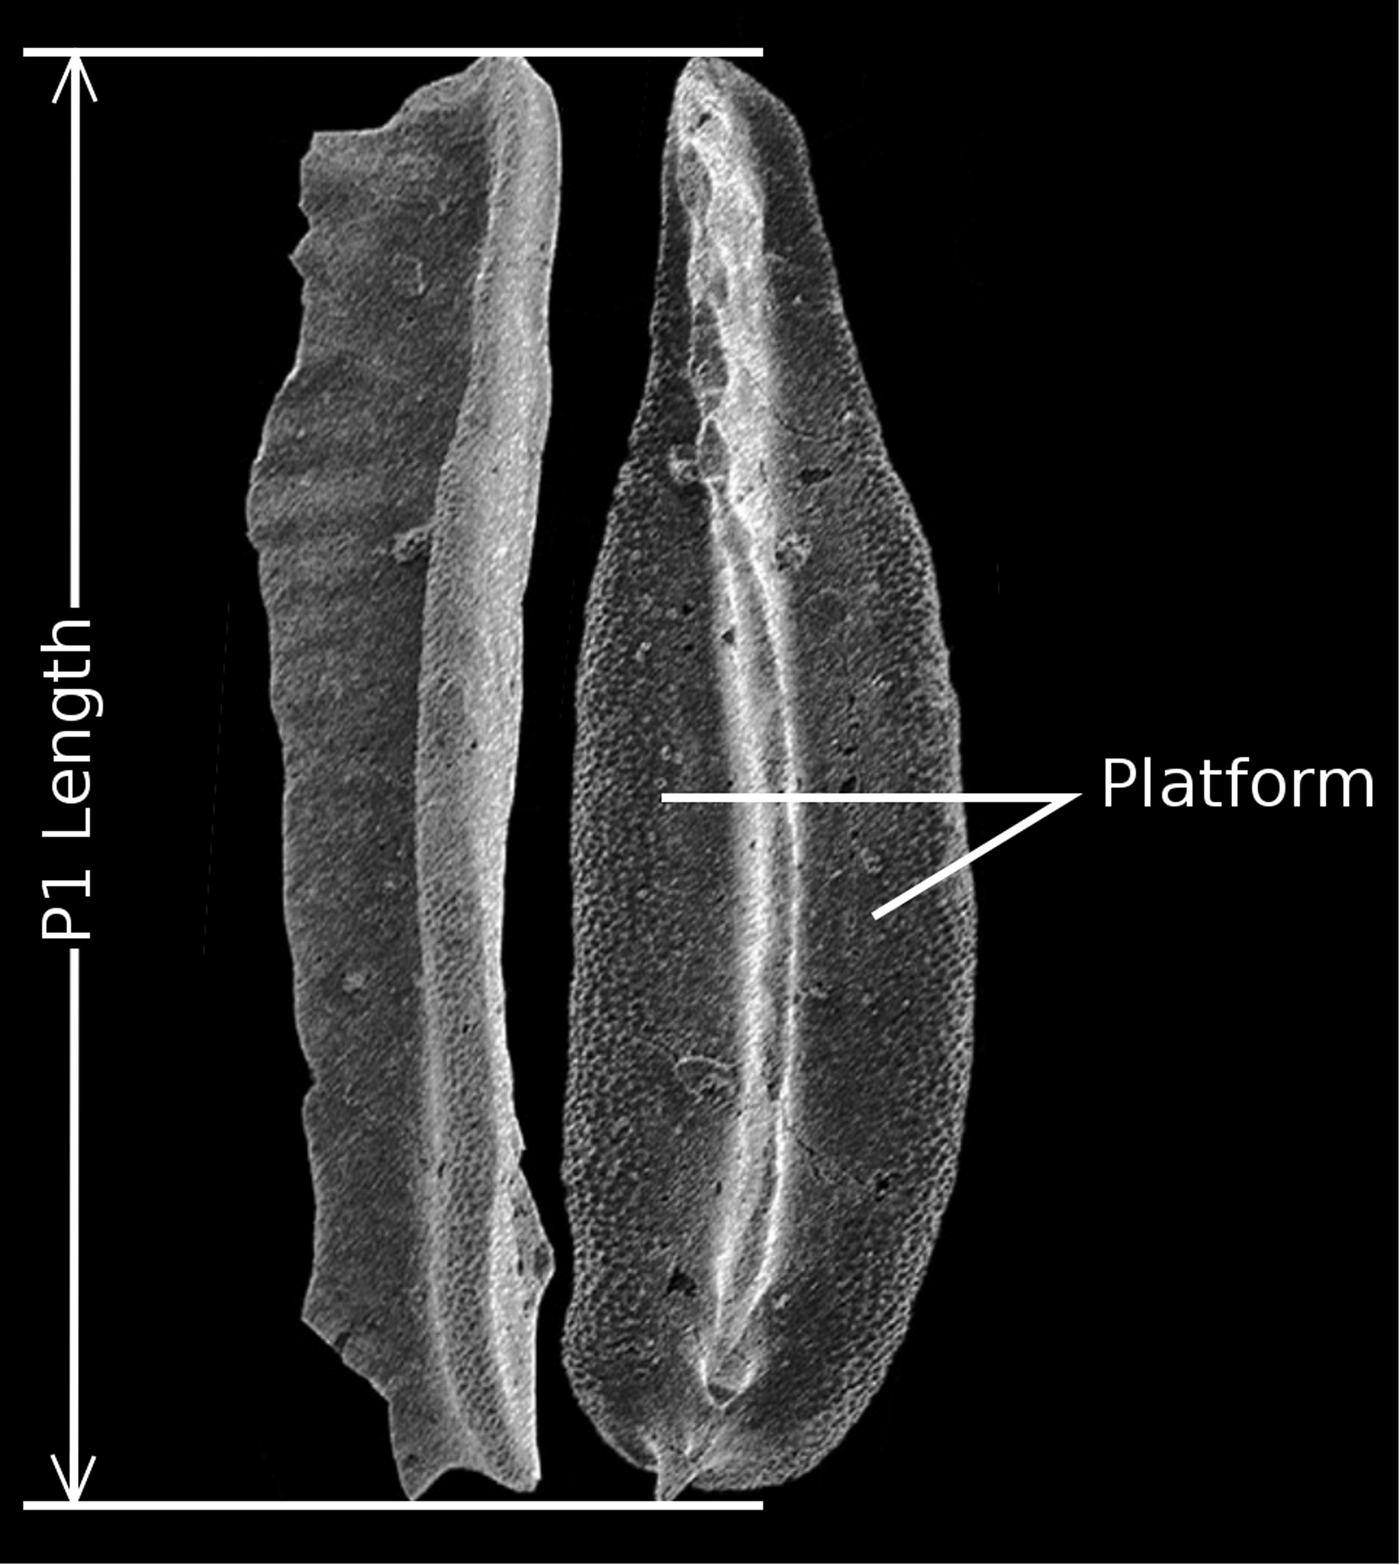
Figure 1. Example of conodont picture from the literature, illustrating the size measurement used in this study in a “platform-bearing” taxon (Neogondolella). Modified from Goudemand et al. (Reference Goudemand, Orchard, Bucher and Jenks2012).
Phylogenetic Trees
Three different phylogenetic tree topologies were used in the present study. Two of them were based on the original character matrix given in Donoghue et al. (Reference Donoghue, Purnell, Aldridge and Zhang2008) and were built using PAUP* v. 4.0a (build 164) for Linux. To compute trees, we used the same approach as Donoghue and colleagues; that is, we defined Paracordylodus as an outgroup, then first ran a heuristic search (however, we ran only 10 replicates, whereas Donoghue and colleagues ran 100), followed by a posteriori reweighting of the characters based on rescaled consistency indices. The computed trees were then saved into raw Newick format before being exported into R (R Core Team 2018). These two topologies were both strict consensus trees calculated from the most parsimonious trees found for either (1) the whole data set (i.e., Tranche 3 analysis in Donoghue et al. [Reference Donoghue, Purnell, Aldridge and Zhang2008]; our Fig. 2B) or (2) the data set with characters 8 and 9 removed from the character matrix (i.e., platform presence/absence and platform type; Fig. 2C).
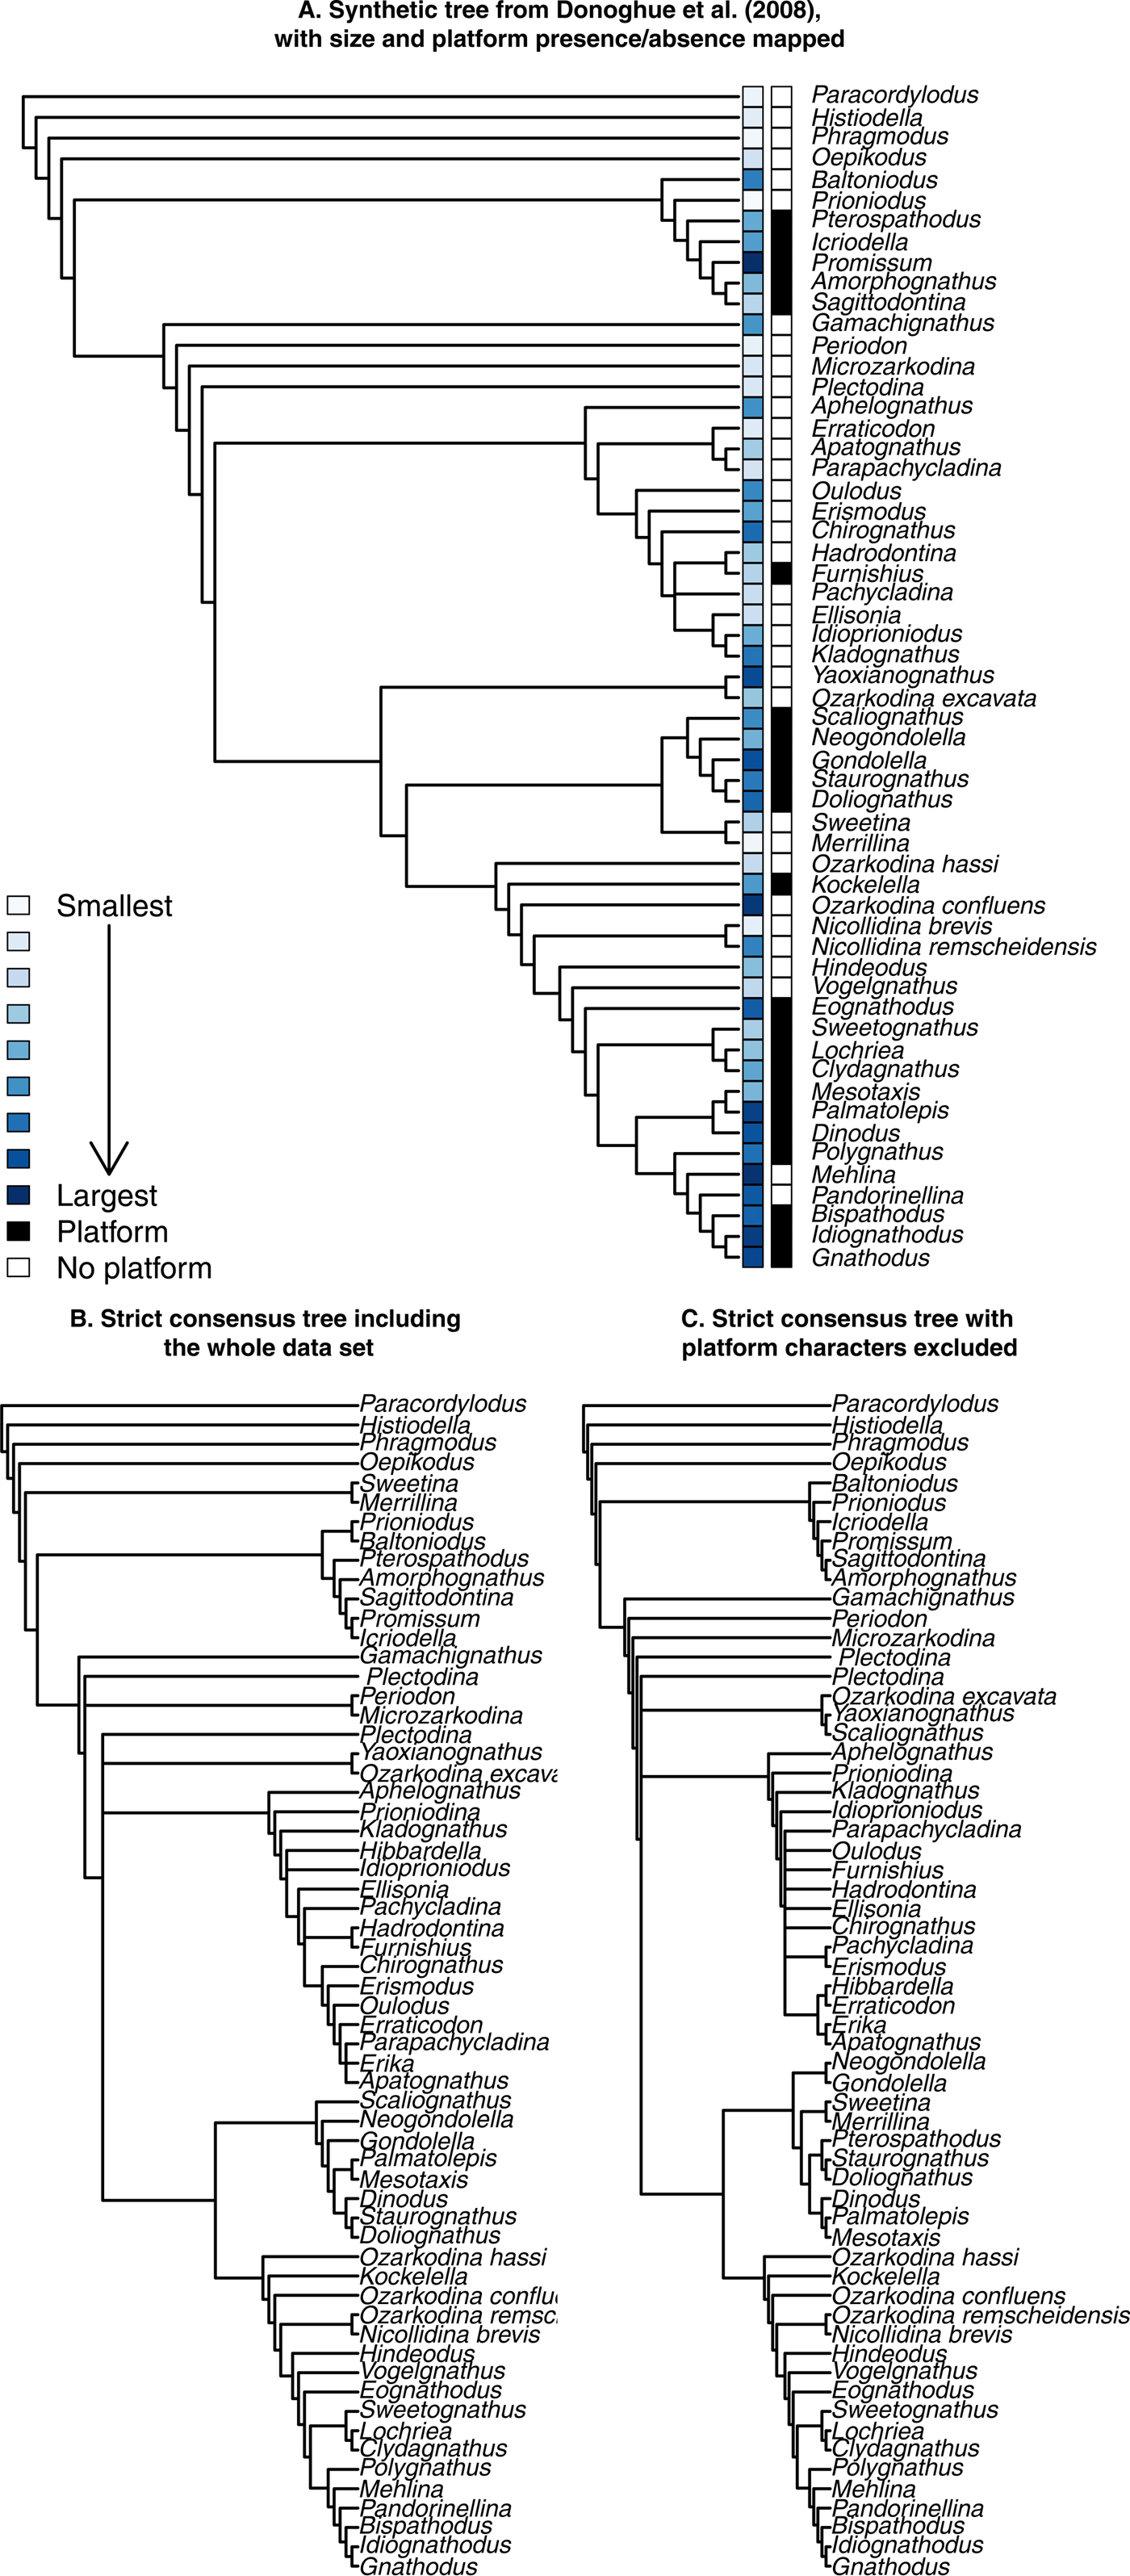
Figure 2. Three phylogenetic tree topologies used as a background for various analyses in this study. A, The “synthetic” tree of Donoghue et al. (Reference Donoghue, Purnell, Aldridge and Zhang2008), based on their interpretation of their various cladistic analyses, with platform presence/absence and size (i.e., P1 element length) mapped. B, Strict consensus tree produced on the entire character matrix of Donoghue et al. (Reference Donoghue, Purnell, Aldridge and Zhang2008), corresponding to their Tranche 3 analysis. C, Strict consensus tree produced on the same matrix, excluding two characters (8 and 9): platform presence/absence and platform type.
The third topology used here was the final tree topology of Donoghue et al. (Reference Donoghue, Purnell, Aldridge and Zhang2008: Fig. 13; our Fig. 2C), which represented their interpretations, combining and summarizing their different analyses. We translated this tree into a Newick format to be exported into R (R Core Team 2018).
The use of these three different trees allowed us to test the phylogenetic signal in size and platform presence/absence either on raw data or interpretative topology, while checking for the pitfall of the circularity of testing for phylogenetic signal in platform presence/absence, with this character being used to build the tree itself.
Statistical Analyses
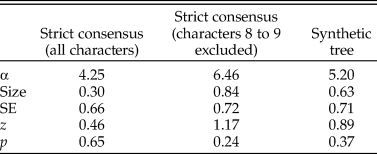
All subsequent analyses were run in the R environment (R Core Team 2018). The same analyses were run three times, using the mean, median, and maximal size for each taxa. To test the correlation of element size and platform presence/absence without regard to phylogeny, an ordinary logistic regression was run using the glm function (Fig. 3). To visualize character states on the phylogeny, size and platform presence/absence were mapped at the tips of the phylogeny (Fig. 2) using the plotTree and tiplabels functions from packages ‘phytools’ (Revell Reference Revell2012) and ‘ape’ (Paradis et al. Reference Paradis, Claude and Strimmer2004). To assess the effect of phylogeny on size, Pagel's λ and Blomberg's K were computed with the function phylosig (package ‘phytools’; Revell Reference Revell2012). Although these indexes have shortcomings, they have been shown to be fairly robust and correlate to other more sophisticated measures of phylogenetic signal (e.g., Diniz-Filho et al. Reference Diniz-Filho, Santos, Rangel and Bini2012; Molina-Venegas and Rodríguez Reference Molina-Venegas and Rodríguez2017). K and λ are not applicable to binary characters; therefore, the phylogenetic signal in platform presence/absence was assessed using Fritz and Purvis's D (Fritz and Purvis Reference Fritz and Purvis2010), implemented as function phylo.d in package ‘caper’ (Orme et al. Reference Orme, Freckleton, Thomas, Petzoldt, Fritz, Isaac and Pearse2018). Furthermore, a traitgram (function phenogram, package ‘phytools’) of size, with platform presence/absence mapped, was produced to visualize this phylogenetic signal (Fig. 4). Finally, to test the correlation between size and platform presence/absence in a phylogenetic context, a phylogenetic logistic regression was used (function phyloglm, package ‘phylolm’; Ho and Ane Reference Ho and Ane2014).
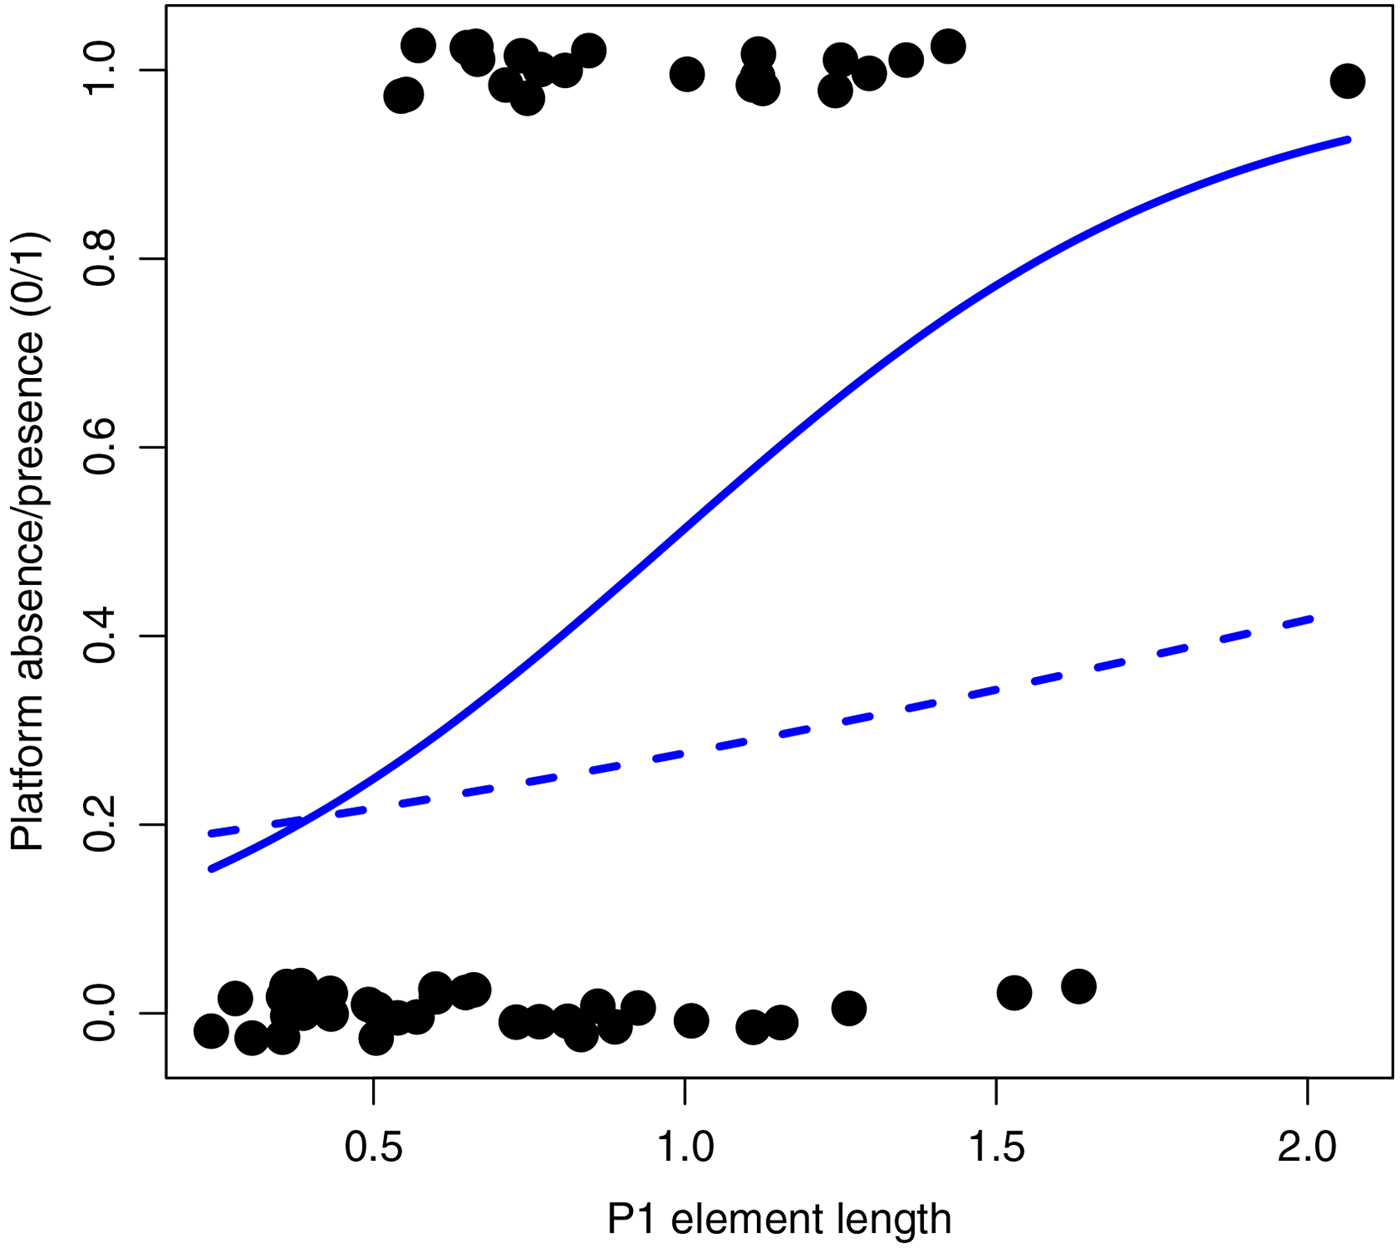
Figure 3. Platform presence (1)/absence (0) plotted against P1 element length. Some jitter was added to the ordinate axis so individual data points could be distinguished, although the actual values are either 0 or 1. Ordinary logistic regression is represented as the solid line, and phylogenetic logistic regression (for the synthetic tree) as the dashed line.
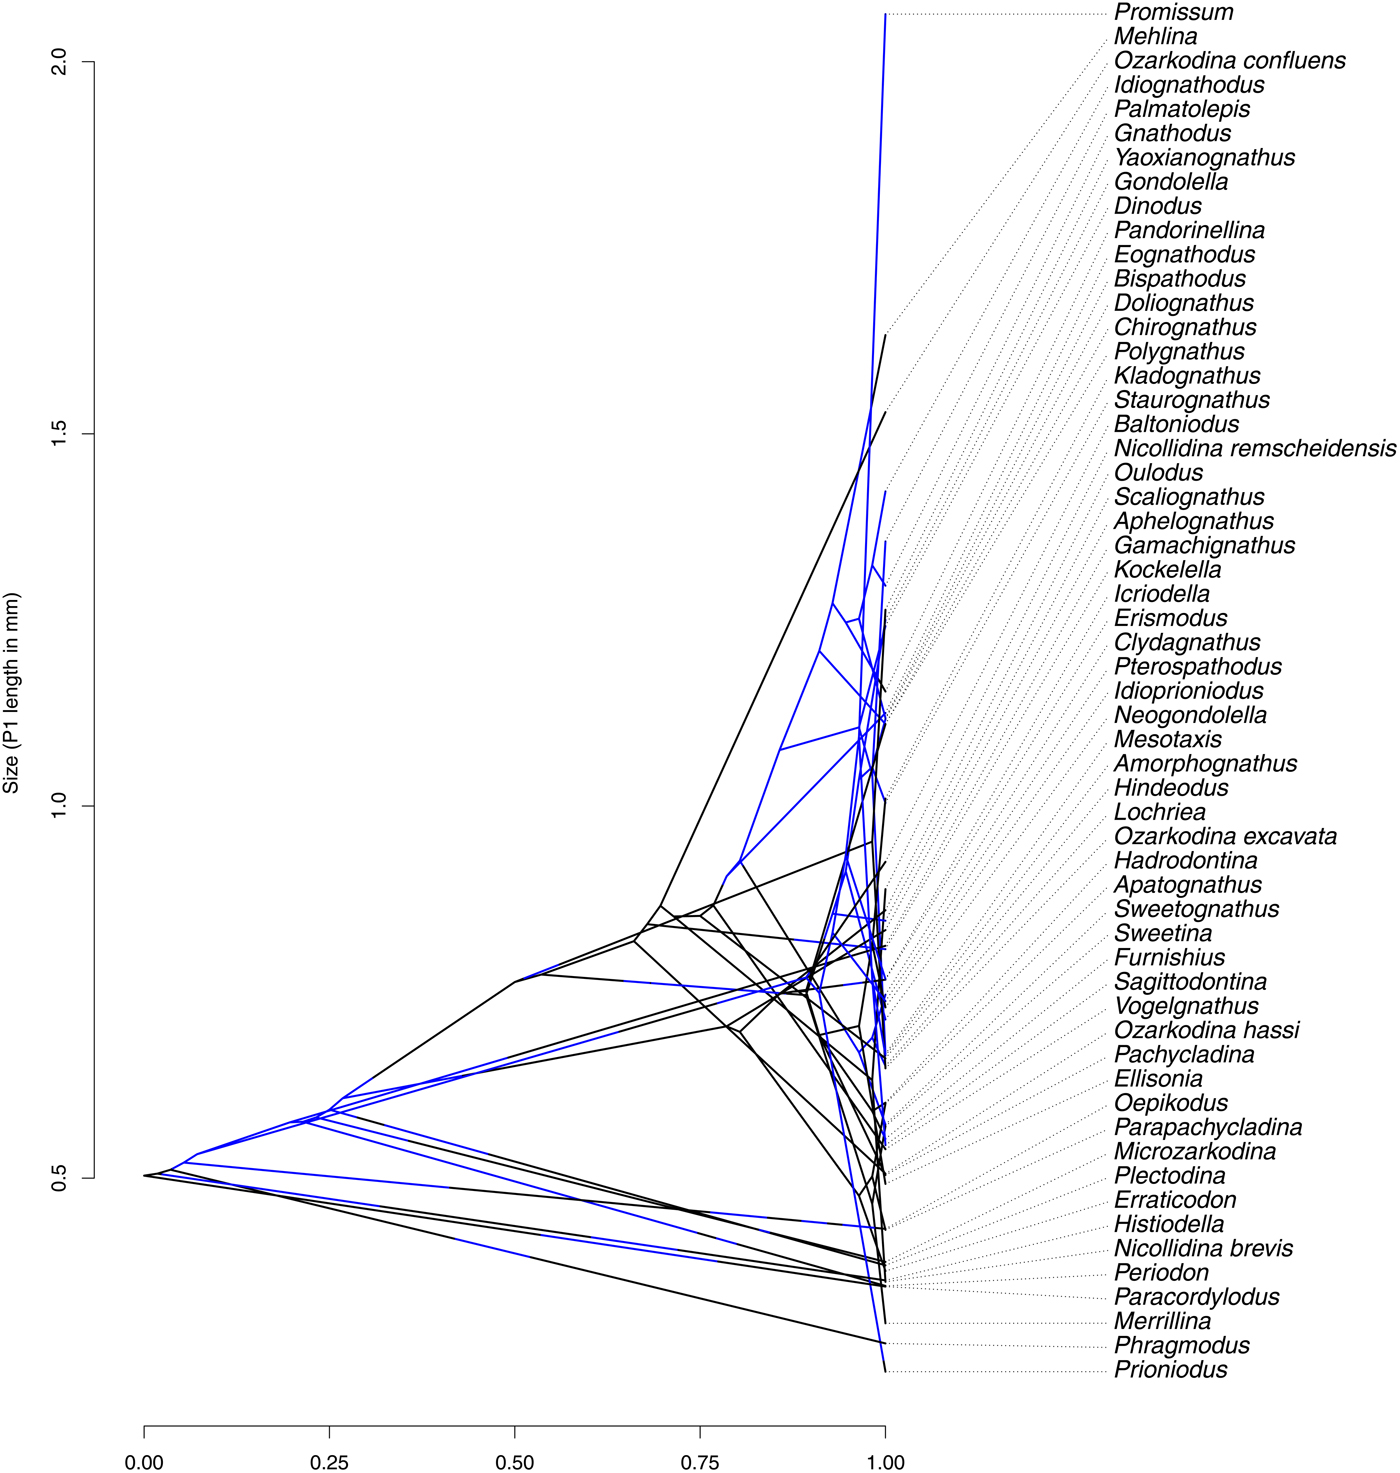
Figure 4. Traitgram representing the variation of size in the synthetic tree, with platform presence (blue in online version; gray in printed version)/absence (black) mapped. The large number of crossing branches illustrates that size distribution is not driven by the phylogeny and that some convergence may be present. It further illustrates that large conodont elements do not always bear platforms, and vice versa.
Results
Phylogenies
Removing the two characters directly coding for platform type and presence/absence had some limited effect on the topology of the tree (Fig. 2B,C). Most of the structure of the tree is retained in both cases, compared with the synthetic phylogeny of Donoghue et al. (Reference Donoghue, Purnell, Aldridge and Zhang2008) (Fig. 2A). Notable differences are found in the position of the clade formed by Sweetina and Merrillina, which are found at the base of the tree when keeping the platform characters, but are part of the Ozarkodinina when excluding them, which fits better with the synthetic tree. The Balognathidae family is mostly similar in all trees, except for Pterospathodus, which is associated to the Bactrognathidae when excluding platform characters. Basal members of the Ozarkodinida are also recovered in the three trees. The position of the clade formed by Yaoxianognathus and Ozarkodina excavata is different between trees we produced and the synthetic tree of Donoghue et al. (Reference Donoghue, Purnell, Aldridge and Zhang2008). It is positioned at the base of Ozarkodinina in the synthetic tree of Donoghue et al. (Reference Donoghue, Purnell, Aldridge and Zhang2008), while it remains in an unresolved position among Ozarkodinida when the platform characters were included or excluded. Finally, the genera Palmatolepis, Mesotaxis, and Dinodus, which form a clade within Polygnathacea in the synthetic tree, are resolved within the “unnamed superfamily” of Donoghue et al. (Reference Donoghue, Purnell, Aldridge and Zhang2008) when the platform characters were included or excluded.
Phylogenetic Signal in Size and Platform Presence/Absence
Because mean, median, and maximal P1 element size all gave closely similar results, only those for mean size are reported in the following sections. Table 1 summarizes the results of tests for phylogenetic signal for size and platform presence/absence over the three topologies used here. All trees produced similar results, with low phylogenetic signal for size and both K and λ values well below 0.5. This is illustrated by a large number of branches crossing in the traitgram represented in Figure 4. Yet K was always found to be significantly different from a random distribution, while λ was never significantly different from the random expectation. Despite this apparent discrepancy, both indices point to low or absent phylogenetic signal. Phylogenetic signal for the presence/absence of a platform was assessed using Fritz and Purvis's D, which in all cases had a value close to zero (Table 2), suggesting that platform presence/absence is never significantly different from the expected distribution under Brownian motion and therefore has high phylogenetic signal.
Table 1. Results from the phylogenetic signal analyses.

Table 2. Results from the phylogenetic logit regressions.
Relationship between Size and Platform Morphology
When disregarding phylogeny, P1 element size was positively correlated with the presence of a platform (Fig. 3; ordinary logistic regression: estimate = 2.324; SE = 0.867; z = 2.680; p = 0.0074). The difference between mean platform element size and mean non–platform element size is about 0.3 mm and significant (two-tailed t-test: t = −3.0708; df = 46.203; p = 0.0036).
When accounting for the phylogeny, however, the correlation between size and platform presence/absence did not remain significant (Fig. 3, Table 2). This is illustrated by the mapping of platform state on the size traitgram (Fig. 4), in which gray (blue online) branches (i.e., presence of a platform) do not necessarily correspond to branches with large sizes. Although its coefficients varied, the size/platform correlation remained nonsignificant across all trees.
Discussion
Within the context of the taxa studied here, which represent some of the best-known conodont genera and species, our results first showed that the phylogenetic relationships between larger clades are robust to the deletion of the platform characters (Fig. 2). Exceptions include Pterospathodus, the Yaoxianognathus + Ozarkodina excavata clade, and the Palmatolepis + Mesotaxis + Dinodus group (not always resolved as monophyletic). The position of the Sweetina + Merrillina clade was also sensitive to the inclusion of platform characters, but these genera were already noted to be “rogue taxa” by Donoghue and colleagues (Reference Donoghue, Purnell, Aldridge and Zhang2008), which makes the inconsistency unsurprising. Pterospathodus was classified as a member of Ozarkodinina by Sweet (Reference Sweet1988), which is also what we found here when excluding the platform characters. When they were included, however, Pterospathodus was included within the Balognathidae, as proposed by Donoghue et al. (Reference Donoghue, Purnell, Aldridge and Zhang2008). This discrepancy may again be due to the lack of knowledge regarding this taxon (also considered a rogue taxa) or to platform homoplasy driving its position in the tree. More recently, a balognathid assignment was firmly supported by Miller et al. (Reference Miller, Heward, Mossoni and Sansom2018). The Yaoxianognathus + Ozarkodina excavata clade remained when the platform characters were excluded. Although its position in the tree changed, the difference is consistent with the various positions found in the analyses of Donoghue et al. (Reference Donoghue, Purnell, Aldridge and Zhang2008). This suggests that the position of the clade, but not its monophyly, is driven partly by the platform characters. Conversely, the genera Palmatolepis, Mesotaxis, and Dinodus retained their positions in the tree, but formed a clade only when the platform characters were excluded. This shows that their monophyly derives from platform character states. Specifically, Dinodus has a different platform type from Palmatolepis and Mesotaxis, which drives the monophyly when excluding the character. Overall, the inclusion or not of the two platform characters proves to have only limited influence on the tree, as mostly rogue taxon positions were influenced. Other discrepancies were also often found in the Donoghue et al. (Reference Donoghue, Purnell, Aldridge and Zhang2008) subset analyses. This suggests that platform homoplasies do not have a large impact on the topology of the tree.
The indices used to measure phylogenetic signal along the various trees used in this study all point toward a low (or even nonsignificant) phylogenetic signal in size (Table 2), suggesting that closely related species do not display similar sizes, as would be expected under Brownian motion. Rather, size seems to be convergent across clades (Fig. 4), with most of its variation being within clades. Considering that size is generally related to trophic level (Romanuk et al. Reference Romanuk, Hayward and Hutchings2011), this would suggest that within clades, various conodonts tended to diversify in their trophic niches. Conversely, the distribution of platform presence/absence appears fairly clumped by clades (Fig. 2A). This is supported by the D index (Table 1), which indicates no difference from the distribution expected under Brownian motion (Fritz and Purvis Reference Fritz and Purvis2010). In other terms, in most instances sister clades show similar morphologies. This suggests that the presence of platform-bearing elements in conodonts can be explained satisfactorily by their evolutionary history and does not require the added assumption of convergent adaptive evolution (although convergent adaptation is not precluded either).
Our results also show that platform-bearing conodonts tend to be larger than those without platforms (Fig. 3). However, the correlation between size and platform presence/absence does not remain significant when accounting for phylogenetic structure. This can be interpreted (for the interpretation of similar cases, see Ives and Garland [Reference Ives, Garland and Zsolt2014]) as size having no effect on the evolution of the phylogenetically constrained platform. This excludes a change in size (due to a change in trophic level) being a common cause in the appearance of platforms. It also excludes the more mechanistic explanation that allometric growth would produce platforms in larger elements/taxa. This is not very surprising, given that the different platform types are developed in very different manners (Donoghue Reference Donoghue1998). It has been previously shown that different types of platform-bearing elements may correspond to different occlusal patterns and different functional constraints, probably reflecting different habitats (Donoghue and Purnell Reference Donoghue and Purnell1999b; Purnell and Jones Reference Purnell and Jones2012; Martínez-Pérez et al. Reference Martínez-Pérez, Plasencia, Jones, Kolar-Jurkovšek, Sha, Botella and Donoghue2014; Suttner et al. Reference Suttner, Kido and Briguglio2018). Hence, the lack of correlation, as well as the convergent pattern seen in size, suggests that, despite some convergence in size, platform presence/absence is probably not due to shared trophic levels among platform-bearing versus non–platform bearing conodonts.
The diversity of element morphologies that are included under the generic term “platform” probably represent very diverse feeding ecologies. Considering the taxonomic (and morphological) diversity of conodonts, it should come as no surprise that they may have occupied a wide variety of niches, but our analysis suggests, in accordance with others (e.g., Purnell and Jones Reference Purnell and Jones2012), that this was the case even among so-called platform conodonts. Further considering that platform development was shown to arise from widely different growth mechanisms (Donoghue Reference Donoghue1998), our results would favor the view that a general platform “convergence” is only superficial. In this regard, stable isotope geochemistry may provide an independent proxy of trophic level that could be combined with size to assess the dietary preferences of different platform conodonts. Although our study shows that adaptive convergence does not need to be invoked to explain the distribution of platform presence/absence across all clades studied here, this does not necessarily exclude that platform appearance may have been a key element to explain diversification within clades (i.e., allowing radiation of some clades) by modifying the accessible dietary niches, as suggested by Martínez-Pérez and colleagues (Reference Martínez-Pérez, Rayfield, Botella and Donoghue2016). Whether this was always linked to higher dissipation of stress, as they suggested, could be tested by using similar approaches across independent lineages with different platform types. The incipient view of conodonts as both morphologically and ecologically diverse should reinforce our interest in their study so we can understand how analogous tooth-like structures drive diversity in vertebrates.
Acknowledgments
The authors warmly thank M. Boivin for her advice concerning phylogenies and the PAUP* software. We also thank E. Jarochowska and one anonymous reviewer for their advice. This study was supported by a French Agence National de la Recherche @Raction grant (ACHN project EvoDevOdonto ANR-14-ACHN-0010).


