


Introduction
The current atmospheric concentration of carbon dioxide (CO2) is 410 ppm, methane (CH4) is 1.8 ppm and nitric oxide (N2O) is 330 ppb (Pittock, Reference Pittock2017). However, only CH4 and N2O are emitted from agriculture. On the other hand, most of the CO2 is taken up by the plant. The global warming potential of CH4 and N2O is 25 and 310 times more than CO2, respectively (IPCC, 2007). In the past decade, N2O budget in the atmosphere has attained stagnancy and is not increasing alarmingly (Davidson and Kanter, Reference Davidson and Kanter2014). This is due to the balanced input of inorganic N fertilizers and adopting integrated fertilizer management strategies. On the contrary, the concentration of atmospheric CH4 is increasing over the years dramatically. For example, during the early 2000s, atmospheric CH4 concentration was rising at about 0.5 ppb (parts per billion) per year. But in the past few years, CH4 concentration is increasing at 9–12 ppb per year (Nisbet et al., Reference Nisbet, Dlugokencky, Manning, Lowry, Fisher, France, Michel, Miller, White and Vaughn2016). Therefore, in the present scenario CH4 is the most important greenhouse gas.
Methane is produced by methanogens through reduction of CO2 or acetate under anaerobic condition. Interestingly soil can consume a significant amount of the atmospheric CH4. It is estimated that about 60–80% CH4 produced from soil gets consumed by methanotrophs in soil itself (Le Mer and Roger, Reference Le Mer and Roger2001; Mohanty et al., Reference Mohanty, Bodelier, Floris and Conrad2006). The methanotrophic bacteria dwelling in soil degrade CH4 and help in mitigating climate change. Methanotrophs not only oxidize methane but also produces microbial biomass improving soil organic carbon. Methanotrophs oxidize CH4 in the presence of O2 to produce CO2. It is estimated that soil consumes 15–45 Tg CH4 per yr (Dutaur and Verchot, Reference Dutaur and Verchot2007). Therefore, CH4 consumption is an important biogeochemical process to mitigate global climate change.
Based on the CH4 consuming potential methanotrophs are divided into two major categories type I and type II (Conrad, Reference Conrad1996). The type I methanotrophs are capable of oxidizing CH4 at high concentration. Type II methanotrophs mainly consume CH4 under low or atmospheric concentration. Type I oxidize CH4 at the source points while the type II in non-source areas. For example, type I are mainly found in the flooded rice field, wetlands, and composting systems while type II are dominant in upland agricultural soils and forest ecosystem. Soil physico-chemical properties are altered by agricultural practice, thus influence CH4 oxidation in soil (Mancinelli, Reference Mancinelli1995). Therefore, agricultural practices play key role influencing CH4 consumption.
In recent years, conservation agriculture (CA) is recommended over conventional agriculture for sustaining soil health, improved agriculture and climate change mitigation (Lal, Reference Lal2019). Globally, CA is being practised on about 180 M ha (Kassam et al., Reference Kassam, Friedrich and Derpsch2019). The major CA practising countries are USA (26.5 M ha), Argentina (25.5 M ha), Canada (13.5 M ha) and Australia (17.0 M ha) (Chinseu et al., Reference Chinseu, Dougill and Stringer2019). In India, CA practice is not widely adopted; only 1.5 M ha is adopted under zero tillage CA (Jat et al., Reference Jat, Wani and Sahrawat2012). Conservation agriculture includes minimum soil disturbance, permanent soil cover, and diversified crop rotations (Thierfelder et al., Reference Thierfelder, Mwila and Rusinamhodzi2013). CA is being practised on more than 5 M ha in South Asia and the area under CA is expanding (Rahman, Reference Rahman2003). The change in land use practice due to CA is likely to alter the soil properties like improving water infiltration, reduce erosion, reduce compaction, increase surface soil organic matter and carbon content, and improve soil aggregates (Hobbs et al., Reference Hobbs, Sayre and Gupta2008).
Among various CA practices, no-tillage exhibits a promising effect on improving soil health (Nunes et al., Reference Nunes, van Es, Schindelbeck, Ristow and Ryan2018). The soil C content may increase significantly with no-tillage CA compared with tilled soils (Blanco-Canqui and Ruis, Reference Blanco-Canqui and Ruis2018), while microbial biomass C can also increase under no-tillage (Schmidt et al., Reference Schmidt, Gravuer, Bossange, Mitchell and Scow2018). Greater CO2 emission and higher respirational quotients have been reported from tilled soils compared to zero tilled soils (Xiao et al., Reference Xiao, Xiao, Ye, Zhang, He and Wang2019). Furthermore, various microbial enzyme activities have been reported to be higher in zero tilled soils (Mangalassery et al., Reference Mangalassery, Mooney, Sparkes, Fraser and Sjögersten2015). However, there are limited literature with regard to methane monooxygenase activity in response to tillage and cropping systems. It is hypothesized that long-term cropping system experiments with and without tillage could provide a better ecosystem to understand CH4 consumption in response to soil and crop attributes. Therefore, the objectives of the current study were to estimate the CH4 consumption potential of soybean-wheat (SW), maize-wheat (MW) and maize-gram (MG) cropping systems under conventional and no-tillage agricultural practices and to define an efficient cropping system and tillage practices for climate mitigation of tropical vertisols.
Materials and methods
Experimental field layout, cropping systems and tillage
A field experiment was initiated in 2010 at the Indian Institute of Soil Science, Bhopal, Madhya Pradesh, India (23°18′N/77°24′E, 485 m a.s.l.). The experimental site was established with the aim of continuing for a long period to understand the mechanistic processes involved in nutrient dynamics under the influence of different conservation agriculture practices. The current study was undertaken during the kharif season (July–October) of 2018, representing the outcome of 9 years of cropping period and 18 cropping seasons. A total of 18 fields each of 10 m × 10 m size were laid out in a randomized block design. The experimental components were 3 cropping systems × 2 tillages × 3 replicates. Cropping systems were SW, MW and MG. Fields were prepared using either conventional tillage or no tillage. Soybean (Glycine max L., var JS 335.), wheat (Triticum durum L., var Sujatha C- 306), maize (Zea mays L., var Kanchan hybrid 101) and gram or chickpea (Cicer arietinum L var JG 130) were sown in the experimental plots. Soybean and maize were cultivated during the kharif season while wheat and chickpea were grown during the rabi season (October–March) since the beginning of the experiment. Both soybean and maize were sown on 5 July 2018. Seeds were sown at different spacings, for soybean 20 cm × 15 cm, maize 60 cm × 20 cm, wheat 20 cm × 10 cm and gram 30 cm × 10 cm. Fertilizers were applied as urea N: P2O5 : K2O in kg per ha for soybean 30 : 60 : 30, wheat 120: 60: 40, maize 120 : 60 : 40, and gram 40:60:30. Soybean was harvested after 95 days of sowing, while maize from both MW and MG cropping systems was harvested after 98 days of sowing. After each cropping season, 30% crop biomass residue was left in no-tillage while no residues retained in conventional tillage.
Soil sampling
Soil samples were collected from two depths (0–5 and 5–15 cm) using an auger during vegetative stages of crops (about 45 days of sowing). Sampling was done from the soybean and maize fields of representative cropping systems during kharif 2018. Soils were sampled from four corners and centre of the fields. At each sampling point, the upper soil layer was removed to get rid of plant material and coarse gravels. An auger (5 cm i.d) was used to collect soil cores of 30 cm. Cores of 0–5 and 5–15 cm depths were only used for the experiment. Soil cores collected from the five sampling zones of field (4 corners and 1 centre) were homogenized to form a composite soil sample. Composite soils were ground and hand processed to remove stones, large gravels, plant tissue materials. Collected soil samples were air dried under shade and then passed through 2 mm sieve and stored in plastic containers. Soils were used within 2 days of sampling.
Soil physico-chemical properties
Soil samples were analysed to estimate physical and chemical properties. The soil is a heavy clayey Vertisol (Typic Haplustert). The electrical conductivity (EC) was 0.43 dS/m and the pH was 7.5 (1 : 2.5 of soil and water in w : v) (Smith and Doran, Reference Smith and Doran1996). The textural composition of the soil was: sand 15.2%, silt 30.3%, clay 54.5%. Soil organic C was determined by wet digestion method (Walkley and Black, Reference Walkley and Black1934). Available N was determined by alkaline KMnO4 method (Subbiah and Asija, Reference Subbiah and Asija1956). Available P was extracted by 0.5 N NaHCO3 solution buffer at pH 8.5 (Olsen, Reference Olsen1954) and P in the extract was determined by the ascorbic acid method (Watanabe and Olsen, Reference Watanabe and Olsen1965). Available K was extracted by shaking with neutral normal ammonium acetate for 5 min (Hanway and Heidel, Reference Hanway and Heidel1952) and then K in the extract was determined by a flame photometer (Lindsay and Norvell, Reference Lindsay and Norvell1978). Soil parameters of the experimental fields are presented in Table 1.
Table 1. Physico-chemical properties of soils of experimental fields
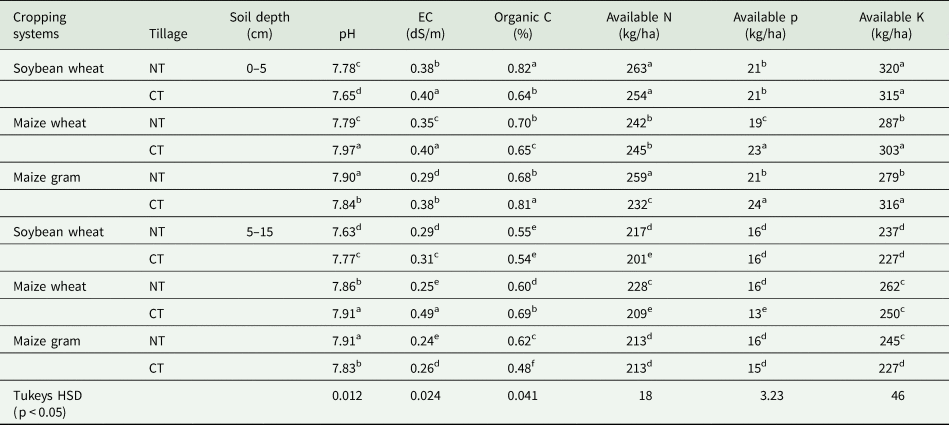
Fields were maintained under conventional tillage (CT) with residue removed; no-tillage (NT) with residue retained. Three cropping systems were soybean (Glycine max L.) – wheat (Triticum durum L.), maize (Zea mays L.)- wheat, and maize – gram (Cicer arietinum L). The varieties were soybean (JS 335); maize (Kanchan hybrid 101); gram (JG 130); wheat (Sujatha C- 306). Spacing for soybean was 20 cm × 15 cm, maize 60 cm × 20 cm, wheat 20 cm × 10 cm and gram 30 cm × 10 cm. Fields were laid out in split plot design with three replicates. Fertilizers applied as N: P2O5 : K2O in kg per ha for soybean 30:60:30, wheat 120: 60: 40, maize 120 : 60 : 40 and gram 40: 60: 30. Soil samples were collected after harvest of 9th year crop (kharif 2018) for analysis of soil properties. Each value represents the arithmetic mean of three replicates. Values followed by the same letters are not significantly different at P < 0.05.
Set up to estimate methane consumption potential
Experiments were carried out with the following components: three cropping systems (soybean-wheat SW, maize wheat MW, and maize gram MG), two tillage practices (conventional tillage CT, no-tillage NT), two soil depths (0–5, 5–15 cm), and three replicates. Total of 36 serum bottles was prepared for this study. Incubation was carried out following methods as described elsewhere (Mohanty et al., Reference Mohanty, Kollah, Chaudhary, Singh and Singh2015). Briefly, a portion of 20 g soil was placed in 130 ml sterilized serum bottles. Soils were moistened with 5 ml sterile distilled water to attain 60% moisture-holding capacity. The contents of the vials were mixed thoroughly, capped with rubber septa and sealed using aluminium crimp seal. Pure CH4 was injected into the headspace of the vials for a final concentration of 1000 ppm. Vials were incubated at 28 ± 2°C in a biological oxygen demand (BOD) incubator (Metrex scientific instruments pvt ltd, N Delhi, India). At regular intervals (~1day), 0.1 ml of headspace gas was analysed for CH4. After each sampling, the headspace was replaced with an equivalent amount of high purity helium (He) to maintain atmospheric pressure. The gas He was used because of its inert chemical nature. Vials were incubated for 15 days. The rate constant of CH4 consumption (k) was determined from the slope of log-transformed values of CH4v. time during the rapid decline phase.
Methane estimation
The CH4 concentration in the headspaces of serum bottles was analysed using a gas chromatograph (CIC, India) equipped with an FID and a Porapak Q column (2-m length, diameter 2/8”, 80/100 mesh, stainless steel column) as described elsewhere (Mohanty et al., Reference Mohanty, Bandeppa, Dubey, Ahirwar, Patra and Bharati2017). The injector, column and detector were maintained at 120, 60 and 300°C, respectively. Under these conditions, the retention time of CH4 was 1.3 min. The GC was calibrated before and after each set of measurements using different mixtures of CH4 in N2 (Sigma Gases, New Delhi, India) as primary standards (CH4 100 ppm).
DNA extraction
After CH4 consumption, about 0.5 g soil samples were taken out from bottles to extract DNA using the ultraclean DNA extraction kit (MoBio, USA) according to the manufacturer's instructions. The DNA concentrations were determined in a biophotometer (Eppendorf, Germany) by measuring absorbance at 260 nm (A260), assuming that 1 A260 unit corresponds to 50 ng of DNA per μl. DNA extraction was further confirmed by electrophoresis on a 1% agarose gel. The extracted DNA was dissolved in 50 μl TE buffer and stored at −20°C until further analysis.
Real time polymerase chain reaction quantification of methanotrophs pmoA gene
Real time polymerase chain reaction (PCR) was performed on a Step one plus real time PCR (ABI, USA) to quantify the representative microbial species. Reaction mixture prepared with 2 μl of DNA template, 10 μl of 2X SYBR green master mix (Affymetrix, USA), 200 nm of primer (GCC Biotech, N Delhi). The final volume of PCR reaction mixture was made to 20 μl with PCR grade water (MP Bio, USA). Primers targeting pmoA gene (particulate methane monooxygenase) of methanotrophs were used to quantify their abundance. The primers for pmoA were A189F (5- GGN GAC TGG GAC TTCT GG-3) and mb661R (5- CCG GMG CAA CGT CYT TAC C-3) (Mohanty et al., Reference Mohanty, Bandeppa, Dubey, Ahirwar, Patra and Bharati2017). This primer set targets methanotrophs covering both type I and II including Methylobacter or Methylosarcina, Methylococcus, Methylosinus group, Methylocapsa, Nitrosococcus. Quantification of microbial genes was carried out by real time PCR approach targeting the functional groups (Kolb, Reference Kolb2009). Thermal cycling was carried out by an initial denaturalizing step at 94°C for 4 min, 40 cycles of 94°C for 1 min, 52°C for 30 s, 72°C for 45 s; final extension carried out at 72°C for 5 min. Fluorescence was measured during the elongation step. Data analysis was carried out with Step one plus software (ABI, USA) as described in the user's manual. The cycle at which the fluorescence of the target molecule number exceeded the background fluorescence (threshold cycle [CT]) was determined from the dilution series of target DNA with defined target molecule amounts. Conventional tillage was proportional to the logarithm of the target molecule number. The quality of PCR amplification products was determined by melting curve analysis with a temperature increase of 0.3°C per cycle. The standard for the genes was made from a series of 10-fold dilutions of purified amplified products and data presented as a number of cells per gram of soil.
Statistical analyses
All statistical analyses were carried out using the ‘agricolae’ and ‘vegan’ packages of the statistical software R (2.15.1) (Ihaka and Gentleman, Reference Ihaka and Gentleman1996). Results for the experiments were presented as arithmetic means and standard deviation of triplicate observations. Tukey's honestly significant difference (HSD) test was performed to define the significant difference among treatments at α 0.05. Correlation among factors (cropping systems, tillage, and soil depth) and variables or parameters (CH4 consumption, an abundance of methanotrophs, soil and plant parameters) was tested by correlation analysis using cor.test command. Principal component analysis (PCA) was presented as 2-dimensional ordination biplot. The biplot exhibits the relative significance of the vectors (factors) and variables. PCA was computed by prin.comp command using ANOVA data.
Results
Soil chemical properties
Soil pH was in the range of 7.63–7.91 during sampling (kharif 2018). Soils from no-tillage had lower pH than conventional tillage (P < 0.05), particularly in MW. Electrical conductivity (EC) values were in the range of 0.0.24 dS/m to 0.49 dS/m. Electrical conductivity values were higher in the upper soil layer (0–5 cm) than lower soil layer (5–15 cm). EC values were higher in CT than NT. Among the cropping systems, EC followed as MW> SW>MG. Soil organic C (SOC) ranged from 0.48 to 0.82%. SOC was higher in NT than CT. Soil organic carbon was higher in the upper soil layer than lower soil layers irrespective of cropping systems. Available N (kg/ha) varied from 201 to 263. Available N decreased with soil depth. However, N content was high in soils of no-tillage. Available P was in the range of 13 to 24 kg/ha. Available K varied from 227 to 320 kg/ha. Both N and P were high in 0–5 cm and low in 5–15 cm.
Methane consumption potential
Temporal variation of CH4 concentration depicting CH4 consumption is presented in Fig. 1. The initial CH4 concentration was 43.49 μg/g soil. Complete consumption of head space CH4 occurred in 12 days. The pattern of CH4 consumption followed the trend of a classical microbial growth cycle, with an initial lag phase followed by an active log phase and stationary phase. The initial lag phase was observed within 3 days. Methane consumption potential or rate k estimated from the slope of the rapidly declining log phase and presented as μg CH4 consumed/g soil/d (Table 2). Rate of CH4 consumption varied from 0.350 to 0.560. Methane consumption rate was higher in 0–5 cm upper soil layer than 5–15 cm. The rate remained higher in NT than CT irrespective of treatments. Among the different cropping systems, CH4 consumption rate was highest in MW followed by SW and MG. No-tillage increased CH4 consumption rate by a factor of 1.2–13.4% over CT. However, the magnitude of increase in CH4 consumption rate by NT was highest in MG followed by SW and MW in upper 0–5 cm soil layer. Similarly, in 5–15 cm soil, CH4 consumption rate increased by NT over CT, with highest in SW (14.05%) followed by MG (10.14%) and least by MW (1.22%).

Fig. 1. Consumption of CH4 in rhizospheric soil of crops under different cropping systems and conservation agricultural practices. Cropping systems were soybean-wheat (SW), maize-wheat (MW), and maize-gram (MG). Conservation agriculture practices were conventional tillage (CT) and no tillage (NT). Soil samples were collected after 9 years, during kharif season 2018, from two depths (0–5, and 5–15 cm). Crops selected for this study were soybean from SW, and maize from MW and MG. Soil sampling was done during vegetative period of the crops. Different panels represent as a-SW CT, b-SW NT, c-MW CT, d-MW NT, e-MG CT, f-MG NT. Y-axis represents decline of CH4 concentration in the headspace of microcosms and X-axis represent incubation period (in days). Each data point represents the arithmetic mean and error bars as standard deviation of three replicated observations.
Table 2. Methane consumption rate and abundance of pmoA gene in rhizospheric soil of crops under different cropping systems and conservation agricultural practices
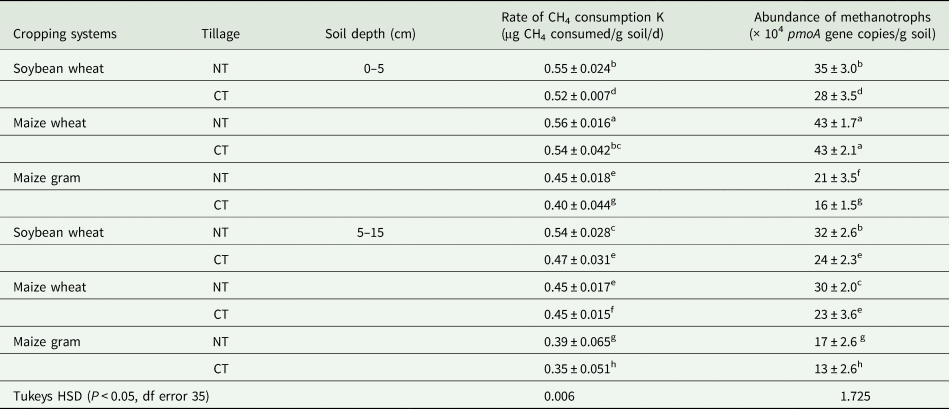
Cropping systems were soybean-wheat (SW), maize-wheat (MW) and maize-gram (MG). Conservation agriculture practices were conventional tillage (CT) and no-tillage (NT). Soil samples were collected from two depths (0–5 cm and 5–15 cm). Crops were soybean from SW, and maize from MW and MG cropping systems. Soil sampling was done during vegetative period of the crops. The sampling period represents 9th year of cropping period (kharif 2018). Each value represented as the arithmetic mean ± standard deviation of three replicated observations. Values followed by the same letters are not significantly different at P < 0.05.
Abundance of methanotrophs pmoA gene
Abundance of pmoA gene copies in the soil samples was estimated to define the effect of cropping systems, tillages and soil depths on methanotrophs abundance. Methanotrophs abundance ranged from 13 × 104/g soil to 43 × 104/g soil (Table 2). Methanotrophs were highest in MW followed by SW and MG. Upper soil layers (0–5 cm) had higher methanotrophs abundance than 5–15 cm depth irrespective of crops or tillage. Methanotrophs abundance was higher in no-tillage than conventional tillage.
Crop yield parameters
Both biomass and grain yield were estimated after harvesting the crop (Table 3). Soybean was harvested from SW 95 days after sowing and maize were harvested 98 days after sowing from MW and MG. Biomass yield of SW and MW was higher in NT than CT, while there was no significant difference in case of MG. Grain yield increased in NT than CT in maize gram cropping system. Relative (%) increase in the biomass yield and grain yield was highest in SW and lowest in MW.
Table 3. Crop yield parameters in response to cropping systems and tillage practices

The different tillage practices were no-tillage (NT) and conventional tillage (CT). Crops were harvested cropping season. Soybean yield equivalent represents the yield values of crops in terms of soybean. Each data represents the arithmetic mean ± standard deviation of three replicated observations. Values followed by the same letters are not significantly different at P < 0.05.
Pearson product moment correlation and principle components analysis interpretation
Pearson product moment correlation analysis carried out to examine the correlation between any two parameters (Table 4). Methane consumption rate k and abundance of pmoA gene copies significantly correlated (P < 0.05) with all soil and plant attributes. Soil organic C significantly correlated with available N, P and K. Grain yield significantly correlated (P < 0.05) with biomass. Available N, P and K correlated significantly (P < 0.05) with each other. To define the relation among the factors and parameters, data were interpreted through a PCA biplot (Fig. 2). PC1 contributed 62.36% variation and PC2 contributed 21.38% variation. The vector of CH4 consumption rate k was closely placed with the vectors of available N, P and K. The vector of pmoA was closely related to biomass yield and grain yield. Vectors k and pmoA were closely related to MW NT (maize-wheat under no-tillage) and also with SW NT (soybean-wheat under no-tillage), SW CT (soybean-wheat under conventional tillage), and MW CT (maize-wheat under conventional tillage). However, these vectors were distantly placed from MG NT (maize-gram under no-tillage) and MG CT (maize-gram under conventional tillage).

Fig. 2. Ordination biplot of principal component analysis (PCA) with component 1 and 2 as major factors. Vectors of variables presented as lines representing parameters and factors (symbols) represented as cropping system, tillage and soil depth. PC1 contributed 62.36% and PC2 contributed 21.38% to total variation. The variables were CH4 consumption rate k, an abundance of pmoA gene copies, crop grain yield and biomass yield, soil organic C, available N, available P and available K. In PCA, arrows with narrow angles are strongly correlated; arrows that are perpendicular show no correlation and arrows in opposite directions indicate a negative correlation. Symbols within the plot represent treatments including cropping systems, tillage and soil depth. Symbol of three replicates is shown. Cropping systems were soybean-wheat (SW), maize wheat (MW) and maize gram (MG). Tillage practices were no-tillage (NT) and conventional tillage (CT). Soil samples were collected after 9 years, during kharif season 2018. Soil depths were 0–5 and 5–15 cm. Codes indicate the detail of samples. For instance, SW-CT 0–5 represents soils of soybean wheat cropping system under conventional tillage and 0–5 cm depth. Each treatment is mentioned against one of the three replicates (symbols), For example, black filled squares represent SW CT 5–15 cm as soils from soybean-wheat cropping system under conventional tillage at 5–15 cm.
Table 4. Pearson's product-moment correlation among different parameters of the study

P values of correlation are in parenthesis. The parameters were k (CH4 consumption rate), pmoA (abundance of particulate methane monooxygenase gene copies), OC (organic carbon), grain yield and biomass yield, available N (Avl N), available P (Avl P) and available K (Avl K).
Discussion
The present experiment envisages evaluating the CH4 consumption potential of a tropical vertisol in response to cropping systems, tillage and soil depths. Experiments were carried out in field plots where the cropping systems and tillage were maintained uniformly for 9 years. Two tillage practices were implemented comprising conventional tillage (CT) and no-tillage (NT). Conventional tillage is a common practice widely adopted by the farming community, while the NT is the recommended practice to farmers for establishing sustainable agriculture based on the fact that no-tillage has many beneficial effects on soil, plant ecosystem (Zhang et al., Reference Zhang, Li, Gregorich, McLaughlin, Zhang, Guo, Liang, Fan and Sun2018). Still, the majority of farmers stick to conventional tillage practice. Three cropping systems were evaluated in the experiment: soybean-wheat (SW), maize-wheat (MW) and maize-gram (MG). These cropping systems are commonly practised in tropical vertisols. Two depths were taken into account: surface layer (0–5 cm) and deeper layer (5–15 cm), to examine if the crop residue retention due to conservation agriculture influences methanotrophy.
Methane consumption rate was higher in upper 0–5 cm than the lower 5–15 cm, indicated active methanotrophy in the upper soil layer. Generally, methanotrophic activity is aerobic in nature, justifying high CH4 consumption in the upper soil layer. The values of the rate of CH4 consumption match with our previous studies (Mohanty et al., Reference Mohanty, Bandeppa, Dubey, Ahirwar, Patra and Bharati2017). No-tillage exhibited higher CH4 consumption than conventional tillage. No-tillage improves a spectrum of soil biological activities including methanotrophy. Rate of CH4 consumption significantly correlated with methanotrophs abundance.
Cropping systems varied influencing CH4 consumption in response to tillage. Maize-gram (MG) was most effective in stimulating CH4 consumption followed by SW and MW at 0–5 cm depth. Thus, no-tillage can have a differential impact on the cropping systems with respect to their CH4 consumption potential. Soil available N, P and K was highest in MG than other cropping systems. Probably, these nutrients play a significant role in CH4 consumption. The positive effect of N on CH4 consumption has been observed in other studies (Mohanty et al., Reference Mohanty, Bodelier, Floris and Conrad2006). Effect of N on CH4 consumption can also vary. For example, in a study, it was observed that small N additions tend to stimulate methane consumption, whereas large additions of N are inhibitory (Peng et al., Reference Peng, Wang, Li, Yang, Fang, Liu, Qin, Zhang, Zhou and Fang2019). The relation between CH4 consumption and P was explored in an experiment, where the P content correlated positively with the CH4 consumption (Yang et al., Reference Yang, Wang and Xu2017).
Methane consumption potential of MW was highest irrespective of soil depth and tillage. However, no-tillage had a significant positive effect on CH4 consumption in MG and SW than MW. Both leguminous plants (soybean and gram) have high N content in their biomass, which are released upon decomposition, favoured CH4 consumption compared to the maize. Abundance of methanotrophs was estimated in terms of the numbers of pmoA gene copies. Although methanotrophs abundance was highest in MW, the magnitude of increase in their abundance due to no-tillage was highest in MG (30.61%) followed by SW (23.52%) and MW (0.781%). Variation in the abundance of pmoA correlated significantly with CH4 consumption rate. No-tillage primarily stimulated methanotrophs resulting in higher CH4 consumption over conventional tillage. In a study, microbial enzyme activities estimated in temperate soils under NT and CT. Microbial biomass was 30% greater in NT than CT soils, Microbial enzyme activities including β-glucosidase, dehydrogenase, phenol oxidase, cellulase, peroxidise, and xylanase were higher in no-tilled soils (Mangalassery et al., Reference Mangalassery, Mooney, Sparkes, Fraser and Sjögersten2015).
The increase in soil C probably stimulated methane mono-oxygenase activity. Methane consumption rate, pmoA gene copies increased significantly in MG and SW cropping systems. The differential effect of crop biomass on pmoA gene abundance could be due to the high N content. However, it remains unclear how the crop biomass influenced pmoA gene.
Crop yield parameters were higher in NT than CT. The effect of NT towards the yield was high in SW or MG and low in MW. No-tillage increased crop yield as the soil nutrients like organic C, available N, available P and available K were higher in NT. Similar findings have been reported earlier. For example, no-tillage improved the yield of cereal-legume in Mediterranean croplands (Alarcón et al., Reference Alarcón, Hernández-Plaza, Navarrete, Sánchez, Escudero, Hernanz, Sánchez-Giron and Sánchez2018), winter wheat-maize-soybean rotation at Canada (He et al., Reference He, Yang, Drury, Smith, Grant, He, Qian, Zhou and Hoogenboom2018), 25 years of monoculture of corn in New York (Nunes et al., Reference Nunes, van Es, Schindelbeck, Ristow and Ryan2018).
Soil pH was low in MW NT compared to MW CT. Soil pH has been reported to be low in no-till systems compared to CT (Rahman et al., Reference Rahman, Okubo, Sugiyama and Mayland2008). The low pH in NT could be attributed to the residue decomposition. The concentration of electrolytes increases in NT resulting low pH (Reeves and Liebig, Reference Reeves and Liebig2016). No significant effect of cropping systems on pH was observed. Probably, cop biomass retention does not change soil pH. Else, a significant change in soil pH may occur after more years of residue retention. Soil EC was higher in the upper soil layer (0–5 cm) than 5–10 cm. A similar observation has been reported, where CA found to increase EC of the surface horizon (0–5 cm) (Husson et al., Reference Husson, Brunet, Babre, Charpentier, Durand and Sarthou2018).
Soil organic matter, available N, available P were higher at the upper layer than the lower layer. Low EC in no-tillage could be due to the association of organic matter with the ions. On the contrary, ions were comparatively less associated with organic matter, as no residues were retained in CT, resulted in high EC. High EC in MW cropping system could be due to high microbial activity.
Organic C was high in NT, indicated improved C sequestration by NT. Available N and available K were high in the upper soil layer (0–5 cm) and low in deeper soil layer (5–15 cm). Possibly, nutrients at the lower soil depth were assimilated by plant favourably by root, resulted in lower available nutrients. In a study, the effect of tillage and crop residue returning on soil C in northern China was explored. No-tillage and straw returning promoted soil macro-aggregation and aggregate stability at the 0–10 cm depth. Due to which the organic C stock was 20.7% higher in 0–5 cm soil and 7.5% higher in 5–10 cm soil under no-tillage than continual tillage (Si et al., Reference Si, Liu, He, Sun, Dong, Yan and Zhang2018).
Methane consumption rate k and abundance of pmoA genes significantly correlated with all soil and plant parameters indicated that both soil and plant parameters play an important role in shaping methanotrophic activity. Soil organic matter, available N, P and K are important for CH4 consumption like other soil microbial processes. Grain yield parameters like crop biomass and grain yield significantly correlated with CH4 consumption rate k indicated that crop growth stimulates CH4 consumption. To depict the relative correlation among factors and variables, PCA was performed. Vector of k and pmoA were closely associated with crop parameters than soil nutrients. This indicated that plant growth is an important feature to enhance CH4 consumption. However, the mechanism of such an effect remains elusive. Further studies on plant root exudates and methanotrophic activity may shed light on this aspect.
Conclusions
This study suggests that a maize-gram/chickpea cropping system and no-tillage contribute to high CH4 consumption in tropical vertisols. However, there is a need for a better understanding of the mechanistic processes that regulate CH4 consumption. A characterization of the biomolecules that result from the degradation of crop residues and root exudates could provide key information, justifying the intensification of conservation agriculture towards climate mitigation.
Financial support
This research was part of the India Argentina Bilateral (dst/int/Argentina/P-11/2015) and SERB (EMR/2016/000511) projects, funded by Department of Science and Technology (DST), Ministry of Science and Technology, India.
Conflicts of interest
Authors also declare no conflict of interest of any type associated with this manuscript.
Ethical standards
Not applicable.


