

It is widely recognized that the responses obtained in surveys are not themselves direct measures of beliefs, values, or emotional states. Rather they represent accessible assessments of what are, in effect, latent, i.e., unobserved phenomena, such as attitudes, intelligence, partisan orientations, and other theoretically vital concepts (Lord, Ross and Lepper Reference Lord, Ross and Lepper1979; Nunnally and Bernstein Reference Nunnally and Bernstein1994; Borsboom, Mellenbergh and van Heerden Reference Borsboom, Mellenbergh and van Heerden2003). Out of this research tradition come two clear standards for evaluating measures of latent concepts: reliability and validity. Reliability, of course, identifies the measure’s stability and consistency. Validity refers to how well a measure captures what it purports to assess. Validity has various forms, but one variant, construct validity, is assessed by examining whether relationships between theoretically relevant dependent variables and the test measures under evaluation conform to theoretically specified relationships (Campbell and Fiske Reference Campbell and Fiske1959; Alwin Reference Alwin2010). Additionally, other considerations may influence which method one might adopt: time to complete (typically shorter is better); numerical quality of scores (preferring continuous data over ordinal level data, and ordinal level data over dichotomous data); and minimizing missing data so as to obtain valid data from most, if not all, participants (Krosnick and Presser Reference Krosnick and Presser2010). A variety of methodologies have been used to obtain measures of emotion that do not rely on survey items, among them electromyography (EMG), electroencephalography (EEG), and functional magnetic resonance imaging (fMRI). Mauss and Robinson (Reference Mauss and Robinson2009) provide a review. Ruef and Levenson (Reference Ruef and Levenson2007) have proposed the use of physical “affect dials.”Footnote 1 However, the psychometric properties of measuring people’s emotional reactions suitable for experiments and surveys is relatively sparse.
This lapse is of particular importance because the social scientific research literature on emotion and its impact on decision-making and action has expanded quite remarkably over recent years (Brader and Marcus Reference Brader and Marcus2013). While there is research on the reliability and validity of available measures of subjective self-report of emotional response, the extant published research has largely focused on which emotions to measure (Watson Reference Watson1988b; Watson and Clark Reference Watson and Tellegen1994; Watson and Clark Reference Watson, Wiese, Vaidya and Tellegen1997; Marcus et al. Reference Marcus and MacKuen2006) and less so on the particular ways in which respondents can indicate how much, or little, they are experiencing a targeted emotion.
Reliability can be easily evaluated provided, as is the case here, multiple indicators of each latent concept are available. Assessing validity is less straightforward. While face validity is always available for assessment, it represents a rather weak and potentially subjective standard. We turn, instead, to construct validity for a more demanding test. Construct validity requires a theoretical foundation so that empirical relationships between variables can be used to determine whether prospective measures are functioning as theoretically expected. In the section that follows, we outline the theoretical basis for identifying which emotions to examine and the theoretical basis for the substantive relationships used to assess the different measures of emotion we examine below. Thereafter we turn to the research design, data, results, and discussion.
Emotion and its Anticipated Effects
Interest in emotion in politics was evident when the behavior approach to the study of politics was launched supported by the then new interest in survey research. Much of that flowed from discovery that partisan identification was key to understanding the American electorate’s political behavior (Campbell et al. Reference Campbell, Converse, Miller and Stokes1960; Campbell et al. Reference Campbell, Converse, Miller and Stokes1966). Partisan identification was defined as an “affective orientation to an important group object” (Campbell et al. Reference Campbell, Converse, Miller and Stokes1960, 121). This definition is derivative of the notion affect in attitude theory wherein an attitude is understood as having three facets (Allport Reference Allport1954; McGuire Reference McGuire1969). Attitudes are constructed from what we know (the cognitive component); how we feel about what we know (the affective component); and what we do with that knowledge and assessment (the behavior component). As with the then concurrent development of feeling thermometers, the affect component was understood as a single valence dimension (ranging from how liked to how disliked) and as the passive receptacle of evaluations passed on from the cognitive component, thereby being conceived then as an “affect tag” (Fiske and Taylor Reference Fiske and Taylor1991). But little research was done to ascertain whether people actually derived their affective reactions via cognitive assessments and that such evaluations could be validly described as a single valence like–dislike dimension.
During this same period a more complex view of emotion emerged, cognitive appraisal theories. Two features stood out. First, as with the attitude view, affect was understood to derive from conscious assessments (Izard Reference Izard1971; Izard Reference Izard1977; Roseman Reference Roseman1979; Roseman Reference Roseman1984; Ortony, Clore and Collins Reference Ortony, Clore and Collins1989). But, unlike the simple structure of affect as valence, cognitive appraisal theories held that most people would, at the end of the appraisal process, arrive at a single discrete emotional state, there being anywhere from 8–12 or more such “basic” emotions (different theorists argued for somewhat different lists of these basic discrete emotions). In this view, for example, something bad would be felt as anger if the bad act was seen as being done to one by another person, but would be felt as guilt if understood to be one’s own act.
For this reason, an individual would be in but one of a number of discrete affective states at any given moment. It was for that reason that from the outset American National Election Studies (ANES) measures of affective reactions to candidates presented survey participants with the question “have you ever felt” (then followed a list of the various discrete affects) because it was understood that the cognitive evaluations would result in people reporting that they felt this but not that discrete affect. And hence it made good sense to offer as the response option of yes or no. These approaches were largely asserted rather than tested. Hence, the response options presented to study participants, a thermometer scale so that people could indicate how much they liked or disliked the object in question or the question whether thinking about a candidate had ever made them feel, say, angry, largely presumed the validity of the conception and presumed the validity of the measurement. The two conceptions, emotion as valence and emotion as derived from a cognitive appraisal, were challenged on both scores by research published in the early 1980s (Zajonc Reference Zajonc1980; Abelson et al. Reference Abelson, Kinder, Peters and Fiske1982).
What resulted in the 1980s was a two orthogonal dimensional view of emotion, a positive dimension and a negative dimension (i.e., that people commonly had both a positive affective reaction and a negative reaction). Attention to measurement was largely executed by psychologist David Watson who developed the Positive Affect and Negative Affect Scale measure (Watson Reference Watson1988b; Watson, Clark and Tellegen Reference Watson and Clark1988). In that work Watson explored a number of measurement features, among them assessing different affect terms best suited to measure the positive and the negative dimensions, whether different time frames impacted the responses given by study participants, and different response format. But in that work the variations in response options considered focused on comparing a four-option frequency format (how often an affect was experienced) and a five-option extent (how much of that emotion was experience) variants. No consideration was given to response options that offered an expressly continuous response format.
In sum, over the past 60 years affect moved from a debate as to whether affect could be understood as valence or as 8–12 mutually exclusive discrete emotional states to a view of emotion as a twofold dimensional space, most often understood as a circumplex (Plutchik and Conte Reference Plutchik and Conte1997). More recently, two separate research programs have converged in identifying the same three dimensions of emotional response as minimally necessary to identify the “affective space”: a positive dimension, enthusiasm; and two negative dimensions, anxiety and anger.Footnote 2 Roger Masters, with various colleagues, found these three characteristic emotional displays expressed by political leaders both American and non-American (McHugo et al. Reference McHugo, Lanzetta, Sullivan, Masters and Englis1985; Sullivan and Masters Reference Sullivan and Masters1988; Masters and Sullivan Reference Masters and Sullivan1989; Masters and Sullivan Reference Masters and Sullivan1993; Way and Masters Reference Way and Masters1996; Masters Reference Masters2001). Marcus et al., as well as research conducted by others, find the same three dimensions of affective response to a wide array of political stimuli (Redlawsk Reference Redlawsk2002; Brader Reference Brader2006; Marcus et al. Reference Marcus and MacKuen2006; Valentino et al. Reference Valentino, Hutchings, Banks and Davis2008; MacKuen et al. Reference MacKuen, Miller, Marcus and Neuman2010; Valentino et al. Reference Valentino, Brader, Groenendyk, Gregorowicz and Hutchings2011; Gadarian and Albertson Reference Gadarian and Albertson2014). Additionally, the research of psychologist Jennifer Lerner also identifies two negative affective, of aversion and of anxiety(Lerner and Keltner Reference Lerner, Gonzalez, Small and Fischhoff2000; Lerner and Keltner Reference Lerner and Keltner2001; Lerner et al. Reference Lerner and Keltner2003). Finally, Neuman et al. examined the emotional reactions of a national sample of adults to a wide array of news stories, some 50 in all, covering diverse topics such as celebrity news, economic stories, crime, foreign affairs, among others, find that those who read the stories report varying levels of anxiety, aversion, and enthusiasm (Neuman, Marcus and MacKuen Reference Neuman, Marcus and MacKuen2013). For example, they report that a story on the USAir airplane landing in the Hudson river measured very high on enthusiasm but very low on aversion, while a story on the recent Times Square attempted bombing elicited very high levels of both anxiety and aversion. Thus, it is a bit of a simplification to claim that this, or that, media message, elicits “more emotion” than another. In sum, though not all to the same degree, it appears that people respond to political and non-political events with varying levels of enthusiasm, varying levels of anxiety, and varying levels of aversion/anger. But reliance on radio button format collapses the range to four or five response options truncating what is now generally understood to be a continuous distribution. To that end we developed the slider format so that the response option is consistent with the theoretical formulation and is able to generate continuous distribution of three affect dimensions: enthusiasm, aversion, and anxiety.
Construct Validity and Testable Theoretical Claims
The construct validity of a new measure is traditionally assessed by testing relationships between that measure and dependent variables. For this study we made use of three such dependent variables taken from the affective intelligence literature. Of particular importance in this literature is when do people express interest in gathering more information, and which of two approaches to judgment they adopt as they confront a political matter: reliance on established disposition, such as partisan and ideological convictions; or a more open-minded thoughtful consideration of the matter. The distinction between the fast “automatic” reliance on established heuristics and shifting to a slower more thoughtful approach to judgment has come to be identified in psychology as the dual process model of judgment (Chaiken and Trope Reference Chaiken and Trope1999; Haidt Reference Haidt2001; Kahneman Reference Kahneman2011).
The affective intelligence theory, an example of a political science dual process model, advances theoretical claims that we can use to test the validity of measuring affective response. The theory holds that increases in anxiety identify novelty and initiates interest in learning, i.e., acquiring contemporaneously available information pertinent to the issue at hand (Marcus and MacKuen Reference Marcus, MacKuen, Wolak and Keele1993). Hence, anxiety is expected to be related to interest in novel information. The theory also identifies heightened anxiety as leading to thoughtful consideration informed by taking into account contemporaneously acquired information on the relevant options. Hence greater anxiety is expected to be related to deliberative style orientation. Finally, the theory holds that heightened aversion leads to people strengthening their attachment to their extant political habits such as partisan and ideological cues (Marcus, Neuman and MacKuen Reference Marcus, Neuman and MacKuen2000; Marcus Reference Marcus2002), hence heightened aversion is expected to strengthen reliance on the extant convictions judgment style.
In addition, we wish to assess how successful each method is in obtaining relatively pure “state” measures of affect. Various traits have been shown to predict affective reactions. For example, Jost et al. have argued that ideological identification is a stable difference that inclines some to be more, or less, likely to express fear or disgust (Jost, Glaser and Sulloway Reference Jost, Glaser, Kruglanski and Sulloway2003). Similarly, many, if not all, of the primary personality traits are thought to be expressed as affective disposition, for example, to display fear (Zuckerman Reference Zuckerman1991). Another array of research findings suggest that liberals are more engaged by novelty, with conservatives being more engaged by a need for certainty (Amodio et al. Reference Amodio, Jost, Master and Yee2007; Jost and Amodio Reference Jost and Amodio2012). Including a measure of ideological identification enables us to test whether conservatives are more inclined to endorse partisan orientation, while, on the other hand, liberals are expected to be more inclined to endorse a more thoughtful orientation. To enable us to assess whether the affect methods are measuring proximal reactions to the presented stimuli, rather than just expressing stable dispositions, we included an array of trait measures that can be used to assess to what extent either method is able to isolate and measure state affect. To that end we include measures of the Big Five personality traits, Need for Cognition, as well as two political traits, Partisan Identification and Ideological Identification.Footnote 3 We use these same added factors for each of the construct validity tests with three dependent variables, Interest in Novel Information, Self-Confident Resolve (SCR), and Social Open Mindedness (SOM).
In sum, we have three theoretical claims to test. First, we expect that measures of anxiety should be significantly correlated with the interest in novel information. Second, we expect that anxiety should be significantly correlated with a more deliberative style of judgment (as the perception of novelty, marked by higher anxiety, is expected to lead to an openness to consider a wider array of alternatives). And, third, we expect that higher levels of aversion should be significantly correlated with a more partisan style of decision-making (as the perception of familiar foes, marked by higher aversion, is expected to strengthen reliance on extant habituated courses of action). And, by incorporating measures of traits also known to be linked to these three dependent variables, multivariate testing enables us to “control” for these added factors thereby isolating our test of the comparative abilities of two “state” measures of affective response.
We next turn to the development of stories, the stimuli that are intended to elicit affective response, the specific items that make up the measures for each target affect, as well as the other elements in the design of the survey.
Method
Affective Stimulus Materials
As noted above, had we executed this study in the 1950s we might have chosen but a single question to determine how people emotionally reacted to some political stimuli. At that time “feeling thermometers” were developed so that people could signal how much they liked or disliked some designated target (e.g., political party, leader, policy position, social group, etc.). However, while efficient, feeling thermometers constrain people to reporting their affective experience as a single valence, i.e., liking or disliking. Had we executed this study some 30 years later, in the 1980s, we would have likely chosen stories to ensure that we could be sure we elicit each of two anticipated orthogonal affective dimensions, one positive and one negative, reflecting the latest research that found that people experienced concurrent positive and negative affective reactions (Abelson et al. Reference Abelson, Kinder, Peters and Fiske1982; Watson and Tellegen Reference Watson and Clark1985; Mayer and Gaschke Reference Mayer and Gaschke1988; Watson, Clark and Tellegen Reference Watson and Clark1988).Footnote 4 However, as noted above, current research in the study of affective responses find three largely independent dimensions.Footnote 5 To ensure that we can elicit sufficient affective responses to each of these affective dimensions we developed three stories, each intended to ensure heightened, respectively, anxiety, aversion, and enthusiasm (though, of course, any political stimulus is likely to impact self-report on all three affective dimensions).
One story presented the possibility of unknown multiple sleeper cells of terrorists on American soil. It was designed to evoke anxiety. A second story described a successful border protection program marshaled by American security institutions. It was designed to evoke enthusiasm. The third story reviewed the life of Osama bin Laden and his often successful terror attacks against the United States. It was designed to evoke aversion (at the time of this study bin Laden was alive and at large). The three stories are included in Appendix A.
Having three stories and multiple indicators for each affect dimension enable us to assess the efficacy of the stories, to compare the two methods in their ability to elicit the targeted affect, and to assess whether each method identified the anticipated structural model of affect.
Administration
After reading one of the three news stories each participant was randomly assigned to either radio buttons or slider formats to report on their affective state. The former requires selecting one of the five labeled buttons. The latter presents a vertical scale on which participants find an “arrow” that they can move up or down to report how much or how less of an indicated affective reaction they are then experiencing. As numerous studies have demonstrated that participants experience multiple concurrent affective responses thus requiring that researchers use a battery of affect items to accurately differentiate emotional responses. Among many such demonstration we cite here research by Watson, Clark and Tellegen (Reference Watson and Clark1988), Watson (1988Reference Watsona), Marcus et al. (Reference Marcus and MacKuen2006), and Brader, Groenendyk and Valentino (Reference Brader, Groenendyk and Valentino2010).Footnote 6 A fuller description, with figures, is given below. After completing this battery participants continued on to complete batteries for the dependent variables and the other measures (see Appendix B for listing of the items).
Participants Sample
The data collection for this project was executed by Knowledge Networks (KN) under our direction.Footnote 7 The data obtained are intended to be representative of American adults collected online using KN standard methodology. KN fielded this survey to a national sample age 18+ of panel members who had personal computers and internet access at home. The combined sample size for the two methods was 289 participants.Footnote 8 Which of the two methods each participant used was determined by random assignment. The requirement of having a home personal computer with internet access was needed to support distribution and administration of this survey. KN reports a completion rate of 55 percent for the survey used in these analyses. This survey was in the field from September 28 to October 16, 2009. KN provides a weighting variable with each of their samples so that, when applied, the demographic composition, age, gender, income, and so on, of their samples mimic that of the adult population of the United States.
Measures
Choosing word “markers” to measure three dimensions of affective response
We use ten semantic emotional “markers” to assess these three dimensions of affect. For the latent concept Enthusiasm, the words enthusiastic, hopeful, and proud have proven reliable markers; for the latent concept Anxiety, the words used have been scared, worried, and afraid; and, for the latent concept Aversion, hateful, angry, bitter, and resentful have proven reliable (Marcus et al. Reference Marcus and MacKuen2006).
The most common survey method for determining the level of affective response is to provide an array of semantically labeled alternative responses. Typically, five alternatives are presented and the respondent selects a response by clicking on one of the radio buttons (or check boxes in computer or paper-based surveys). Figure 1 shows a screen shot of that method. The screen shot shows five of the ten affect words. A second screen displayed the remaining five items. Random rotation of the ten affect items was used throughout to ensure that presentation order did not introduce an unnecessary complication.

Fig. 1 Radio button/multiple choice format
Radio buttons are a familiar and widely used technique. The semantic label gives clarity to each of the available five response options. While this response format does not produce data that meet the standard of continuous measurement, this sort of ordinal data are generally acceptably treated as continuous for statistical analyses (Bollen and Barb Reference Bollen and Barb1981). Moreover, as is the case here, when multiple measures are available one can easily generate simple summated scales that mitigates concerns about ordinal measurement. Nonetheless, one of our goals is to obtain data that, at the level of individual items, is straightforwardly continuous.
The clarity of semantic labels, while generally an advantage, raises a concern that the time and cognitive effort involved in discriminating among the semantic labels may compromise the capacity of the respondent to capture and identify their emotional state accurately. This led us to explore alternative response formats.
With the slider method format participants are presented with a vertical bar along with an “arrow” that they can move up or down with the computer’s mouse to indicate how much (up) or less (down) of the specific affect they experience. Presenting participants with a physical distance on which participants can place a response builds on earlier work by Lodge (Lodge Reference Lodge and Tursky1979; Lodge and Tursky Reference Lodge and Tursky1981).
One design consideration was where to locate the arrow on the slider as a starting point. We previously experimented with the arrow at the midpoint or alternatively at the bottom of the continuum. Starting with an arrow at the midpoint raised the concern that it might encourage respondents to leave it there as “close enough” to their assessment of the dimension or as an easily selected non-response. Starting with an arrow at the bottom, on the other hand, might bias estimates downward. Using a bottom-point starting position significantly increased the number of instances where respondents left the arrow unmoved (Marcus, Neuman and MacKuen 2009Reference Marcus, Neuman and MacKuena; Marcus, Neuman and MacKuen Reference Marcus, Neuman and MacKuen2009b). In that work we found that the midpoint starting position does not seem to have been used as a convenient “no opinion” option. We found that while respondents might leave one or two of the ten arrows unmoved, they did move most of them. It appears that participants left the slider arrow at the midpoint because the midpoint was their chosen response (Marcus, Neuman and MacKuen 2009Reference Marcus, Neuman and MacKuena; Marcus, Neuman and MacKuen Reference Marcus, Neuman and MacKuen2009b). Had participants left the arrows unmoved so as to indicate no response then their response would add “noise” (error) and, to the extend they did, so would generate a weaker relationship with our dependent variables. We found, in preliminary studies, that using a midpoint position for the slider now generated the highest construct validity. Hence, we concluded that the midpoint starting position works best.
Figure 2 displays the screen image of the slider format variant. And, as with the radio button format five affect terms are presented on each of two pages, with the order of the ten items randomized to prevent any systematic order effects.

Fig. 2 Slider format with midpoint start position and polar labels
Dependent Variables
A scale of interest in novel information was generated by creating a simple summated scale from three items. The statements “My Googling these issues and events to find out more is” and “My looking for websites that present new and different views on these issues and events is” and “My looking for websites that might challenge my points of view on these issues and events is” were offered to which participants could then respond, for each, to the query “this statement is extremely true, very true, moderately true, slightly true, or not at all true.” The resulting scale had a high level of reliability (Cronbach’s α=0.86).
Judgment orientations were measured with batteries of items from which two simple summated scales were also built. From each battery we chose the best items, meaning those items that best defined the latent concept (Hayduk and Littvay Reference Hayduk and Littvay2012). From among those available we chose the two statements for each orientation style. For SCR orientation: “These issues and events provide no room for compromise” and “I am certain that my point of view on these issues and events is the right one. It’s time to move on” were used. For the SCR orientation the two items are correlated at r=0.33. For SOM orientation: “These sorts of issues and events should be resolved so that everybody’s needs are met” and “To solve these sorts of issues and events everyone’s concerns should be heard” were used. These items are correlated at r=0.53. It is important to note that these orientation style items depict two separate styles, the styles are orthogonal to each other (the largest correlation between the four correlations between each array is that between “my point of view …. right one” and “should be heard” at r=−0.10). These orientations are not polar opposites (Marcus Reference Marcus2008; MacKuen et al. Reference MacKuen, Miller, Marcus and Neuman2010). The availability of two styles resonate with the current scholarly and popular debate in the United States concerning polarization, rhetorical styles, and civility (Ansolabehere and Iyengar Reference Ansolabehere and Iyengar1995; Mutz and Reeves Reference Mutz and Reeves2005; Fiorina and Abrams Reference Fiorina and Abrams2008).
In sum, participants in this study begin by reading one of three stories: which story they were given was determined by random assignment. Thereafter they reported on their affective responses to the story just read either, again by random assignment, reliance on the radio button or slider method for self-report. After completing this battery of ten items participants then completed the remaining questions, the interest in novel information battery, the two orientation batteries, the need for cognition battery, the Big Five personality trait battery, partisan and ideological identification, and answered an array of demographic queries. Finally, to facilitate comparison of all measures and all results, each measure, whether an individual response or a scale, was rescaled to a common 0–1 range. This preserves the underlying variance of each measure and scale. Using standardized coefficients, as in ordinary least squares, offers an alternative way of enhancing comparison but at the cost of altering the variance of each measure or scale.
Results
In this section, we begin by examining the administrative costs of using each of the two affect responses methods. Thereafter, we examine the ability of each method to reproduce the expected measurement model of three affect dimensions. Thereafter, we turn to reliability and validity concerns.
Assessing Administrative Costs: Radio Buttons Versus Sliders
Two considerations are relevant to assessing the costs and benefits of alternative measurement strategies: time to complete and missing data. The slider format, as we have described its application in this study, precludes missing data, hence for each of the 154 participants, all recorded responses to the ten affect items are treated as valid.Footnote 9 The radio button does enable participants to skip those items they wish to avoid. For the radio button method, with 135 participants, missing values ranged from a low of four for the affect item “hopeful” to a high of ten for the affect item “hateful” with the other eight items intermediate (see Table 1).
Table 1 Means and Missing Data for Ten Affect Items by Method

Source: Knowledge Networks Survey 2009.
The time to complete does appear to convey an advantage to the slider method. The radio button array of ten items took an average of 103 seconds to complete. The slider array took 85 seconds though the difference is not statistically significant (t-test=0.91, p=0.18). This result is at variance with that found by Couper et al. (Reference Couper, Tourangeau, Conrad and Singer2006). They found that their horizontal slider format took longer to complete than the radio button format, however, that may be due to their visual analog design, which differed from ours both as to its orientation (horizontal rather than vertical) and the density of semantic material used to label their version as compared with the more minimal approach we took.
Table 1 presents the means for the ten affect items as well as showing the missing data for each item. As is evident in comparison of the means, the radio button format generates lower means than does the slider format (a result that analysis of variance, reported below, confirms is significant and not a result of random measurement error). We explore the distribution of responses, by method, in Figure 3. We here examine whether either measurement method is particularly prone to truncation, which is generating responses that “pile up” at either the higher or lower ends of the distributions (i.e., either ceiling or floor effects). Figure 3 shows box plots for the ten affect terms, grouped by the three enthusiasm items (hopeful, proud, enthusiastic), the four aversion items (angry, hateful, bitter, resentful), and anxiety (afraid, scared, worried) with the radio button box plots above and the slider format box plots below. Although we rescale the raw data to a common 0–1 range below, here we show the raw data with the original ranges.Footnote 10 The box plots shown in Figure 3 show that the slider button format generated a more normal distribution and with clear tails both above and below the mean than did the radio button format. We will take up the question of how robust and significant that difference is when we turn to scales built from the ten affect items after we have considered whether these ten affect words successfully serve as measures of the intended latent concepts, Anxiety, Enthusiasm, and Aversion. We turn to that topic next.
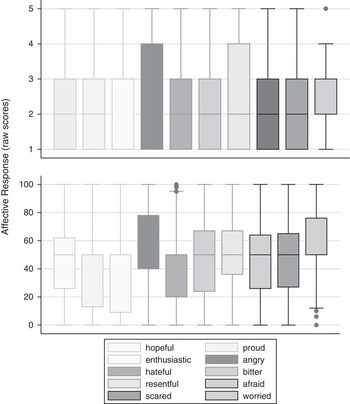
Fig. 3 Box plots of ten affect measures by method: radio button and slider format Source: Knowledge Networks Survey 2009.
The Dimensional Structure of Affective Responses
We use both exploratory and confirmatory factor analyses to examine the uni-dimensionality of each of three sets of affect words. The intention is to see if each mode of statistical analysis identifies three factors and that each of the selected affect terms specifically defines (i.e., “loads”) on the target latent concept. The exploratory factor analysis supports three affect dimensions with the expected affect “markers” loading on each of the three dimensions, anxiety, aversion, and enthusiasm, for both methods. For the radio button data, the first four eigenvalues reported are 4.82, 1.70, 0.36, and 0.04. For the slider data, the first four eigenvalues reported are 4.29, 2.05, 0.89, and 0.12.Footnote 11 Thus, using both the scree test and the eigenvalues >1.00 criteria, exploratory factor analyses lead to a three-factor solution.
A more compelling test of the expected measurement model is reliance on structural equation modeling (SEM). That is so because unlike exploratory factor analysis, SEM requires that the researcher identify two features of the model, one that defines the measurement theory (i.e., which items define each latent concept) and one that defines the substantive relationships that are expected to exist between the latent concepts (i.e., the substantive theoretical linkages). This is equivalent to also holding that each affect term measures only the latent concept to which it is linked (i.e., no cross-over linkages to other affect measures or to other affect concepts). The array of goodness of fit measures then enable examination of the relative success of each method in generating acceptable goodness of fit. And, there is one further benefit from adopting confirmatory factor analysis. The three chosen dependent variables are not expected to be orthogonal—indeed the anxiety and anger—aversion dimension are often found to be highly correlated (Lerner and Keltner Reference Lerner and Keltner2001; Lerner et al. Reference Lerner and Keltner2003). Confirmatory factor analysis enables us to differentiate the structural relationships between three affect concepts and the word markers used to identify each of the three affect concepts.Footnote 12 We obtain two SEM models, one for each method of measuring three dimensions.
Figure 4 shows the confirmatory factor results for each method with goodness of fit measures therein as well.

Fig. 4 Structural equation models of (a) radio button and (b) slider methods of affect measurement-standardized solutionSource: Knowledge Networks Survey 2009.
The SEM analysis shows the expected pattern with the affect terms hopeful, proud, and enthusiastic defining the Enthusiasm latent factor; angry, hateful, bitter, and resentful defining the Aversion latent factor; and afraid, scared, and worried defining the Anxiety latent factor. The fit criteria are acceptable for both measurement methods. Both models fit their respective data quite well. The SRMR (i.e., the standardized root mean square residual) value for the radio button method is 0.059, while that for the slider method is 0.60. In sum, the ten affect items, whether measured by the radio button method or by the slider method, generate the expected three factors with each of the ten affect items “loading” on the expected latent factors. These results are consistent with earlier research on these markers and their ability to define the three factors (Marcus et al. Reference Marcus and MacKuen2006). We thus conclude that responses to the ten affect items, whether obtained using the radio button or the slider method, can successfully identify the latent factors. We turn next to the reliability of the two sets of three scales derived from each array of ten affect items.
For assessment we used simple summated scales for each of the three dimensions of affective response, each coded to a common 0–1 range. Table 2 shows the reliabilities of the affect scales. We note also that the reliability values reported here are similar to those shown in Figure 4. Each method secures reliable scales. Though the reliabilities reported show the slider format marginally higher, only in the case of the scales for Enthusiasm are the difference significant (Feldt Reference Feldt1969; Feldt, Woodruff and Salih Reference Feldt, Woodruff and Salih1987). Notwithstanding that one difference, in all instances the reliabilities for each method are quite high.
Table 2 Cronbach’s α and Feldt Test for Radio Button and Slider Measures of Affect

Source: Knowledge Networks Survey 2009.
Before we turn to the dependent variables to test the construct validity of the two affect methods we turn to the question of whether the three stories elicited the targeted affective responses. To that end, we conducted analysis of variance for each of the three affect scales in a 3×2 design (three stories×two methods). In each case, the effect of the story treatment and the effect of the affect method used to present the response options (as we have seen in means of the individual items, Table 1) show the expected pattern. For anxiety, the effects of the story (F (2, 281)=21.44, p<0.0001) and method (F (1, 281)=19.67, p<0.0001) are substantial as well as significant. For enthusiasm, the effects of the story are also robust and significant (F (2, 281)=36.11, p<0.0001) as is method (F (1, 281)=21.57; p<0.0001). Finally, for aversion, we find the same pattern, with the effects of story (F (2, 278)=47.07, p<0.0001) and method (F (1, 278)=24.37, p<0.0001) being substantial as well as significant.Footnote 13
The impact of item format and story type can be seen in Figures 5–7. Both measurement formats demonstrate a clear ability to mark the differing affective responses to each of the three stories. The slider format, however, produces, on balance, a cleaner and more discriminating array of results than does the radio button format. For example, when measuring anxiety, the slider format reports 0.65 on the Hidden Cells story and 0.36 on the Safe Harbors story, a difference of 0.29, while for the radio button anxiety response to the same stories, 0.46 and 0.27, respectively, a difference of 0.19. More importantly, the two formats record the theoretically expected affective response for each of our three stories: the anxiety story produces anxiety, the enthusiasm story produces enthusiasm, and the aversion story produces aversion. And, though the two negative stories produce elevated levels of both negative affects, both measurement methods show that the story targeting uncertainty stimulates higher levels of anxiety than of aversion, while the story presenting a familiar foe produces higher levels of aversion than of anxiety. In sum, both approaches identify the distinctive affective responses that theory associates with each stimulus story.

Fig. 5 Levels of anxiety by story and by affect methodSource: Knowledge Networks Study, Fall 2009.

Fig. 6 Levels of enthusiasm by story and by affect methodSource: Knowledge Networks Study, Fall 2009.

Fig. 7 Levels of aversion by story and by affect methodSource: Knowledge Networks Study, Fall 2009.
A more decisive test examines the construct validity of each affect method. For that test we turn to the three dependent variables to assess the relative validity of the two measurement approaches.
Construct Validity of Affective Response Measures with Two Method Formats
We utilize three dependent variables: interest in searching for novel information, and the two judgment orientations identified by the dual model of judgment, the default reliance on extant convictions or the shift toward a more deliberative style of political decision-making. To compare formats, we regress each of these three dependent variables on the three affect measures. To exclude confounding factors we include an array of covariates known to be related to the dependent variables. This approach is intended to isolate the ability of each method to measure the state affective responses.
Table 3 displays the regressions of emotion on the first dependent variable, interest in novel information. As expected, anxiety is a robust and significant predictor of interest in obtaining novel information when the data are collected using the slider format. We do note that the equivalent coefficient for impact of anxiety, when anxiety is measured by the radio button format, is both substantively weaker and not statistically significant.Footnote 14 We next turn to the two measures of orientation toward controversy.
Table 3 Affect and Interest in Novel Information by Two Affect Methods

Source: Knowledge Networks Survey 2009.
Note: *p<0.05.
We turn next to the inclination to engage as defense of extant conviction, the SCR orientation. Here the expected relationship is between aversion and the inclination to remain committed to one’s convictions and to avoid the views of others who do not share one’s partisan views. And, as expected, increased aversion does have a significant positive impact on commitment to convictions in both analyses and both methods reporting near identical relationships between aversion and a partisan orientation (Table 4).
Table 4 Affect and Self-Confident Resolve (SCR) Orientation by Two Affect Methods

Source: Knowledge Networks Survey 2009.
Note: *p<0.05.
The anticipated relationship of affect and adopting a more deliberative orientation is that heightened anxiety is expected to be positively associated with activating the inclination to cooperate and that aversion is an inhibiting factor (i.e., a negative relationship). The results are displayed in Table 5. The direct effects of anxiety is consistent with the hypothesized expectation. Also shown in Table 5, the radio button method show a robust and significant negative relationship between aversion and inclination to adopt a deliberative orientation. This specific finding invites additional research for it suggests that aversion might interpose a contrary substantive resistance to engaging in thoughtful consideration.
Table 5 Affect and Social Open Mindedness (SOM) Orientation by Two Affect Methods

Source: Knowledge Networks Survey 2009.
Note: *p<0.05; #p<0.10.
Discussion
Our interest is in developing a methodology that is both capable of producing reliable and valid measurement of affective responses and that can also be used with a wide array of stimuli. We explored the new slider format with a variety of simulated online stories, but the method is applicable to any array of political stimuli. We contrasted the new slider response format with the traditional multiple choice radio buttons. The latter allows participants relying on semantic cues to identify and report their affective circumstances of the moment. While the former allows people to move an arrow up or down along a vertical slide to a location that best identifies their current feeling state for the specified affect. Our interest in developing the slider format grew from a concern that the additional cognitive effort of semantic processing associated with discriminating among the radio buttons may diffuse the capacity of the respondent to quickly capture and express their sense of emotional state. And, indeed, overall, the slider format proved to take less time to administer thus enabling people to generate a swifter response though the difference did not prove to be statistically significant. Of some added benefit, the slider format offers continuous data, and generated robust relationships with each of the three dependent variables.
Both formats generate the same structural pattern among the ten affect words, each fitting and finding the expected three dimensions, anxiety, enthusiasm, and aversion. Both arrays of data, one using the radio button format and the other using the slider format, report generally similar relationships between the expected affect dimensions with the two judgment orientation-dependent variables.
On the basis of those comparisons we conclude that the slider format represents an important and useful addition to the methodological array for securing measures of affective response and one that exhibits modestly superior psychometric properties. Nonetheless, some qualifications and interesting questions arise from our analysis.
We should not put aside some concerns that this study does not address. First, this analysis is based on one data set.Footnote 15 We have found that the slider format proved effective when used for a wide array of stories, having deployed this method in a study with some 50 brief news stories (Neuman, Marcus and MacKuen Reference Neuman, Marcus and MacKuen2013). And our more detailed work using Economics and Food Safety stories shows that the slider format consistently passes the construct validity test over a range of subjects (MacKuen et al. Reference MacKuen, Wolak, Keele and Marcus2013). Nonetheless, research using a wider array of stimuli types, perhaps using just images, or video, or stimuli not given in the convention of newspaper stories, would be helpful. Even as research makes use of more modern technologies, it is likely that research will move away from computers and to tablets. The slider method may be even more useful with tablet use of finger touch to provide participant input than the computer’s use of mouse to record input. Finally, the slider format may well prove a useful way of recording responses generally and not just to affective responses. Whether that proves to be the case of course will have to await additional research.
We remark here on two substantive issues worth further research. Two substantive findings warrant more research. First, the radio button measurement of affective response reported (see Table 3) that anxiety is unrelated to interest in novel information. This result seems to be at variance with a large array of reported research that does report a robust relationship between anxiety and interest in acquiring novel information.Footnote 16 Why this discrepancy between methods here occurs remains unresolved. Second, and of some importance, the results reported in Table 5 find that both methods agree that anxiety encourages people to adopt a deliberative stance to decision-making. However, the methods offer different conclusions about the role of aversion. The radio button method finds that heightened aversion acts to inhibit adopting this stance. On the other hand, the slider format data suggest that anxiety is the sole affective factor driving the inclination to deliberate. This difference merits further research to assess which conclusion is valid. In this time of heightened polarization with public anger being in plentiful supply, knowing whether heightened anxiety is by itself solely capable in turning people from steadfast defense of their extant beliefs or whether that shift requires both heightened anxiety and diminished anger has both theoretical and practical application.
Notwithstanding these suggested trajectories of future research, the two methods for collecting emotional self-report, these two methods, the conventional radio button and the new slider, work well. In the main, the two methods offer reliable and valid methods for obtaining data on how much, or how little, of three affective appraisals people experience.
Supplementary Material
To view supplementary material for this article, please visit http://dx.doi.org/10.1017/psrm.2015.65


