

Introduction
In the United States there are now more than 300 rangeland invasive plants that cost about $2 billion annually to treat (DiTomaso Reference DiTomaso2000). Many of these weeds poison animals, increase the cost of raising livestock, alter sensitive habitat, decrease land value, deplete resources, and reduce plant diversity (DiTomaso Reference DiTomaso2000; Eviner et al. Reference Eviner, Hoskinson and Hawkes2010). In California, historical ranching and agriculture, anthropogenic nitrogen deposition, and invasion have transformed much of the landscape from coastal sage scrub (CSS) to nonnative grassland (Bowler Reference Bowler2000), decreasing shrub cover by 90% (Westman Reference Westman1981). CSS is characterized by low-growing shrubs in coastal and inland California and northwest coastal Baja California. This habitat type is a hot spot of endemic species, 100 of which are proposed for or under protection (Rubinoff Reference Rubinoff2001). A number of rare and endangered species, such as the California gnatcatcher (Polioptila californica Brewster) (Rubinoff Reference Rubinoff2001) and Palos Verdes blue butterfly (Glaucopsyche lygdamus palosverdesensis E. Perkins & J. Emmel) rely on CSS for survival. The cover of an important host species for the endangered California gnatcatcher, coastal sagebrush (Artemisia californica Less.), has also decreased from 17.7% to 6.1% in the last 62 yr (D’Antonio and Vitousek 1992). Despite the importance of CSS and threats to it, research in this system has been sparse (Lowry et al. Reference Lowry, Rollinson, Laybourn, Scott, Aiello-Lammens and Gray2013). Due to the magnitude of invasion and shrinking of CSS, it is important to better understand the extent of ecosystem impacts caused by invasive plants, particularly invasive grasses.
Invasive grasses can alter water flow, soil quality, pH (Kourtev et al. Reference Kourtev, Ehrenfeld and Häggblom2003), carbon storage (Eviner et al. Reference Eviner, Hoskinson and Hawkes2010), inputs of nitrogen and other elements (Ehrenfeld Reference Ehrenfeld2003), and organic matter (Saggar et al. Reference Saggar, McIntosh, Hedley and Knicker1999) in soils. These effects, along with their increased competitive ability, allow invasive grasses to replace native species and dominate the landscape. However, the impacts of invasive plants on soil microbial communities and associated indirect impacts on native plant communities are less well understood.
Microbes interact with plant species as mutualists, pathogens, decomposers of organic matter, and critical facilitators of the carbon and nitrogen cycles (Ehrenfeld et al. Reference Ehrenfeld, Ravit and Elgersma2005). Alterations to the soil microbial community can be induced by variations in the C:N ratio of plant litter, which can cause dramatic shifts between fungal and bacterial dominant communities in the soil (Dickens et al. Reference Dickens, Allen, Santiago and Crowley2013). Invasive plants can also alter microbial communities through the production of root exudates (Bais et al. Reference Bais, Weir, Perry, Gilroy and Vivanco2006) or by directly introducing translocated microbes (Vellinga et al. Reference Vellinga, Wolfe and Pringle2009).
These changes in the microbial composition of the soil brought on by invasive plants can indirectly affect native plant growth (Bever et al. Reference Bever, Dickie, Facelli, Facelli, Klironomos and Moora2010; Cuddington Reference Cuddington2011; Dickens et al. Reference Dickens, Allen, Santiago and Crowley2013; Eviner et al. Reference Eviner, Hoskinson and Hawkes2010; Hawkes et al. Reference Hawkes, Belnap, D’Antonio and Firestone2006; Jordan et al. Reference Jordan, Larson and Huerd2008; Mangla and Callaway 2008), sometimes in negative ways (Mangla and Callaway 2008). Alteration of important nutrient cycles (Liao et al. Reference Liao, Peng, Luo, Zhou, Wu, Fang, Chen and Li2008), changing of soil food webs, or inhibition through introduction of plant pathogens (Belnap et al. Reference Belnap, Phillips, Sherrod and Moldenke2005; Jordan et al. Reference Jordan, Larson and Huerd2008) can cause native plant cover to decline. However, studies focused on understanding the indirect effects of invasive plant growth on native plants often have conflicting results, largely dependent upon the native and invasive species studied (Bozzolo and Lipson Reference Bozzolo and Lipson2013), the length of invasion, invader cover, and site specifics (Eviner et al. Reference Eviner, Hoskinson and Hawkes2010). For these reasons, it may be important to understand how key invasive grasses affect natives in context-dependent ways (Eviner et al. Reference Eviner, Hoskinson and Hawkes2010).
Invasive grasses can outcompete native plants in three different ways: the accumulation of local pathogens hypothesis, the enhanced mutualism hypothesis, and priority effects. The accumulation of local pathogens hypothesis states that invasive plants recruit local pathogens, resulting in exclusion of native plant species (Eppinga et al. Reference Eppinga, Rietkerk, Dekker and De Ruiter2006), while the enhanced mutualism hypothesis states that invasive plants thrive by forming stronger mutualisms in the invaded range (Reinhart and Callaway Reference Reinhart and Callaway2006). Priority effects occur when one species begins growing in a location before another species (Dickson et al. Reference Dickson, Hopwood and Wilsey2012), sometimes leading to alternative stable states (Suding et al. Reference Suding, Gross and Houseman2004). Evidence for priority effects occur in the findings of several studies that have shown invasive species regularly begin growth before native species (Wainwright et al. Reference Wainwright, Wolkovich and Cleland2012), colonize disturbances, and grow quickly in the absence of other individuals (Parendes and Jones Reference Parendes and Jones2000).
Thousands of hectares in private and public CSS lands are invaded by P. aquatica, a highly aggressive (Tran and Cavagnaro Reference Tran and Cavagnaro2010), perennial, mycorrhizal (Asghari and Cavagnaro Reference Asghari and Cavagnaro2011), deep-rooted bunchgrass from the Mediterranean (DiTomaso Reference DiTomaso2000). It forms large monocultures in both riparian and upland systems of the invaded range. In the United States, it is found most commonly in the coastal valleys, foothills, and along roadsides from Oregon to California, and grows best in high-fertility conditions (Harrington and Lanini, Reference Harrington and Lanini2000). It is a favored pasture grass, because it is drought tolerant, able to persist in a wide variety of soils, and does well under heavy grazing (Langer Reference Langer1990). Phalaris aquatica is known to outcompete and displace native plants, and land managers have struggled with establishing native plants in P. aquatica removal areas (S Bennett, personal communication, June 1, 2011). Despite the prevalence and invasiveness of P. aquatica in CSS, little is known about its impact on native CSS plants and on soil microbes and abiotic properties.
To better understand the long-term effects of invasive grasses on native plants and associated soils, we monitored the performance of native and invasive plants grown in soils previously invaded by P. aquatica (hereafter postinvasive soil), as compared with uninvaded soil, and characterized soil microbial communities in these two soil types. We hypothesized that (1) native plants would have a slower survival rate and smaller size in the postinvasive soil relative to the uninvaded soil; (2) the microbial community composition of the uninvaded soil would differ from the postinvasive soil, due to differences in plant community assemblage; and (3) changes in soils associated with P. aquatica would retain conditions inhibitory to native plant conditions: a legacy effect of invasion.
Management Implications
Microbial and plant communities are interdependent; therefore, reassembly of one component may be restricted by reestablishment of the other component. Thus, restoration success may be limited unless both the microbial and plant communities are restored. Previously, most suggestions for improved restorations have been context dependent, and invasive plant removal and site preparation methods largely consisted of burning, grazing, herbicide treatment, or manual weed pulling, without concern for the belowground communities. Furthermore, little emphasis was placed on the underlying mechanisms that may have led to invasion. Now we understand that legacy effects of invasive species can last for decades or centuries, sometimes impacting the growth of native plants. If these legacy effects are microbial, they will require novel restoration strategies to repair the damage done to native plant communities.
Most restoration strategies to ameliorate biotic legacy effects may include invasive removal, planting natives, soil amendments, removing topsoil, and microbial inoculation. However, these strategies have all produced inconsistent results, possibly because the restoration strategy was not tailored to the specific invasion. It may be important to first identify the legacy effects caused by a particular invasive plant before attempting restoration. In regard to this study, the changes in soil microbial composition brought on by Phalaris aquatica L. (Harding grass) indicate that it may be important to restore the soil to a microbial community composition resembling that of the uninvaded soil. This could be accomplished by simply inoculating the native plants with uninvaded soil before transplanting seedlings into the postinvasive site. Instead of just planting native species in a postinvasion site and hoping establishment will occur, an approach involving alterations to soil microbial composition could ensure native plant establishment and longevity. It may also be possible to use plants as nurse species, in this case, coyotebrush (Baccharis pilularis DC.) and San Luis purple sage (Salvia leucophylla Greene), because their survival and growth were unaffected by the postinvasive soil.
Materials and Methods
Greenhouse Experiment
To test our first hypothesis, we designed a greenhouse experiment in which we grew three native shrub species and P. aquatica in soils that had been conditioned in the field by native plants versus soils that had been conditioned in the field by the invasive grass. We collected soils from Rancho Sierra Vista (RSV), a park unit of the Santa Monica Mountains National Recreation Area. RSV is a lowland site in Southern California that was originally CSS, but has a long history of ranching and agriculture that have transformed much of the landscape to nonnative grassland. The soil series is Mipolomol consisting of loamy, mixed, superactive, thermic, shallow Entic Haploxerolls (USDA Web Soil Survey accessed June 29, 2018). The first recorded siting of P. aquatica in RSV occurred in November 2002 (Calflora 2014). Records of the site since the 1950s show that it was open, dry-field agriculture, with the P. aquatica being planted for livestock fodder in the 1970s before the Santa Monica Mountains National Recreation Area was established in 1978. The invasive grass spread quickly, and control efforts did not begin until the late 1990s through early 2000. Phalaris aquatica rapidly expanded to approximately 10 ha in RSV (34.09° N 118.57° W), forming a complete monoculture. The invasive grass was fully established in the 10-ha site, reaching ~1.1 m in height, displacing a mix of fully established native plants and invasive grasses that had previously grown there. Removal of P. aquatica by park managers began in 2006, using a combination of mowing and herbicide application (glyphosate). By 2013, the P. aquatica infestation was reduced to routine maintenance levels and eradicated in several areas. Although this posttreatment area of P. aquatica was surrounded by intact CSS to provide ample propagules, native plant recruitment was virtually nonexistent several years later. Park managers were concerned that traditional restoration strategies, in which the native plant seedlings were outplanted in large numbers, might prove ineffective in restoring the native plant population if there were underlying unfavorable soil conditions.
The greenhouse experiment was arranged as a full factorial design using the native shrubs coastal sagebrush (Artemisia californica Less.), San Luis purple sage (Salvia leucophylla Greene), and coyotebrush (Baccharis pilularis DC.) and the invasive grass P. aquatica, with the soil source being either uninvaded or postinvasive. All four species are mycorrhizal and nonleguminous. The native species were chosen because they are dominant species in CSS that continue to grow in the uninvaded soils surrounding the postinvasive site. In October 2013, for each of the two treatments (uninvaded or postinvasive) 1,000 seeds of each species were divided among 10 pots per species for a total of 40 pots per treatment. We filled 40 pots with uninvaded soil and the other 40 with postinvasive soil. We placed trays containing the plant pots in random locations throughout the ~14-m2 bench space. We made sure that the treatments were separated by at least 1 m to prevent cross-contamination during watering.
Uninvaded soil was defined as soil in which intact CSS had historically grown uninterrupted, while postinvasive soil was defined as soil in which P. aquatica had grown for 11 yr (2002 to 2013) or more. The postinvasive soil was collected at ~10 randomly selected locations across the 10-ha postinvasive site at RSV and homogenized. Uninvaded soil was collected directly around the 10-ha postinvasive site where the native plants used in this study were prevalent. Approximately 19 L of soil from each site was collected from the top 15 cm of soil with sterilized shovels. Uninvaded soils were collected approximately 1 m away from intact native plants, while postinvasive soils were collected at least 10 m away from any vegetation.
Immediately after seeding, the pots were watered three times a week to field capacity with regular tap water and stored in an open lath house structure under uniform light exposure at the park’s nursery at RSV. The lath house is a large wooden construction on the National Park Service grounds in RSV, which allows for ambient temperatures and natural lighting. The plants grew in the greenhouse for 7 mo before destructive sampling at the conclusion of this experiment.
We harvested plants on May 24, 2014. All plants from each pot were harvested, for a total of 461 plants and an average number of ~6 plants per pot. At harvest, the entire plant was carefully and slowly excavated from the soil with soil knives and repurposed smooth wooden sticks to ensure minimal root loss, after which the shoot was separated from the root with shears. The length data were recorded, then the shoots and roots were dried, cleaned, coiled, and stored at room temperature in the laboratory at University of California, Riverside (UCR). The survival rates, number of individuals, and dried seedling biomass were recorded. Seedling survival rate at harvest was calculated as (no. of seedlings per pot per 100 seeds). We recorded the length and biomass of the dried root and shoot separately for all plants.
Field Sampling for Nitrogen and Microbial Composition
To test our second hypothesis, to determine whether P. aquatica may have altered the soil microbial community, soil cores were collected in and around the 10-ha postinvasive site. Uninvaded soils were collected directly under the drip lines of native plants, while postinvasive soils were collected at least 10 m away from any vegetation in the 10-ha postinvasive site. Soil samples were taken as 5-cm-deep soil cores with a sterile corer. The site was split into three blocks, as was the surrounding intact sage scrub (Figure 1). A total of 60 soil cores were collected over 3 mo (Table 1). On February 10, 2014, and April 15, 2014, about a year after the plants were harvested in the greenhouse, a total of 20 soil cores per month were collected, with 10 soil cores collected in the uninvaded blocks and 10 soil cores collected in the postinvasive blocks. For postinvasive soil, three cores were collected in Block 1, three were collected in Block 2, and four were collected in Block 3 (an extra sample was collected from Block 3 in case of error) for a total of 10 cores. For uninvaded soil, three cores were collected in Block 4, three in Block 5, and four in Block 6 (Figure 1). Soil cores were classified as either “uninvaded” or “postinvasive” soil samples. The samples were placed directly on dry ice in the field and stored at −20 C at UCR until analysis.
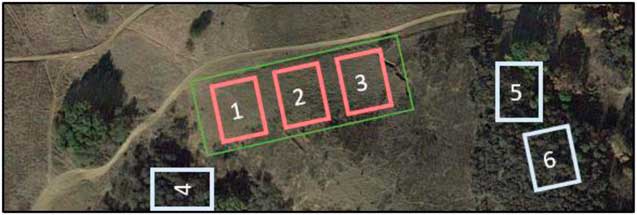
Figure 1 Aerial view of the 10-ha site from which Phalaris aquatica was removed (green rectangle). The three red sites represent blocks from which postinvasive soil was collected, while the three white sites represent blocks from which the uninvaded soil was collected. Sampling locations were randomly chosen within blocks.
Table 1 Source and number of soil cores collected during February, April, and July 2014.

Soil cores for nitrogen (N), carbon (C), moisture, and pH analysis were collected on July 23, 2014. A total of 20 soil cores were collected, with 10 soil cores collected in the uninvaded blocks and 10 soil cores collected in the postinvasive blocks. For postinvasive soil, three cores were collected in Block 1, three were collected in Block 2, and four were collected in Block 3 (an extra sample was collected from Block 3 in case of error) for a total of 10 cores. For uninvaded soil, three cores were collected in Block 4, three in Block 5, and four in Block 6. They were placed on dry ice in the field and transported to UCR.
Soil Assays
KCl extractions for nitrate and ammonium were performed on the same day as soil collection. Ammonium analysis followed Weatherburn (Reference Weatherburn1967), and nitrate analysis followed Doane and Horwath (Reference Doane and Horwath2003). Extraction was followed by spectrophotometric readings. Two technical replicates were run for each sample.
Five uninvaded soil samples and five postinvasive soil samples collected in July were dried and then run on a FLASH 2000 elemental analyzer (Genecraft Labs, Jakarta, Indonesia) to determine the total C and N concentration. Soil moisture was determined by weighing out about 8 g of the same 10 samples in tins and recording the weight before and after drying at 60 C for 48 h. A pH meter (Thermo Fisher Scientific, Wilmington, DE, USA) was used to take the pH of the same 10 samples.
DNA Extraction, Quantification, and Bar-coded Amplicon Sequencing of 16S
The 16S ribosomal RNA gene (16S rRNA) V3 and V4 regions were analyzed to classify the diversity of bacteria in the soil. Microbial DNA was extracted using a MO BIO PowerSoil DNA Isolation kit (MO BIO Laboratories, Carlsbad, CA, USA) following the manufacturer’s instructions and using a PowerLyzer 24 benchtop bead-based homogenizer (Mo Bio Laboratories). A NanoDrop 2000/2000c UV-Vis spectrophotometer (Thermo Fisher Scientific) was used to quantify the DNA in soil extracts. PCR for bacteria and archaea was performed using primers that target the 16S V3 and V4 regions (S-D-Bact-0341-b-S-17 and S-D-Bact-0785-a-A-21; Klindworth et al. Reference Klindworth, Pruesse, Schweer, Peplies, Quast, Horn and Glöckner2012) of the 16S rRNA gene. Microbial genomic DNA (2.5 μl) was combined with forward and reverse primer (5 μl each) and 2× KAPA HiFi HotStart ReadyMix (KAPA Biosystems, Wilmington, MA, USA) (12.5 μl). A Bio-Rad MJ Research PTC 200 Thermocycler was used to amplify 96 samples at a time with the following program: 95 C for 3 min, 25 cycles of 95 C for 30 s, 55 C for 30 s, 72 C for 5 min, and hold at 4 C. AMPure XP beads (Beckman Coulter Genomics, Danvers, MA, USA) were used to purify the 16S amplicon without primer and primer dimer sequences. Dual indices and Illumina sequencing adapters were attached to the amplicon using the Nextera XT Index Kit (Illumina, San Diego, CA, USA). Amplicon DNA (5 μl) was combined with 2× KAPA HiFi HotStart ReadyMix (25 μl), Index 1 and 2 primers (5 μl each), and PCR-grade water (10 μl). The same thermocycler was used with the following program: 95 C for 3 min, eight cycles of 95 C for 30 s, 55 C for 30 s, 72 C for 30 s, 72 C for 5 min, and hold at 4 C. A second bead cleanup was used to purify the final library before quantification. The samples were verified with gel electrophoresis after every step. The samples were quantified in duplicate using the Quant-iT PicoGreen dsDNA assay kit (Life Technologies, Grand Island, NY, USA). All samples were pooled together in equimolar concentrations and then sequenced with an Illumina MiSeq instrument at UCR.
DNA Extraction, Quantification, and Bar-coded Amplicon Sequencing of Arbuscular Mycorrhizal Fungi
The SSU rRNA gene was analyzed to classify the diversity of mycorrhizae in the soil. Microbial DNA was extracted using a MO BIO PowerSoil DNA Isolation kit (MO BIO Laboratories) following the manufacturer’s instructions and using a PowerLyzer 24 benchtop bead-based homogenizer (MO BIO Laboratories). A NanoDrop 2000/2000c UV-Vis spectrophotometer (Thermo Fisher Scientific) was used to quantify the DNA in soil extracts. PCR for fungi was performed using the primer pairs WANDA-AML2. Microbial genomic DNA (1 μl) was combined with forward and reverse primer (5 μl each) and Phusion DNA Polymerase (Thermo Fisher Scientific) (12.5 μl). A Bio-Rad MJ Research PTC 200 Thermocycler was used to amplify 96 samples at a time with the following program: 95 C for 2 min, 40 cycles of 95 C for 30 s, 60 C for 1 min, 68 C for 1 min, and hold at 10 C. AMPure XP beads (Beckman Coulter Genomics) were used to purify the extracts and amplicon. Dual indices and Illumina sequencing adapters were attached to the amplicon. Diluted (1:10) amplicon DNA (1 μl) was combined with Phusion (12.5 μl), Index 1 and 2 primers (2.5 μl each), bovine serum albumin (0.1 μl), and PCR-grade water (6.4 μl). The same thermocycler was used with the following program: 95 C for 2 min, 15 cycles of 95 C for 10 s, 55 C for 30 s, 72 C for 30 s, and hold at 10 C. A second bead cleanup was used to purify the final library before quantification. The samples were verified with gel electrophoresis after every step. The samples were quantified in duplicate using a Qubit 2.0 Fluorometer (Thermo Fisher Scientific). All samples were pooled together in equimolar concentrations and then sequenced with an Illumina MiSeq instrument.
Data Analysis
To analyze the plant length and biomass data, we used JMP13 statistical software (JMP v. 13, SAS Institute, Cary, NC, USA) to perform a one-way ANOVA with the factor: soil type (uninvaded or postinvasive) separated by species (A. californica, B. pilularis, S. leucophylla, and P. aquatica). Plant root and shoot lengths and root and shoot biomass are not reported in separate figures because they show the same trend as the mean length and biomass graphs.
Quantitative Insights into Microbial Ecology (QIIME; Kuczynski et al. Reference Kuczynski, Stombaugh, Walters, González, Caporaso and Knight2012) was used to quality filter the 16S sequences and determine taxonomic identity against the Greengenes reference databases using 97% similarity. Analysis of similarity was performed in QIIME using a Unifrac index to statistically compare community similarity among treatments. We performed alpha-diversity analyses and generated principal coordinate analysis plots using QIIME. Beta-diversity analyses were performed using MicrobiomeAnalyst (http://www.microbiomeanalyst.ca/faces/home.xhtml; Dhariwal et al. Reference Dhariwal, Chong, Habib, King, Agellon and Xia2017). To analyze the abundance of certain taxa in the soil samples, we used JMP13 to perform a two-way ANOVA with the factors soil type (uninvaded or postinvasive), month (April or February), and soil*month at the phylum, class, order, family, and genus levels. We used the ‘vegan’ (Oksanen et al. Reference Oksanen, Blanchet, Friendly, Kindt, Legendre, McGlinn, Minchin, O’Hara, Simpson, Solymos, Stevens, Szoecs and Wagner2018) and ‘ggpubr’ (Kassambara Reference Kassambara2018) packages in R to perform a permutational multivariate analysis of variance and generate figures, respectively.
For SSU, we used smalt (http://www.sanger.ac.uk/science/tools/smalt-0) to remove PhiX contamination and cutadapt (Martin Reference Martin2011) to filter sequences. We used the forward read and checked quality with FastQC (Andrews Reference Andrews2010). Demultiplexing was performed in QIIME v. 1.9.1, and taxonomy was assigned using BLAST against the MaarjAM database (Öpik et al. Reference Öpik, Vanatoa, Vanatoa, Moora, Davison, Kalwij, Reier and Zobel2010). We assigned families of Glomeromycotina to arbuscular mycorrhizal fungi (AMF) functional groups: rhizophilic, edaphophilic, and ancestral using AMF resource allocation. The guild approach of classifying AMF is outlined in Weber et al. (Reference Weber, Diez, Andrews, Goulden, Aronson and Allen2018) and organizes AMF by biomass allocation: edaphophilic AMF have high allocation to extraradical hyphae, rhizophilic AMF have high allocation to root colonization, and ancestral AMF have lower allocation to root colonization and soil hyphae than the other two groups (Table 2). The rhizophilic guild may protect plant roots from pathogens (Sikes et al. Reference Sikes, Powell and Rillig2010; Treseder et al. Reference Treseder, Allen, Egerton-Warburton, Hart, Klironomos, Maherali and Tedersoo2018), while the edaphophilic guild improves plant nutrient uptake.
Table 2 Arbuscular mycorrhizal fungal hyphal functional scheme as described in Weber et al. (Reference Weber, Diez, Andrews, Goulden, Aronson and Allen2018).
a References: 1. Powell et al. (Reference Powell, Parrent, Hart, Klironomos, Rillig and Maherali2009); 2. Hart and Reader (2002); 3. Varela-Cervero et al. (Reference Varela-Cervero, Vasar, Davison, Barea, Öpik and Azcón-Aguilar2015); 4. Varela-Cervero et al. (Reference Varela-Cervero, López-García and Barea2016a); 5. Varela-Cervero et al. (Reference Varela-Cervero, López-García, Barea and Azcón-Aguilar2016b).
Results and Discussion
We found significant differences in plant growth and the composition of microbial taxa between uninvaded soils and soils from which invasive P. aquatica had been removed after thriving for many years. These changes in soils associated with P. aquatica are a legacy effect of invasion.
Soil Chemical Properties
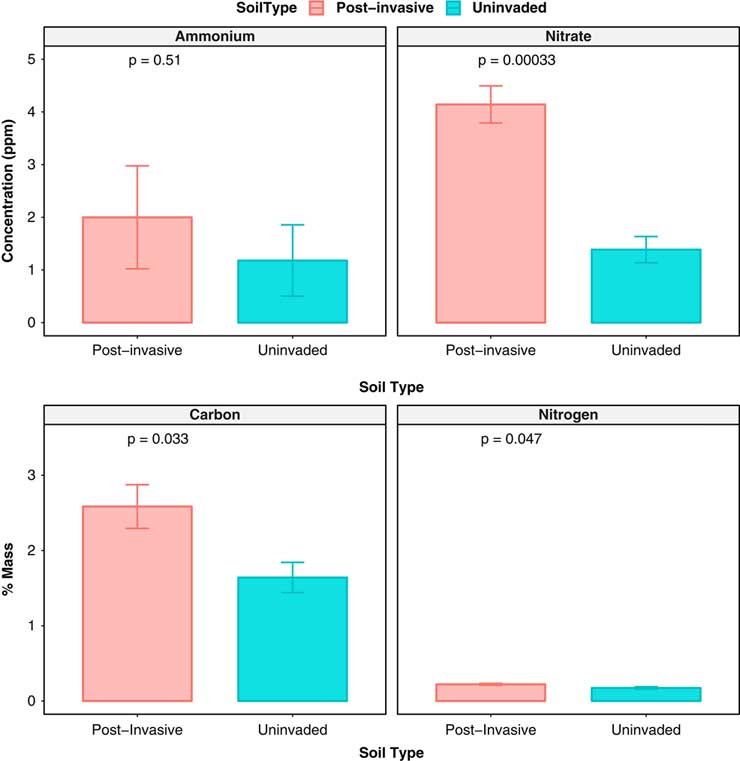
The amount of nitrate was higher in postinvasive soil (P<0.001), while ammonium did not differ between soil types. The uninvaded soil had an average of 1.64% C and 0.17% N, while postinvasive soil had an average of 2.58% C and 0.22% N. The total N and total C concentration was significantly higher (P<0.05) in the postinvasive soil, while the C:N ratio did not differ between the two soil types (P > 0.05) (Figure 2). Both soil types had similar levels of moisture (P > 0.05) and pH (P > 0.05).
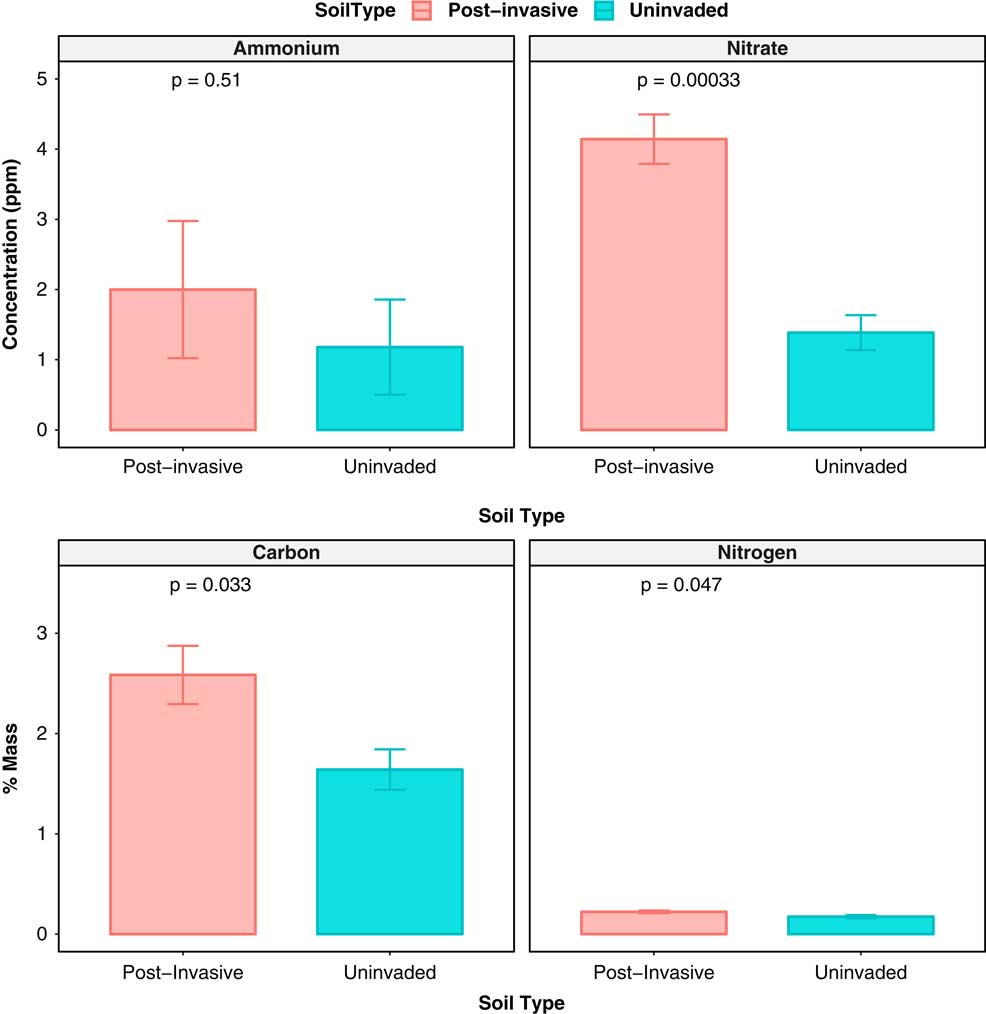
Figure 2 The ammonium concentration (ppm), nitrate concentration (ppm), total C (% mass), and total N (% mass) of postinvasive (red) and uninvaded (blue) soil in July 2014. SEs are represented in the figure by the error bars attached to each column.
The higher amount of total C may be a result of P. aquatica roots left in the soil after invasive plant die-off. These large root networks are decomposed by soil microbes over time, releasing C into the soil.
Bacterial Composition
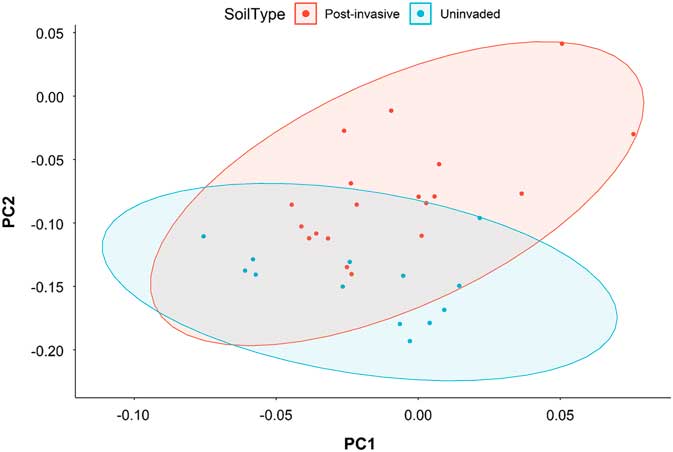
The total bacterial composition (Figure 3) and richness, as measured with alpha-diversity metrics, of the uninvaded and postinvasive soils did not differ (P > 0.05). We did, however, find differences in relative abundance at various taxonomic levels between the soils.

Figure 3 Principal coordinates analysis based on the weighted Unifrac distance metric for all bacterial taxa. Ellipses represent SDs of the weighted average of treatments at the 95% confidence level.
Seven phyla dominated all samples, with Acidobacteria, Actinobacteria, Bacteroidetes, Chloroflexi, Planctomycetes, Proteobacteria, and Verrucomicrobia accounting for ~94% (range of 89% to 96%) of sequences in each sample. Thirty-three additional phyla were present but not dominant in both soils types, and of those nondominant phyla, 21 were present but not consistent across all soils. There were significant differences in the relative abundance of certain taxa between uninvaded and postinvasive soil: in postinvasive soil, there were relatively more Bacteroidetes (P<0.0001) and Proteobacteria (P<0.001) than in uninvaded soil, and a lower amount of Planctomycetes (P<0.05) and Acidobacteria (P<0.01) (Figure 4).
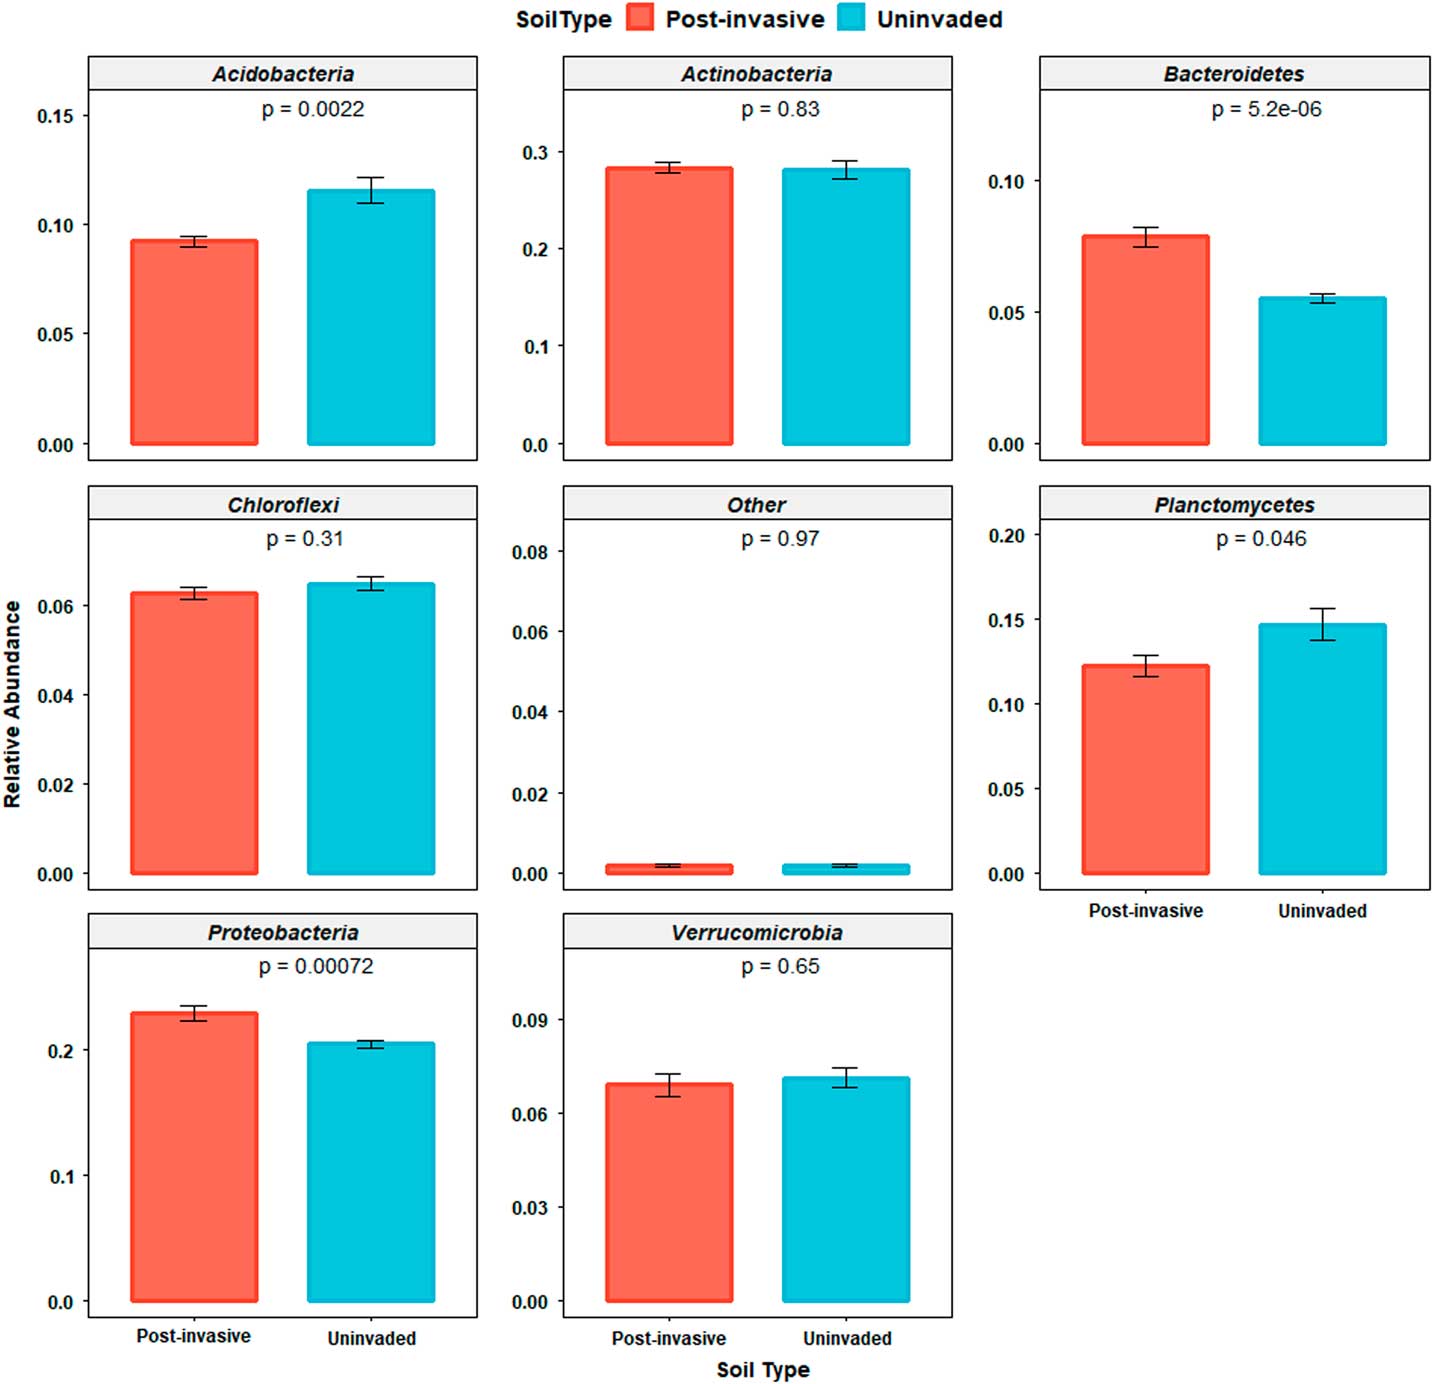
Figure 4 Relative abundances of the dominant bacterial phyla (Acidobacteria, Actinobacteria, Bacteroidetes, Chloroflexi, Planctomycetes, Proteobacteria, and Verrucomicrobia) within and across soil types. “Other” indicates the combined relative sequence abundance of the additional, rare phyla.
A total of 149 orders were present in all soils, with just 12 orders together accounting for more than half of the observed sequences in each sample: Actinomycetales, Burkholderiales, Chthoniobacterales, Gaiellales, Gemmatales, Rhizobiales, Rhodospirillales, Rubrobacterales, Saprospirales, Solibacterales, Solirubrobacterales, and Sphingomonadales accounted for ~52% (range of 46% to 58%) of sequences in each sample. Of these, Actinomycetales (Actinobacteria), Rhizobiales (Proteobacteria), and Rubrobacterales (Actinobacteria) were most abundant and accounted for ~21% of sequences in each sample. The relative abundance of certain orders differed between uninvaded and postinvasive soil: in postinvasive soil there were more Actinomycetales (P<0.0001), Burkholderiales (P<0.0001), and Sphingomonadales (P<0.05); whereas in uninvaded soil, there was more Rubrobacterales (P<0.001).
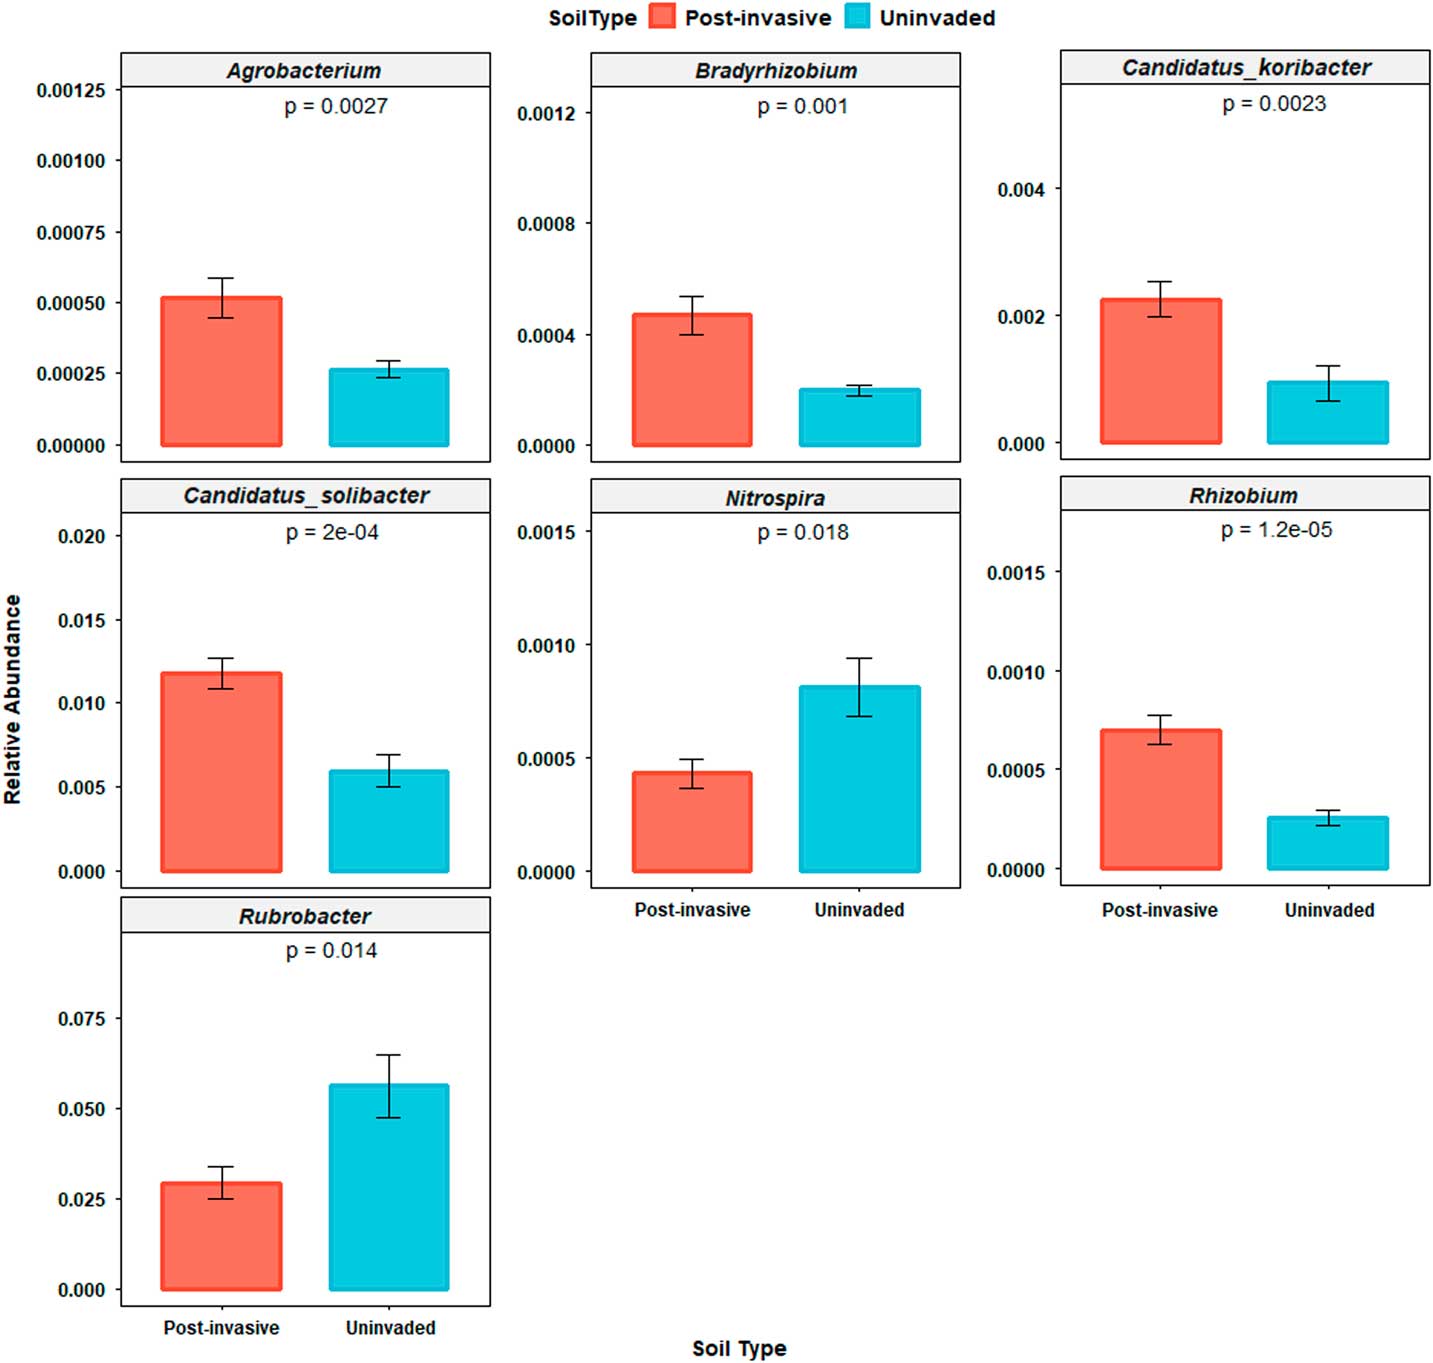
The Rubrobacter genus was the most abundant genus identified, accounting for ~3.9% of sequences in each sample. This genus was most abundant in uninvaded soil compared with postinvasive soil (P<0.05). Of the remaining 114 detected low-abundance genera, six differed between soil types: Agrobacterium (P<0.01), Bradyrhizobium (P<0.01), Rhizobium (P<0.0001), Candidatus koribacter (P<0.01), and C. solibacter (P<0.001) were more abundant in postinvasive soil, while Nitrospira (P<0.05) was more abundant in uninvaded soil (Figure 5). Within Rhizobium, only R. leguminosarum (a mutualistic symbiont of legumes) was detected.

Figure 5 Relative abundances of genera (Agrobacterium, Bradyrhizobium, Candidatus koribacter, Candidatus solibacter, Nitrospira, and Rubrobacter) that were significantly different between soil types. SEs are represented in the figure by the error bars attached to each column.
Proteobacteria and Bacteroidetes are commonly found in a variety of soils, mainly those rich in nutrients, while Bradyrhizobium and Rhizobium are symbiotic N fixers that can be found in plant root nodules. Candidatus koribacter and C. solibacter (Acidobacteria) may be important for nitrate reduction (Ward et al. Reference Ward, Challacombe, Janssen, Henrissat, Coutinho and Wu2009), and Nitrospira is a nitrite-oxidizing bacteria that is integral to the N cycle and increasing plant-available N in soils.
The increased amount of nitrate in the postinvasive soil may be the reason nitrate-reducing bacteria are more abundant in these soils, though the decreased abundance of nitrifying bacteria, such as Nitrospira, has been found in other studies (Rice Reference Rice1964). Rubrobacter is a genus well adapted for living in semi-arid, exposed soils; it may be that this genus is indicative of a healthy soil community, so its displacement by the invasive grass may be a sign of declining soil health.
The greater abundance of Rhizobium and Bradyrhizobium in the postinvasive soil is odd considering P. aquatica is a nonleguminous plant. In fact, other studies show a direct negative effect of invasive plants on N-fixing microbes (Sanon et al. Reference Sanon, Béguiristain, Cébron, Berthelin, Ndoye and Leyval2009). A few studies have shown that diazotrophic bacteria exist in grass roots and that these grasses derive a significant amount of N from them, but the bacteria involved are not Rhizobia (Umali-Garcia et al. 1980). Rhizobial bacteria exclusively nodulate legumes and are found on only one nonlegume taxon, Parasponia. This association is a recent host switch by the Bradyrhizobia involved and not a historical relationship (Lafay et al. Reference Lafay, Bullier and Burdon2006). It may be that P. aquatica is associating with free-living N-fixers in some way that benefits its growth.
AMF Composition
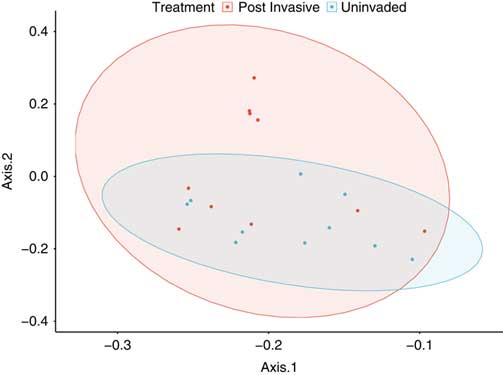
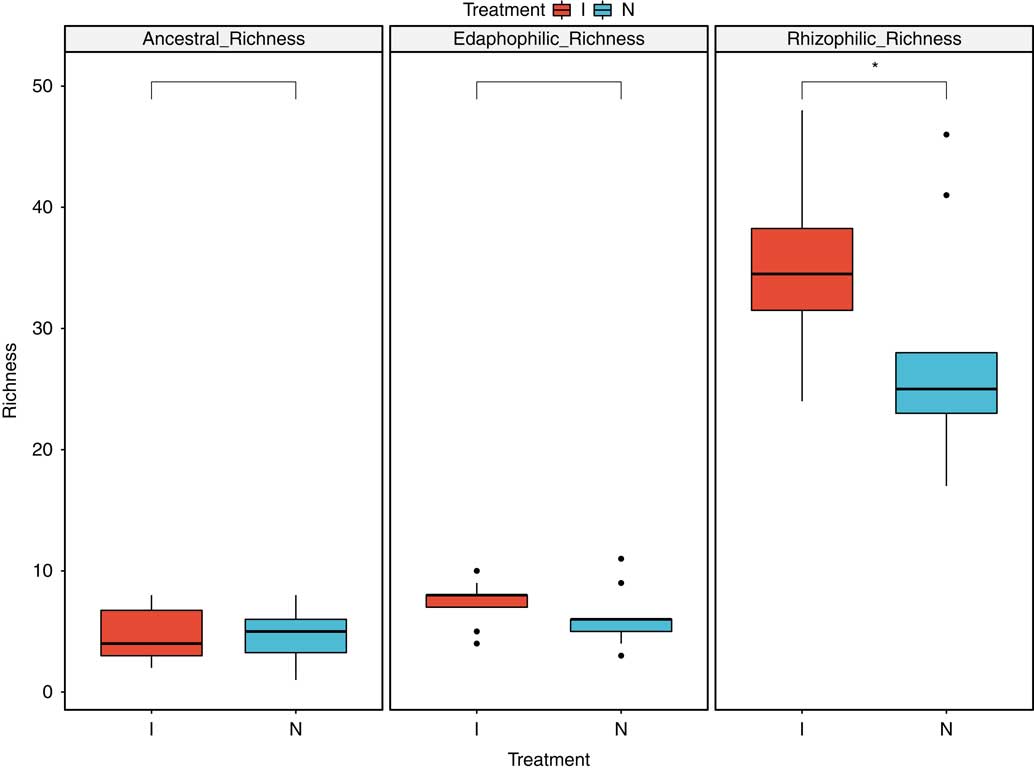
Despite the lack of vegetation in the postinvasive soil, we still expected to find plant-associated AMF, because hyphae and spores can remain in the soil years after a plant has been removed. The total fungal composition (Figure 6) of the uninvaded and postinvasive soils did not differ (P > 0.05). All operational taxonomic units belonged to four orders, 10 families, and 12 genera within Glomeromycotina. We found the following 11 genera: Acaulospora, Ambispora, Archaeospora, Claroideoglomus, Diversispora, Entrophospora, Geosiphon, Glomus, Kuklospora, Paraglomus, and Scutellospora. All samples were organized into either rhizophilic AMF, edaphophilic AMF, or ancestral AMF guilds, as described earlier. Rhizophilic AMF richness was higher in postinvasive soil than in uninvaded soil (P<0.05), while richness of edaphophilic and ancestral AMF did not differ by soil type (Figure 7). This finding points to the enhanced mutualism hypothesis: the postinvasive soil has more rhizophilic AMF, which are thought to protect plant roots from pathogens, possibly allowing the P. aquatica to invade and thrive. While it cannot be shown with this study, it is possible that the P. aquatica brought the rhizophilic AMF with it when it invaded (Sieverding and Oehl Reference Sieverding and Oehl2005). It is also possible that rhizophilic AMF abundance increases in soils with higher nitrate concentration or that the P. aquatica is more mycorrhizal than the native plants.
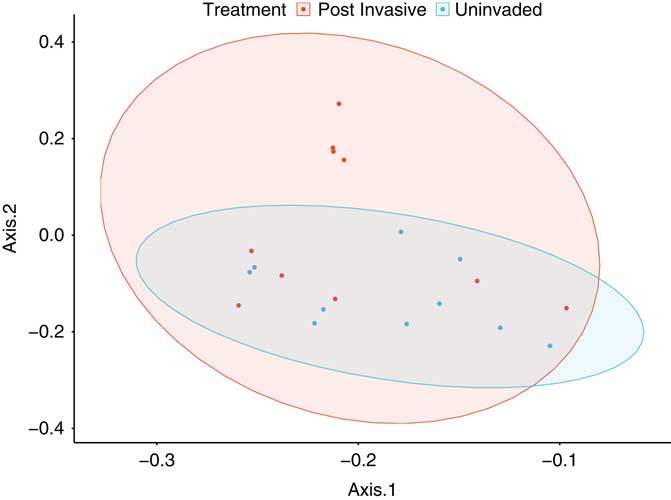
Figure 6 Principal coordinates analysis plot based on the weighted Unifrac distance metric for all arbuscular mycorrhizal fungal taxa. Ellipses represent SDs of the weighted average of treatments at the 95% confidence level.

Figure 7 Arbuscular mycorrhizal fungal soil communities by functional group using the hyphal functional scheme of Weber et al. (Reference Weber, Diez, Andrews, Goulden, Aronson and Allen2018). Richness was defined as the number of times a unique taxonomic unit was discovered in each sample. *Denotes significant difference by soil type at P<0.05.
Plant Growth Trends
After 7 mo of growth (October 2013 to May 2014) in the greenhouse, there was a significant correlation between plant growth and soil type that was species specific. The invasive, P. aquatica, had a larger biomass (P<0.05), and the native, A. californica, had a larger biomass (P<0.001) and length (P<0.05) in uninvaded soil compared with postinvasive soil. Salvia leucophylla and B. pilularis growth were not affected by soil type.
The survival rate for the species ranged from 1% to 11.6%. Low survival rate can be typical of a growth experiment such as this one, in which fertilizer was not added to the soil mix. The seed was also collected from RSV and could have been a weaker year/crop. The only significant differences in mean survival rate occurred for P. aquatica (P < 0.01) and A. californica (P<0.05) grown in uninvaded versus postinvasive soil (Figure 8). The P. aquatica survival rate was 2.31 times lower in uninvaded soil (4.2%±1% SE) than in postinvasive soil (9.7%±2% SE). The A. californica survival rate was 2.5 times higher in uninvaded soil (2.5%±0% SE) than in postinvasive soil (1%±0% SE). The B. pilularis and S. leucophylla survival rates were not significantly different between soil types.
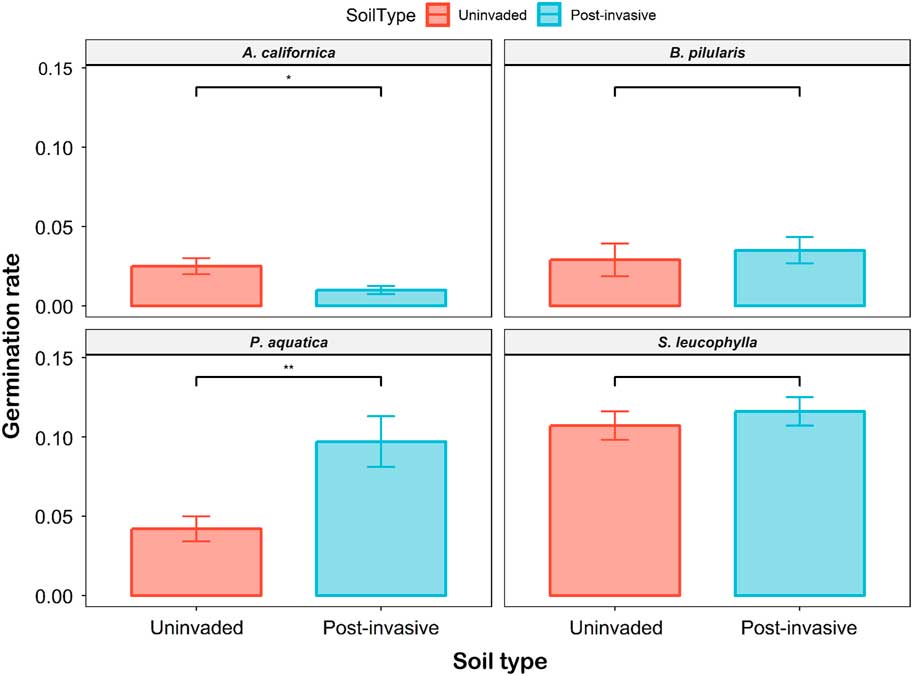
Figure 8 The survival rate of coastal sagebrush (Artemisia californica) (n=35), Baccharis pilularis (n=64), Phalaris aquatica (n=139), and Salvia leucophylla (n=210) in uninvaded (red) or postinvasive (blue) soils. SEs are represented in the figure by the error bars attached to each column. *Denotes significant difference by soil type at P<0.05; **denotes significant difference by soil type at P<0.01.
The mean total biomass for all species ranged from 0.02 to 0.6 g per pot. Again, the only significant differences occurred for the P. aquatica and A. californica grown in uninvaded versus postinvasive soils (Figure 9). The P. aquatica mean total biomass was 1.8 times higher in uninvaded soil than in postinvasive soil, and A. californica mean total biomass was 3.5 times greater in uninvaded soil than in postinvasive soil. For A. californica, the mean root mass (P<0.01) and the mean shoot mass (P<0.001) were also higher in the uninvaded soil. For P. aquatica, the mean root mass (P<0.05), but not mean shoot mass (P > 0.05), was also higher in the uninvaded soil. The mean total biomass was not significantly different for B. pilularis and S. leucophylla. The biomass root:shoot ratio was not significantly different between the uninvaded and postinvasive soil for all plants.
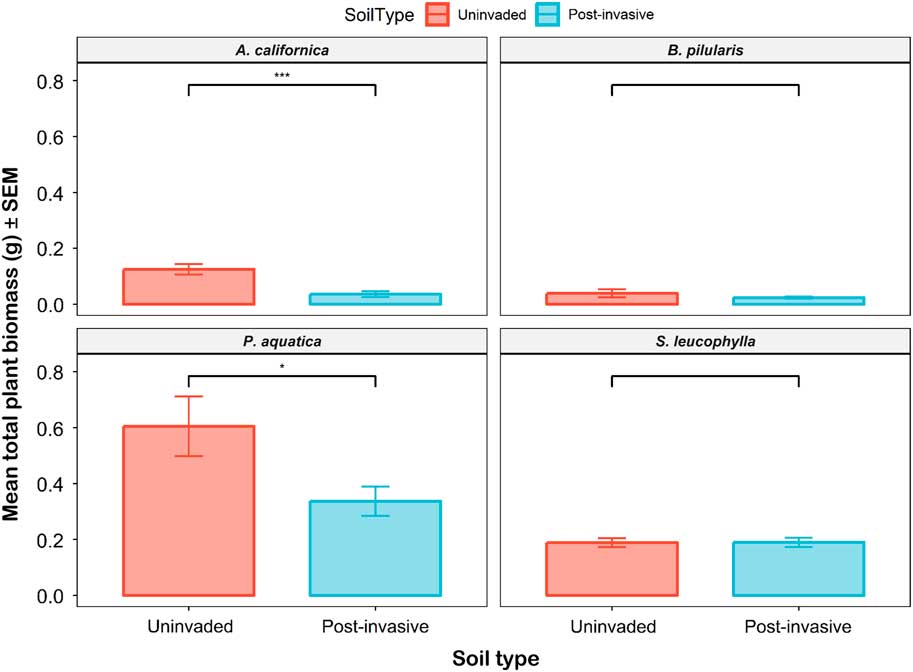
Figure 9 The mean total plant biomass of coastal sagebrush (Artemisia californica) (n=35), Baccharis pilularis (n=64), Phalaris aquatica (n=139), and Salvia leucophylla) (n=210) in uninvaded (red) or postinvasive (blue) soils. The mean total biomass for all species ranged from 0.02 g to 0.6 g per pot. SEs are represented in the figure by the error bars attached to each column. *Denotes significant difference by soil type at P<0.05; ***denotes significant difference by soil type at P<0.001.
The mean total seedling length for all species ranged from 13.3 to 308.2 mm per pot. The only significant difference occurred for the A. californica grown in uninvaded versus postinvasive soils (Figure 10). The A. californica mean total length was 2.05 times larger in uninvaded soil than in postinvasive soil. The mean shoot length (P<0.05), but not the mean root length (P > 0.05), was higher in the uninvaded soil. The P. aquatica, S. leucophylla, and B. pilularis mean total lengths were not statistically different between soil types (Supplementary Table S1). The length root:shoot ratio was not different between soil types for all plants except S. leucophylla (P<0.01), which had a higher root:shoot ratio in uninvaded soil.
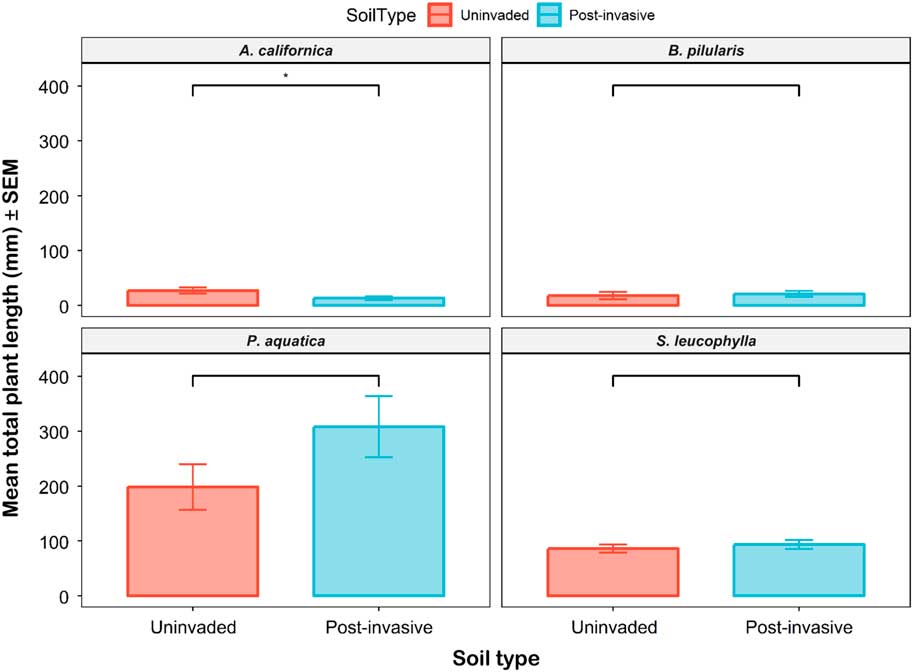
Figure 10 The mean total plant length of coastal sagebrush (Artemisia californica) (n=35), Baccharis pilularis (n=64), Phalaris aquatica (n=139), and Salvia leucophylla (n=210) in uninvaded (red) or postinvasive (blue) soils. The mean total seedling length for all species ranged from 13.25 mm to 308.15 mm per pot. SEs are represented in the figure by the error bars attached to each column. *Denotes significant difference by soil type at P<0.05.
The primary goal of this study was to determine whether the growth of three native shrubs and invasive P. aquatica would differ between uninvaded soil and soil from which a long-term P. aquatica invasion had been removed. We found that while the growth of two native species (S. leucophylla and B. pilularis) did not differ by soil type, one native species, A. californica, and the invasive, P. aquatica, did. The size of both A. californica and P. aquatica was decreased in postinvasive soil, the survival rate of A. californica was lower in the postinvasive soil, and the survival rate for P. aquatica was higher in the postinvasive soil, ostensibly due to higher soil N.
It is important to point out here that this study does not indicate whether bacteria and fungi are drivers or passengers in explaining the soil legacy effects. Rather, this study gives us a better understanding of the microbial legacy effects in postinvasive sites. We cannot directly explain the plant growth responses, but we can inform our understanding of what happens in these sites. It might be possible to explain plant growth responses if pathogenic and saprophytic fungal abundances were also quantified, as these microbial groups are very important to the healthy functioning of CSS.
Phalaris aquatica
The accumulation of local pathogens hypothesis may help explain why P. aquatica growth was lower in postinvasive soil. It may be that, over time, the P. aquatica monoculture caused an increase in Agrobacterium spp. in the postinvasive soil. This increase in a potential plant pathogen could cause a decline in P. aquatica growth relative to the uninvaded soil, which has a lower abundance of Agrobacterium.
Under the enhanced mutualism hypothesis, it may be that P. aquatica was able to form stronger mutualisms with microbes that exist in the uninvaded soil but no longer survive in large numbers in the postinvasive soil. When P. aquatica first invaded, it was introduced into a highly diverse system with many species of native plants that interact with a variety of soil microbes. Invasive plants can take advantage of these interactions, producing significantly higher biomass when grown in previously uninvaded soil. For example, a study by Maron and Connors (Reference Maron and Connors1996) found that the invasive annual grass ripgut brome (Bromus diandrus Roth.) had significantly higher root and shoot biomass when grown in soil collected under native shrubs that form mutualisms with N-fixing bacteria compared with soil collected 1 m away. It could be that the increase in rhizophilic AMF and increased abundance of Rhizobium and Bradyrhizobium observed in the postinvasive soil provided a growth benefit to the P. aquatica.
It is also possible that P. aquatica was able to prime the soil in ways that first increased, but then decreased its own growth. When a plant such as P. aquatica invades, it usually increases the amount of N in the soil. A meta-analysis by Liao et al. (Reference Liao, Peng, Luo, Zhou, Wu, Fang, Chen and Li2008) found that invaded soils had ~20% larger N pools and ~51% faster rates of N-mineralization compared with uninvaded soils. Unsurprisingly, P. aquatica increased nitrate and total N in postinvasive soil relative to uninvaded soil, most likely because of its high-quality leaf litter (low C:N). Increased soil N promotes the growth of bacteria that quickly mineralize N into plant available forms (NH3 and nitrate). The increased abundance of Proteobacteria and Bacteroidetes, which are likely copiotrophic (found in environments rich in nutrients) in postinvasive soil could be due to this increase in soil nitrate. Differences in N supply have been found to alter the relative abundance of copiotrophic taxa in other studies (e.g., Actinobacteria, Bacteroidetes, and β-Proteobacteria) (Fierer et al. Reference Fierer, Bradford and Jackson2007; Ramirez et al. Reference Ramirez, Craine and Fierer2012). This sort of soil priming would stimulate the growth of P. aquatica, which may be better adapted to high-N environments than many native shrubs (Perry et al. Reference Perry, Blumenthal, Monaco, Paschke and Redente2010). A monoculture of P. aquatica could have been the result of this soil priming. However, after many years of maintaining this monoculture, the microbial community may have shifted far enough from the original uninvaded soil community to negatively impact the growth of P. aquatica, which grew faster and larger in the naïve, uninvaded soil. Transporting rhizophilic AMF with it to the invaded range could have provided P. aquatica with more nutrients and pathogen protection, allowing it to establish and form a monoculture.
Native Plants
Of the three native plants studied, A. californica was the only one with significantly decreased mass and length in the postinvasive soil. This could be explained by an increase in soil N or an increase in pathogenic or free-living microbes. Increased soil N could promote the growth of plants such as P. aquatica that are better adapted to high N levels and harm the growth of plants like A. californica that are not (Perry et al. Reference Perry, Blumenthal, Monaco, Paschke and Redente2010). The increased abundance of several potentially beneficial bacterial taxa and rhizophilic AMF with P. aquatica invasion could have potentially helped A. californica growth, if not for the increased soil N. Alternatively, the favoring of certain microbial groups by the invasive grass in postinvasive soil may have allowed certain microbes to outcompete microbial taxa that are important to the growth of A. californica. It is also possible that the Agrobacterium accumulation in the postinvasive soil was pathogenic to A. californica.
It may be that the other native plants studied, S. leucophylla and B. pilularis, were unaffected either because the invasive did not alter the abundance of bacteria and AMF critical to their health and well-being or because they are more resilient to changes in soil N. There could be a potentially complex interaction between the soil nutrients and soil biota, such that these two native plants were benefited by the increased Rhizobium, Bradyrhizobium, and rhizophilic AMF in the postinvasive soil, despite the elevated N.
Reduced native plant colonization in the field could be a result of elevated soil nitrate or an accumulation of pathogenic bacteria. There also may be some legacy effects not measured in the greenhouse experiment, such as an alteration to the pathogenic or saprophytic soil fungi composition or soil physical characteristics that may reduce establishment. In the greenhouse, the soil is mixed before potting, and the plants are provided with ideal growth conditions. If this experiment were repeated as a field experiment, we might find that B. pilularis and S. leucophylla are instead inhibited by unmeasured legacy effects in the soil.
It is possible that these observed trends are due to the loss of the native species or preinvasion environmental differences, abiotic changes that were not measured, presence of glyphosate in the soil, or other biotic changes, such as shifts in pathogenic or saprotrophic fungi. Regardless of what the preinvasion conditions were, the long (at least 11 yr) duration of invasion at this site indicates that the observed trends are most likely due to the invasive grass growth and not preinvasion conditions. In addition, both uninvaded and postinvasive sites have similar sun exposure, moisture (P > 0.05), slope aspect, soil texture (Mipolomol), pH (P > 0.05), and elevation. Glyphosate is also an unlikely factor, because its half-life is approximately 2 wk, and it does not have residual soil activity on the seedbank. While it took several years of treatment before the population was eradicated (locally), several years had elapsed after herbicide treatment had ceased. In many other areas of RSV, native recolonization from the seedbank has occurred after glyphosate application to other invasive plants. We did observe differences in the total N and C concentration of soils, so it is most likely that the unique traits of P. aquatica that differentiate it from native shrubs are responsible for the trends observed in this study.
Although this study shows evidence that exotic grass invasions and their subsequent removal have lasting impact on above- and belowground ecosystems, it has some spatial limitations. For instance, we collected our samples from one site in Southern California that was previously invaded by P. aquatica and from an intact site replete with native vegetation. Therefore, our conclusions are limited solely to this ecosystem. However, we observed reduced native plant performance after P. aquatica removal over several years before conducting our experiment in this particular site, which motivated our study in comparing the intact and postinvasion sites within this particular study location. The justification for our experimental setup is 3-fold: (1) replicating a large-scale postinvasive site would be costly and impractical: this would require another site with a long-term P. aquatica monoculture and several years to remove said monoculture; (2) park restoration ecologists observed this specific P. aquatica invasion site over several years and noted the lack of native plant growth after invasive removal; and (3) this is a natural laboratory, with “invasion” as the treatment, therefore, it would be unethical to “treat” a native area with invasive plants for the sake of replication.
Legacy Effects
Due to the long period of invasion and the persistence of differences between the microbial communities and nutrient composition in the uninvaded and postinvasive soils after the invasive grass was removed, these results should be considered legacy effects of P. aquatica. Some long-term plant invasions are known to change soil in ways that persist for years after the invasive plant has been removed (“legacy effects”; Kulmatiski and Beard Reference Kulmatiski and Beard2011), although this is not always the case (Jordan et al. Reference Jordan, Larson and Huerd2008). Legacy effects are normally defined as the abiotic and biotic impacts of a species that persist long after the species has been removed from an area (Cuddington Reference Cuddington2011). In some cases, even with active management, legacy effects can be so severe that they take decades to reverse (Eviner et al. Reference Eviner, Hoskinson and Hawkes2010). Several short-term studies have shown that invasive plants can alter soil biotic communities in ways that disrupt plant community composition, plant–soil interactions, and plant–plant interactions (Reinhart and Callaway Reference Reinhart and Callaway2006). Taken in concert with our findings, it appears that these effects of invasion may not always attenuate over time.
Legacy effects of invasive plants have been shown to affect native species in sometimes contradictory ways. Studies focused on understanding the effect of invasive plant growth on natives often have conflicting results, largely dependent upon the specific native and invasive species studied (Bozzolo and Lipson Reference Bozzolo and Lipson2013), the length of invasion, invader percent cover, and site specifics (Eviner et al. Reference Eviner, Hoskinson and Hawkes2010). While relatively little is known about legacy effects (Corbin and D’Antonio Reference Corbin and D’Antonio2012), it does seem that legacies in soil are directly dependent on the invasive being studied (Hausmann and Hawkes 2009). It may be that the specific ways in which P. aquatica alters the soil is key to understanding the observed plant growth trends.
Overall, the findings of our study indicate that P. aquatica creates microbial legacy effects in the soil that likely cause soil conditions inhibitory to the growth of some native CSS plants. Future work will focus on determining whether differences in native plant growth can be explained by biotic changes in the soil brought on by P. aquatica and whether remediation of soil microbial conditions through soil inoculations could improve restoration in these postinvasive sites. We will specifically explore whether changes in the composition of bacteria, pathogenic fungi, and AMF explain differences in native plant growth.
Inoculation experiments have shown encouraging results for restoration efforts; however, it may be useful to evaluate how certain functional groups of invasive plants alter the soil microbial composition. This would provide us with an accurate framework to inform restoration practices. Much more information is needed about the long-term impact of invasion on soil microbes to properly restore the biotic properties of soils.
Acknowledgments
This research was supported by the National Park Service, USDA NIFA AFRI grant CA-R-PPA-5101-CG, USDA NIFA HATCH grant CA-R-PPA-5093-H, and NSF ICER-1541047. Also, BP was supported by the National Science Foundation Graduate Fellowship DGE-1326120 and the UCR Center for Conservation Biology Shipley Skinner fund. We thank T. Barsotti, C. Carey, K. Caso, D. Jackson, G. Logan, M. Maltz, R. Richards, S. Saroa, H. Shulman, A. Swanson, and J. Valliere for intellectual feedback and insightful comments on previous drafts. No conflicts of interest have been declared.
Supplementary material
To view supplementary material for this article, please visit https://doi.org/10.1017/inp.2018.32